Foot, Ankle, and Calf
Thomas H. Berquist
Protocols
Key Facts
Routine radiographs
Ankle: anteroposterior (AP), lateral, mortise view
Foot: standing AP, standing lateral, oblique (Certain patients may not be able to stand. In this case, non–weight-bearing views are obtained.)
Other Options
Indication
AP, varus, valgus stress views
Ligament injuries
Fluoroscopic spot views
To align bones and reduce overlap
Sesamoid views
Osteonecrosis or fracture
Computed tomography (CT)
Bone and soft tissue settings
512 × 512 matrix
Field of view 14 to 20 cm (depends on area and both ankles and/or feet done for comparison)
Slice thickness 4 to 5 mm for routine, 1-mm sections at 0.5-mm intervals for reformatting in different planes, or three-dimensional reconstruction
Magnetic resonance imaging (MRI)
Patient positioning: Supine with foot in neutral position for most ankle studies including the Achilles tendon. Slight plantar flexion (20 degrees) for the other ankle tendons. Prone to reduce motion for forefoot studies.
Coil selection: Extremity coil for foot and ankle. Three- or five-inch flat coil for forefoot. Head coil for comparison studies. Dual circular coils for motion studies.
Additional parameters are summarized in Table 6-1.
TABLE 6-1 MAGNETIC RESONANCE PARAMETERS FOR THE FOOT, ANKLE, AND CALF | ||||||||||||||||||||||||||||||||||||||||||||||||||||||||||||||||||||||||||||||||||||||||||||||||||||||||||||||||||||||||||||||||||||||||||||||||
|---|---|---|---|---|---|---|---|---|---|---|---|---|---|---|---|---|---|---|---|---|---|---|---|---|---|---|---|---|---|---|---|---|---|---|---|---|---|---|---|---|---|---|---|---|---|---|---|---|---|---|---|---|---|---|---|---|---|---|---|---|---|---|---|---|---|---|---|---|---|---|---|---|---|---|---|---|---|---|---|---|---|---|---|---|---|---|---|---|---|---|---|---|---|---|---|---|---|---|---|---|---|---|---|---|---|---|---|---|---|---|---|---|---|---|---|---|---|---|---|---|---|---|---|---|---|---|---|---|---|---|---|---|---|---|---|---|---|---|---|---|---|---|---|---|
| ||||||||||||||||||||||||||||||||||||||||||||||||||||||||||||||||||||||||||||||||||||||||||||||||||||||||||||||||||||||||||||||||||||||||||||||||
Suggested Reading
Berquist TH. MRI of the musculoskeletal system, 5th ed. Philadelphia: Lippincott Williams & Wilkins; 2006:430–556.
Farooki A, Sakoloff RM, Theudorou DJ, et al. Visualization of ankle tendons and ligaments with MR imaging. Influence of positioning. Foot Ankle 2002;23:554–559.
Fractures/Dislocations: Ankle Fractures—Pediatric
Key Facts
Image features of ankle fractures depend on age (growth plate development), relationship of ligaments to epiphyses, and mechanism of injury.
Metaphyseal and diaphyseal fractures frequently are incomplete.
Fractures of the distal tibia and fibula frequently involve the growth plate.
Fracture of the distal tibial physis is the second most common growth plate injury.
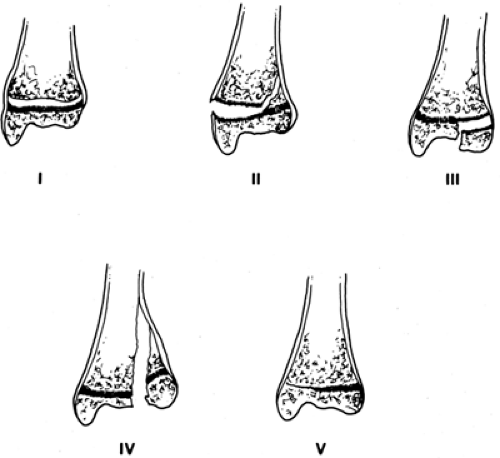
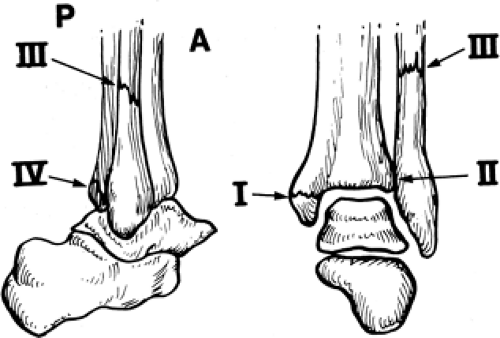
The Salter-Harris classification frequently is used for growth plate fractures:
Type I Separation of epiphysis, fracture confined to growth plate (6%)
Type II Fracture through growth plate extending into the metaphysis (75%)
Type III Fracture through growth plate extending through epiphysis (8%)
Type IV Extends from articular surface of epiphysis through growth plate and metaphysis (10%)
Type V Compression of growth plate (1%)
Complications are more significant with Types III to V.
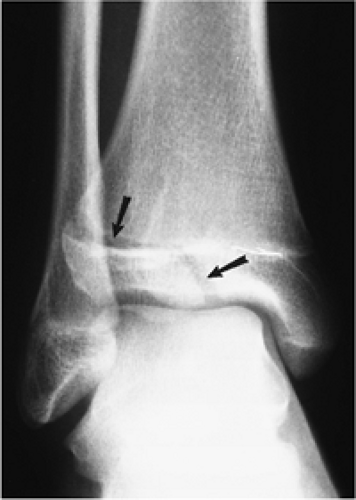
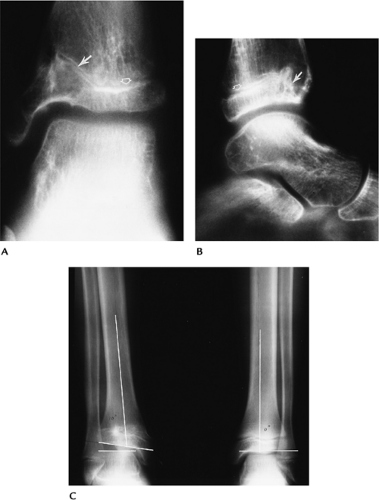
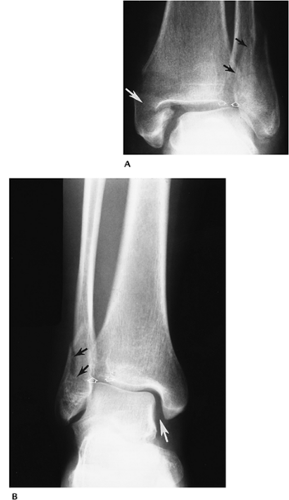
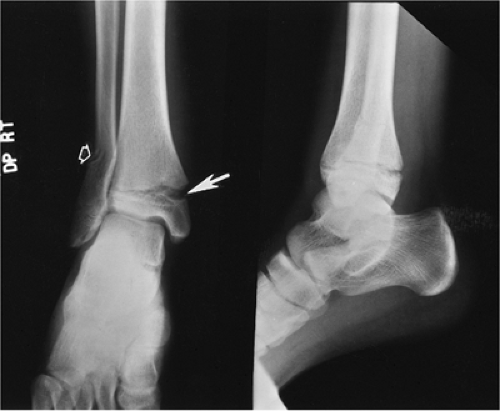 FIGURE 6-3 AP (A) and lateral (B) radiographs of an eversion injury with opening of the tibial physis (arrow) and an incomplete fibular fracture (open arrow). |
Suggested Reading
Rogers LF. Radiology of epiphyseal injuries. Radiology 1970;96:289–299.
Fractures/Dislocations: Ankle Fractures—Pediatric: Triplane Fracture
Key Facts
Triplane fractures are the result of external rotation forces and account for 6% of physeal fractures.
The fracture consists of three fragments instead of two seen with most growth plate fractures.
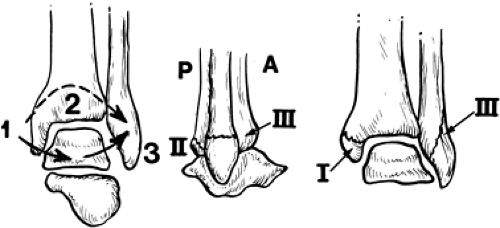
Fracture fragments include (1) anterior lateral tibial epiphysis (Salter-Harris III); (2) remainder of the tibial epiphysis with metaphyseal attachment (looks like Salter-Harris II); and (3) tibial metaphysis.
Complication rates are similar to those for a Salter-Harris Type IV fracture.
CT may be required to properly characterize the injury.
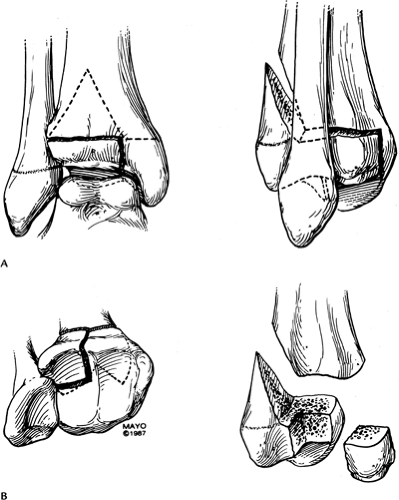 FIGURE 6-4 Triplane fracture seen from the front and side (A) and from the articular surface and with fragments separated (B). |
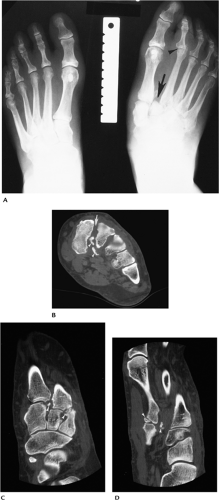
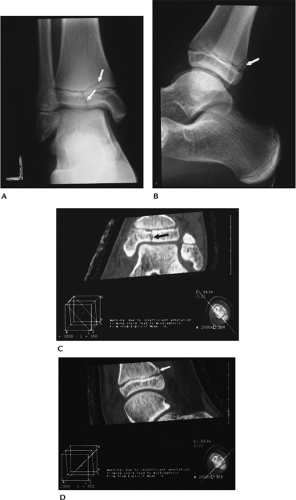 FIGURE 6-5 AP (A) and lateral (B) radiographs demonstrate a triplane fracture (arrows). Coronal (C) and sagittal (D) reformatted CT images define the fractures (arrow) and degree of displacement. |
Suggested Reading
Cone RO III, Nguyen V, Flournoyr JG, et al. Triplane fracture of the distal tibial epiphysis. Radiologic and CT studies. Radiology 1984;153:763–767.
Fractures/Dislocations: Ankle Fractures—Pediatric: Juvenile Tillaux
Key Facts
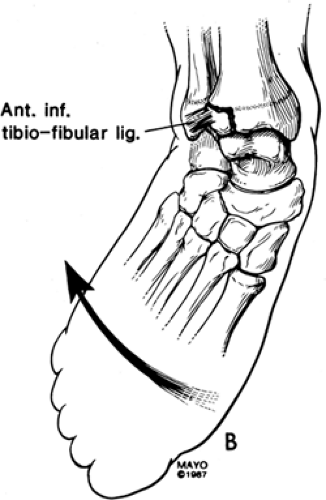
Distal tibial epiphysis fuses from medial to lateral, placing the lateral physis at risk in adolescents.
Distal tibial physis fuses at approximately age 15 years in females and age 17 years in males.
Juvenile Tillaux fracture is a Salter-Harris Type III fracture of the lateral tibial physis.
The fracture is displaced by the distal tibio-fibular ligament when the foot is externally rotated.
Suggested Reading
Mann DC, Rajmaira S. Distribution of physeal and nonphyseal fractures in 2,650 long bone fractures in children aged 10 to 16 years. J Pediatr Orthop 1990;10:713–716.
Fractures/Dislocations: Ankle Fractures—Pediatric Complications
Key Facts
Fractures not involving the growth plate generally heal without sequelae.
Growth plate fractures may heal with premature or asymmetric closure. Complications vary with Salter-Harris fracture type.
Low risk (6.7% complications): Types I and II fibular fractures; Types I, III, and IV tibial fractures with less than 2 mm of displacement
High risk (32% complications): Types III and IV tibial fractures with more than 2 mm of displacement; juvenile Tillaux fractures, triplane fractures, comminuted epiphyseal fractures, and Type V fractures
Complications include leg length discrepancy, rotational deformity, malunion, nonunion, and avascular necrosis.
Routine radiographs usually are adequate to define complications. CT or MRI may be required to assess growth plate involvement.
Suggested Reading
Spiegel PG, Cooperman DR, Laros GS. Epiphyseal fractures of the distal ends of the tibia and fibula. J Bone Joint Surg 1978;60A:1046–1050.
Fractures/Dislocations: Ankle Fractures—Adult
Key Facts
The mechanism of injury for ankle fractures is rarely pure inversion (supination) or eversion (pronation). Abduction, adduction, lateral rotation, and axial loading forces usually are associated.
Fracture patterns, specifically the location and appearance of the fibular fracture and talar shift in the ankle mortise, can allow definition of the mechanism of injury and ligament involvement in more than 90% of cases.
AP, lateral, and mortise views usually are adequate for diagnosis.
The lateral view is particularly useful to define joint effusions. An effusion should raise the question of subtle osteochondral injury, which may require CT or MRI for further evaluation.
Suggested Reading
Arimoto HR, Forrester DM. Classification of ankle fractures. An algorithm. AJR Am J Roentgenol 1980;135:1057–1063.
Fractures/Dislocations: Ankle Adult—Supination-Adduction Injuries
Key Facts
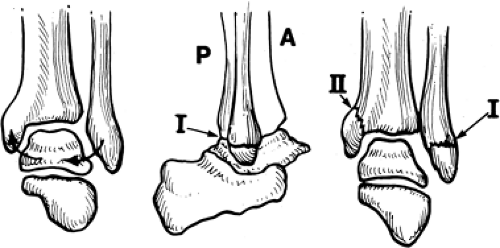
Supination-adduction injuries (inversion) cause traction laterally, resulting in ligament injury or a transverse lateral malleolar fracture below the ankle joint (Stage I). When force continues, a medial impaction (steep oblique) fracture of the medial malleolus occurs (Stage II) (Fig. 6-10).
Supination-adduction injuries account for approximately 20% of ankle fractures.
Treatment is conservative unless fragments are displaced more than 2 mm.
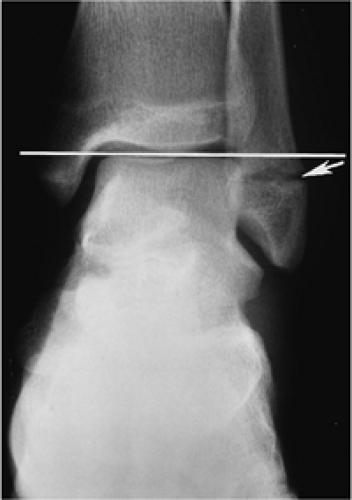 FIGURE 6-11 Supination-adduction injury with a transverse fracture of the lateral malleolus (arrow) below the level of the ankle joint (line). |
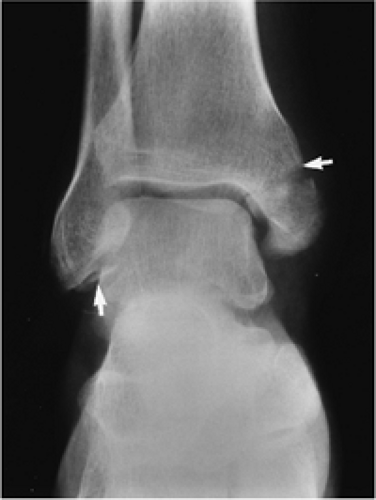 FIGURE 6-12 Supination-adduction Stage II injury with an oblique fracture (arrow) of the medial malleolus and avulsed fragments from the lateral malleolus (arrow). |
Suggested Reading
Lauge-Hansen N. Fractures of the ankle. II. Combined experimental-surgical once experimental roentgenologic investigations. Arch Surg 1950;60:957–985.
Fractures/Dislocations: Ankle Adult—Supination Lateral Rotation Injuries
Key Facts
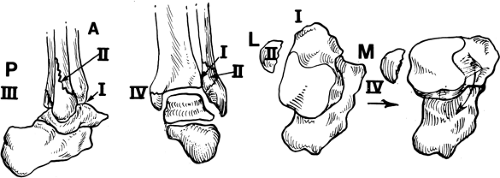
Supination lateral rotation injuries cause medial tension, with the talus causing posterior displacement of the lateral malleolus.
The anterior distal tibiofibular ligament is injured (Stage I). If force continues, a spiral fracture of the lateral malleolus occurs just above the joint (best seen on the lateral view). This Stage II injury is the most common ankle fracture. With continued force, a posterior tibial fracture or distal tibiofibular ligament tear occurs (Stage III), and eventually a transverse medial malleolar or medial (deltoid) ligament injury occurs (Stage IV) (Fig. 6-13).
Supination lateral rotation injuries account for 55% to 58% of ankle fractures.
All supination or inversion injuries account for 75% to 78% of ankle fractures.
Treatment is conservative if displacement is 2 mm or less.
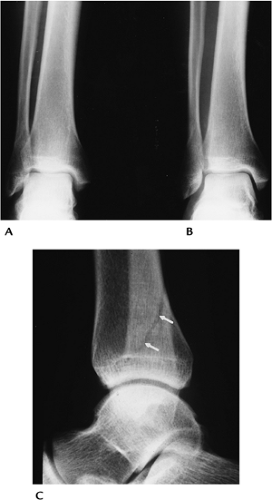 FIGURE 6-14 Supination-lateral rotation Stage II injury. AP (A), mortise (B), and lateral (C) radiographs. The fracture is only clearly demonstrated on the lateral (C) view (arrows). |
Suggested Reading
Berquist TH. Radiology of the foot and ankle, 2nd ed. Philadelphia: Lippincott Williams & Wilkins; 2000:171–280.
Fractures/Dislocations: Ankle Adult—Pronation-Abduction Injuries
Key Facts
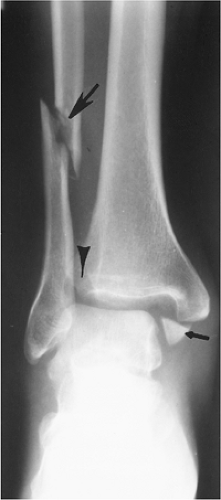
Pronation-abduction (eversion) injuries result from medial tension leading to deltoid ligament injury or a transverse medial malleolar fracture (Stage I). Continued force results in tears of the anterior and posterior distal tibiofibular ligaments or a posterior tibial fracture (Stage II) followed by an oblique lateral malleolar fracture near the joint level (best seen on AP view) (Stage III) (Fig. 6-15).
When displaced, internal fixation is necessary to reduce the ankle mortise.
Suggested Reading
Arimoto HR, Forrester DM. Classification of ankle fractures: An algorithm. AJR Am J Roentgenol 1980;135:1057–1063.
Fractures/Dislocations: Ankle Adult—Pronation Lateral Rotation Injuries
Key Facts
Pronation lateral rotation injuries cause medial tension as the talus rotates laterally.
The medical malleolus (low transverse fracture) or medial ligaments are injured initially (Stage I). As force continues, the anterior tibiofibular and interosseous membranes are torn (Stage II), followed by a high fibular fracture (more than 5 to 6 cm above the joint) (Stage III). Posterior tibial avulsion or distal tibiofibular ligament tears occur with continued force (Stage IV) (Fig. 6-17).
Pronation injuries account for 22% to 25% of ankle fractures.
Treatment of these fractures usually requires internal fixation of the fibular fracture and screw fixation of the medial malleolus.
Suggested Reading
Arimoto HR, Forrester DM. Classification of ankle fractures: An algorithm. AJR Am J Roentgenol 1980;135:1057–1063.
Fractures/Dislocations: Ankle Adult—Plafond Fractures (Pilon)
Key Facts
Plafond fractures do not fit neatly into other fracture classifications. Tibial plafond fractures account for less than 10% of lower extremity fractures.
Fractures are the result of axial loading; 72% occur in patients less than 50 years of age.
Up to 20% of plafond fractures are open, resulting in increased incidence of infection.
Treatment of these fractures is difficult, because the articular surface needs to be anatomically reduced.
CT and MRI may be required to clearly demonstrate the extent of injury for surgical treatment planning.
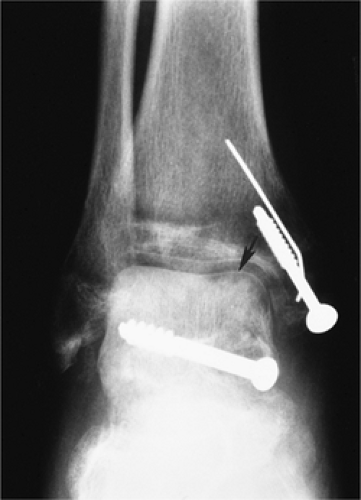
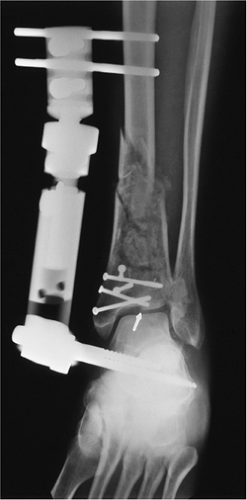 FIGURE 6-19 Mortise view of a tibial plafond fracture reduced with external fixateur and tibial screws. Note the residual articular deformity (arrow). |
Suggested Reading
Bonar SK, Marsh JL. Tibial plafond fractures: Changing principles of treatment. J Am Acad Orthop Surg 1994;2:297–304.
Ovadia DN, Beals RK. Fractures of the tibial plafond. J Bone Joint Surg 1986;68A:543–551.
Fractures/Dislocations: Ankle Adult—Complications
Key Facts
Complications resulting from ankle fractures may be related to injury or treatment.
Loss of reduction occurs more commonly with closed techniques (casting) than internal fixation.
Degenerative arthritis is the most common long-term complication, occurring in 30% to 40% of cases.
Complications are summarized as follows:
Loss of reduction (up to 26% treated by casting alone)
Osteoarthritis
Chronic instability
Loss of motion
Nonunion
Malunion
Reflex sympathetic dystrophy
Infection
Adhesive capsulitis
Tendon rupture
Neurovascular injury
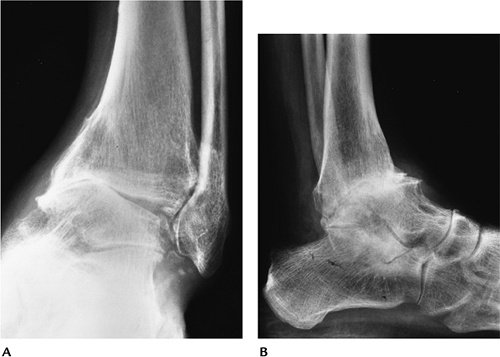 FIGURE 6-20 AP (A) and lateral (B) radiographs demonstrating severe posttraumatic arthritis with osseous fragments in the joint and marked tibiotalar joint asymmetry. |
Suggested Reading
Pettrone FA, Gail M, Pee D, et al. Quantitative criteria for prediction of results of displaced fracture of the ankle. J Bone Joint Surg 1983;65A:667–677.
Fractures/Dislocations: Talar Fractures—Talar Neck
Key Facts
Fractures of the talar neck are common in adults and rare in children.
Talar fractures account for 6% of foot and ankle injuries and 30% of talar fractures.
The mechanism of injury is abrupt dorsiflexion of the foot during a fall or motor vehicle accident.
Talar neck fractures may be undisplaced or displaced. The latter are associated with subtalar subluxation/dislocation.
Displaced fractures usually require internal fixation.
Complications include avascular necrosis (usually evident by 6 to 8 weeks), osteoarthritis (97%), and malunion or nonunion (15%).
Suggested Reading
Daniels TR, Smith JW. Talar neck fractures (review). Foot Ankle 1993;14:225–234.
Hawkins LG. Fractures of the neck of the talus. J Bone Joint Surg 1970;52A:991–1002.
Fractures/Dislocations: Talar Fractures—Body, Head, Process Fractures
Key Facts
Fractures of the talar body and posterior or lateral processes are uncommon in adults and rare in children.
Most fractures are the result of significant falls or motor vehicle accidents with axial compression.
Lateral talar process fractures (“snowboarder’s fracture”) are easily missed on radiographs (40% are overlooked initially).
CT is important to detect and manage talar body and process fractures.
Treatment is anatomic reduction, which requires internal fixation for displaced fractures.
Complications are the same as with talar neck fractures. Malunion and avascular necrosis occur in 16%.
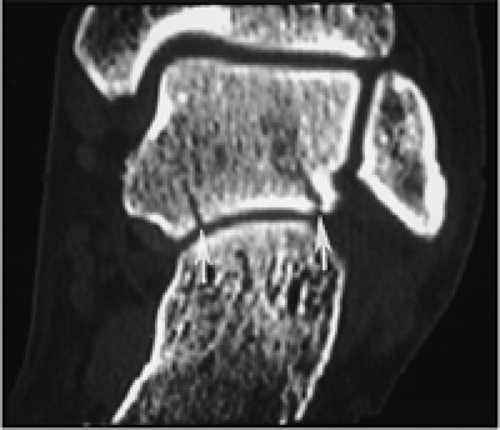 FIGURE 6-24 Coronal CT image demonstrating talar body fractures (arrows) entering the posterior subtalar joint. |
Suggested Reading
Boack DH, Manegold S. Peripheral talar fractures. Injury 2004;35(S2):B23–B25.
Sneppen O, Christensen SB, Krogsoe O, et al. Fracture of the body of the talus. Acta Orthop Scand 1977;48:317–324.
Fractures/Dislocations: Talar Fractures—Talar Dome Fractures
Key Facts
This is the most common talar fracture.
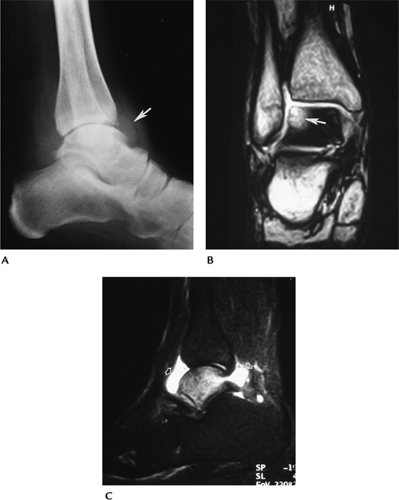
Talar dome fractures are difficult to detect (50% missed), and prognosis is more guarded compared with nonarticular chip or avulsion fractures.
Fractures are most common in adults. Only 8% occur in patients less than 16 years of age.
Acute lesions are most often lateral. Ten percent involve both the lateral and medial talar dome.
CT or MRI is important for detection, localization, and measurement of lesion size and displacement.
Displaced lesions should be resected or arthroscopically removed.
Arthrosis is the most common complication (50%).
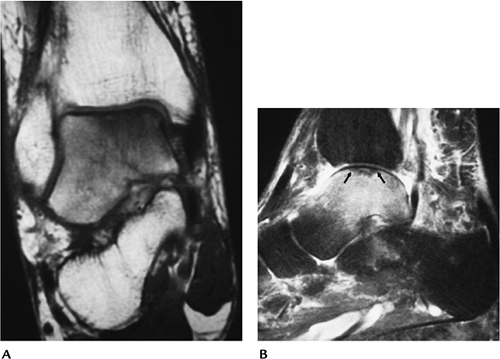 FIGURE 6-25 Coronal T1- (A) and fat-suppressed sagittal T2-weighted (B) images demonstrate marrow edema and a subtle nondisplaced talar dome fracture (arrows). |
Suggested Reading
Clark TWI, Janzen DL, Kendall H, et al. Detection of radiographically occult ankle fractures following acute trauma. Positive predictive value of ankle effusion. AJR Am J Roentgenol 1995;164:1185–1189.
Fractures/Dislocations: Talar and Subtalar Dislocations
Key Facts
The majority of eversion and inversion motion occurs in the subtalar joint.
Talar dislocations account for only 1% of all dislocations.
Fifteen percent of talar injuries are caused by dislocation.
Subtalar dislocations may be medial (56%), lateral (34%), posterior (6%), or anterior (4%).
Associated talar or calcaneal fractures occur in 75% of lateral and 45% of medial dislocations.
Total dislocation is rare. There is a high incidence of infection, which may require talectomy. Avascular necrosis also is common.
Post-reduction CT with coronal and sagittal reformatting is essential to assess reduction and detect associated fractures.
Suggested Reading
Detenbeck LC, Kelly PJ. Total dislocation of the talus. J Bone Joint Surg 1969:51A:283–288.
Fractures/Dislocations: Calcaneal Fractures—Intra-articular
Key Facts
The calcaneus is the most commonly fractured bone in the adult foot, accounting for 60% of foot fractures, but only 2% of all skeletal fractures.
Calcaneal fractures in children account for only 5% of calcaneal fractures.
Pediatric fractures usually are extra-articular (63%), whereas adult fractures usually are intra-articular (70% to 75%).
Most adult fractures are the result of axial loading resulting from falls or motor vehicle accidents. Ten percent are bilateral. Associated vertebral fractures occur in 10%.
CT with coronal and sagittal reformatting is required to classify the injury and access articular involvement and fracture complexity.
Treatment goals are to re-establish articular alignment, calcaneal width, and the posterior facet (Böhler’s angle).
Complications include
Prolonged pain and disability
Lower extremity fractures (20%–46%)
Soft tissue injury
Neurovascular injury
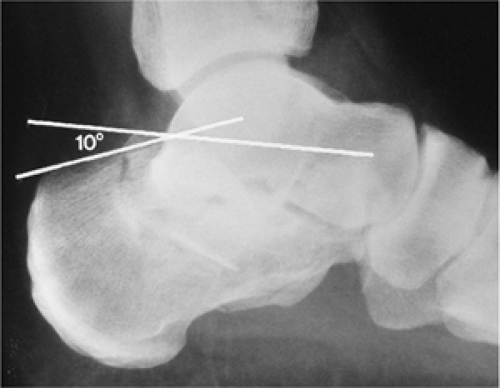 FIGURE 6-28 Lateral radiograph in a patient with a comminuted calcaneal fracture. Böhler’s angle measures 10 degrees. |
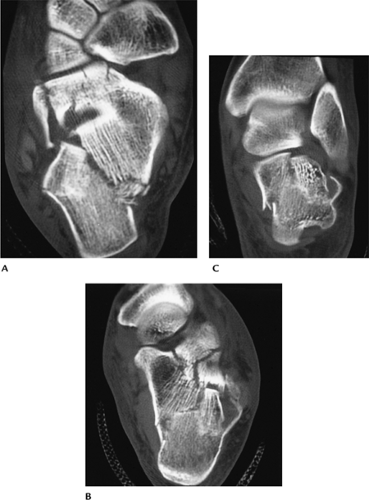 FIGURE 6-29 Comminuted intra-articular calcaneal fracture. Axial (A,B) and coronal (C) CT images clearly show fragment position and articular involvement. |
Suggested Reading
Crosby LA, Fitzgibbons I. Computerized tomographic scanning of acute intra-articular fractures of the calcaneus. J Bone Joint Surg 1990:72A:852–859.
Daftary A, Haims AH, Baumgartner MR. Fractures of the calcaneus: A review with emphasis on CT. Radiographics 2005;25:1215–1226.
Fractures/Dislocations: Calcaneal Fractures—Extra-articular
Key Facts
Extra-articular fractures account for 25% of calcaneal fractures. This includes all fractures that do not involve the posterior facet.
Mechanism of injury: twisting, compression, or avulsion forces.
Certain fractures may present as ankle sprains: anterior calcaneal process, peroneal tubercle, lateral calcaneal process, sustentaculum tali, calcaneal tuberosity, and medial calcaneal process fractures.
CT is frequently required to detect the injury and exclude intra-articular involvement.
Suggested Reading
Gilheany MF. Injury to the anterior process of the calcaneus. Foot 2002;12:142–149.
Fractures/Dislocations: Midfoot Injuries
Key Facts
The midfoot consists of the lesser tarsal bones (navicular, cuboid, three cuneiforms) and tarsometatarsal (Lisfranc) joints.
Injuries may be the result of medial (30%), longitudinal (41%), lateral (17%), or plantar (4%) forces, and crush injuries (5%).
Isolated tarsal fractures are uncommon.
Tarsometatarsal fracture/dislocations are Lisfranc injuries (1% of all fracture/dislocations). The mechanism of injury is forced plantar flexion of the forefoot. CT with reformatting is essential to define the extent of injury.
Suggested Reading
Karasick D. Fracture and dislocation of the foot. Semin Roentgenol 1994;29:152–175.
Makawana NK, Van Lefland MR. Injuries of the midfoot. Curr Orthop 2005;19:231–242.
Fractures/Dislocations: Forefoot Injuries—Fifth Metatarsal Fractures
Key Facts
Fractures of the fifth metatarsal base are common in children and adults.
Fractures are categorized as proximal or distal.
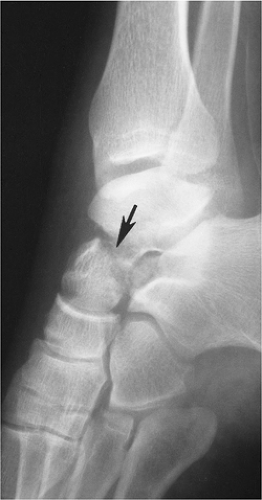
Proximal fractures are divided into three zones (Fig. 6-34). Zone 1, avulsion fractures; Zone 2, Jone’s fractures caused by forefoot adduction; Zone 3, typically athletic stress fractures.
Stay updated, free articles. Join our Telegram channel

Full access? Get Clinical Tree


