Metabolic Diseases
Thomas H. Berquist
Osteoporosis: Basic Concepts
Key Facts
Osteoporosis is a reduction in bone mass. It is the most common clinical bone disease.
Osteoporosis affects 75 million people in the United States, Europe, and Japan, accounting for 1.5 million fractures per year.
Osteoporosis is categorized as generalized, regional, or local. Table 14-1 summarizes the causes of osteoporosis.
Radiographic and imaging features vary with the type of osteoporosis and site.
TABLE 14-1 CAUSES OF OSTEOPOROSIS | ||||
|---|---|---|---|---|
|
Suggested Reading
Eastell R. Treatment of postmenopausal osteoporosis. N Engl J Med 1998;338:736–746.
Lanchik L, Sartoris DJ. Current concepts in osteoporosis. AJR Am J Roentgenol 1997;168:905–911.
Osteoporosis: Generalized
Key Facts
Generalized osteoporosis may be the result of a long list of disorders (Table 14-1).
Senile or postmenopausal osteoporosis usually develops in women aged more than 50 years. Fracture risk approaches 60% in females aged more than 50 years.
Endocrine disorders (Table 14-1) are the most common cause of secondary osteoporosis. The five most common endocrine disorders are hypogonadism, insulinopenia, hyperparathyroidism (HPT), hyperthyroidism, and hyper-cortisolemia.
Imaging of osteoporosis typically is accomplished with routine radiographs and bone mineral density measurements (dual-energy x-ray absorptiometry [DXA]). Computed tomography and ultrasound have also been used. However, management decisions and patient monitoring are most often accomplished with DXA.
Combining DXA data with clinical factors (age, prevalent fractures, family history of fractures, low body mass index, increased risk of falls, and steroids) allows estimation of fracture probabilities over 5- and 10-year periods.
Radiographic features: Spine and proximal extremities are primarily involved. Thin cortical bone, vertebral contour abnormalities (endplate compression, compression fractures). Coarsened trabecular pattern in the pelvis and trabecular resorption in the proximal femurs.
DXA: Lumbar spine, femoral neck, and wrists typically are studied. Bone density is compared with density in healthy 30-year-old persons (T-score) and the patient’s age group (Z score).
Normal: >-1
Osteopenia: <-1 to -2.5
Osteoporosis: <-2.5
Treatment may include ralozifene (mean increase in spine density 2.6% over 4 years), bisphosphonates (mean increase 10%–15% after 7–10 years), teriparatide (13% density increase after 18 months), or strontium ranelate (14.5% density increase after 3 years). Treatments may reduce fracture risk by 30% to 50%. DXA studies are used to monitor therapy at 1- to 2-year intervals.
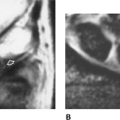
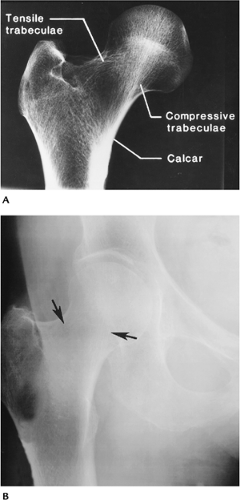 FIGURE 14-1 Osteoporosis. (A) Normal right hip with trabecular pattern well demonstrated. (B) Osteoporotic right hip with poorly defined trabeculae (arrows). |
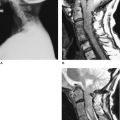
 FIGURE 14-2 (A) Lateral thoracic spine with osteoporosis and compression fractures. (B) Lateral lumbar space showing endplate compression (fish vertebra) with biconcave appearance. |
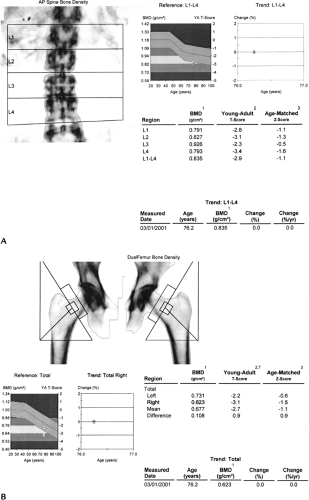 FIGURE 14-3 Bone mineral density with osteoporosis in a 76-year-old woman with lumbar (A) and hip (B) T scores of -2.9 and -3.1 for the lumbar spine and right hip, respectively. |
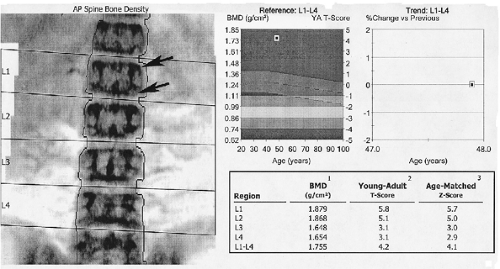 FIGURE 14-4 DXA study of the spine in a patient with chronic renal failure and renal osteodystrophy. The endplates are dense (arrows) and bone density increased with T-scores of up to 5.8 in L1. |
Suggested Reading
Briot K, Roux C. What is the role of DXA, QUS, and bone markers in fracture prediction, treatment allocation, and monitoring? Best Pract Res Clin Rheumatol 2005;19:951–964.
Ralston SH. Bone densitometry and bone biopsy. Best Pract Res Clin Rheumatol 2005;19:487–501.
Osteoporosis: Regional Osteoporosis
Key Facts
Osteoporosis may be more localized, affecting single or multiple osseous structures or periarticular regions.
Changes are most common in the extremities.
Several disease categories are included in regional osteoporosis.
Disuse osteoporosis: Disuse or immobilization osteoporosis is common after trauma with reduced use. Other painful conditions or paralysis also may result in disuse osteoporosis. Radiographic features include generalized osteopenia, subchondral osteopenia, or foci of cortical or medullary lucency.
Transient regional osteoporosis: Transient regional osteoporosis have in common focal involvement, rapid onset, and pain, and conditions are self-limited. One of the most common is transient osteoporosis of the hip (see Chapter 4). Radiographic features include rapid-onset osteopenia of the femoral head and neck without acetabular involvement.
Reflex sympathetic dystrophy (RSD): RSD usually follows trauma but also may follow myocardial infarction or hemiplegia. Patients with neoplasms (lung, ovary, breast, pancreas) also may present with RSD. Patients present with pain, swelling, and reduced motion.
Radiographic features include swelling and prominent juxta-articular osteopenia. Radionuclide scans show increased tracer in the involved osseous structures.
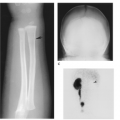
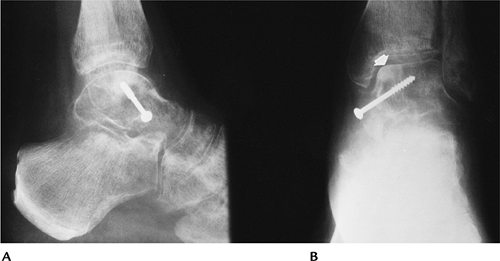 FIGURE 14-5 Disuse osteoporosis. Talar neck fracture with screw fixation. Lateral (A) and anteroposterior (AP) (B) radiographs showing osteopenia with sclerosis (arrow) medially caused by avascular necrosis. |
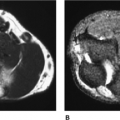
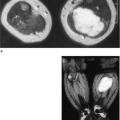
 FIGURE 14-6 Transient osteoporosis of the hip: (A) AP radiograph of the pelvis showing osteopenia in the left upper femur. Coronal T1-weighted (B) and T2-weighted (C) magnetic resonance images showing abnormal signal intensity in the femoral head and neck with a joint effusion. (D) Radionuclide bone scan in a different patient during early symptomatic phase showing increased tracer in the femoral head and neck. (E) Six months later, after symptoms have cleared, the bone scan is normal. |
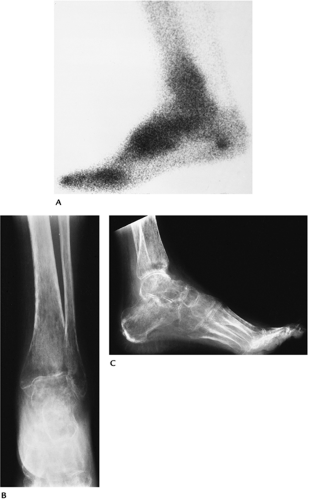 FIGURE 14-7 RSD. (A) Radionuclide bone scan showing increased tracer in the ankle, hind, and midfoot. AP (B) and lateral (C) radiographs showing advanced periarticular osteopenia. |
Suggested Reading
Genant HK, Kozir F, Beherman C, et al. The reflex sympathetic dystrophy syndrome. Radiology 1975;117:21–32.
Hayes CW, Conway WF, Daniel WW. MR imaging of bone marrow edema pattern: Transient osteoporosis, transient bone marrow edema, or osteonecrosis. Radiographics 1993;13:1001–1011.
Jones G. Radiographic appearances of disuse osteoporosis. Clin Radiol 1969;20:345–353.
Rickets and Osteomalacia: Basic Concepts
Key Facts
Rickets and osteomalacia are similar histologically. The basic defect is inadequate osteoid mineralization, although osteoid production also is reduced.
Rickets affects the immature skeleton, with changes most obvious in the growth plate.
Osteomalacia affects mature bone, although osteomalacia and rickets can coexist in childhood.
Table 14-2 summarizes the causes of these conditions.
Figure 14-8 summarizes vitamin D metabolism and associated diseases that lead to rickets and osteomalacia.
TABLE 14-2 RICKETS AND OSTEOMALACIA
Related posts:Stay updated, free articles. Join our Telegram channel
Full access? Get Clinical Tree
 Get Clinical Tree app for offline access

|
|---|