Musculoskeletal Neoplasms
Thomas H. Berquist
Mark J. Kransdorf
Bone Tumors/Tumorlike Conditions: Imaging Approaches
Key Facts
Imaging studies are essential for detecting, characterizing, and staging bone lesions.
Radiographs, computed tomography (CT), magnetic resonance imaging (MRI), and radionuclide scans all play a role. Angiography is useful for evaluating tumor vascularity and for preoperative embolization.
Effectiveness of imaging studies for evaluating features of bone tumors is as follows:
Radiographs
CT
MRI
Radionuclide Scans
Lesion morphology
Thin cortical bone
Lesion extent
Early detection in marrow and soft tissues
Site (cortical, marrow, diaphysis, metaphysis, epiphysis)
Bone destruction or production
Joint space involvement
Skip lesions
Bone production or destruction
Periosteal response
Marrow edema patterns
Metastasis
Periosteal response
Calcifications/matrix
Cortical destruction
Soft tissue calcification or ossifications
Trabecular destruction
Suggested Reading
Greenfield GB, Arrington JA. Imaging of bone tumors: A multimodality approach. Philadelphia: JB Lippincott; 1995.
Bone Tumors/Tumorlike Conditions: Radiographic Features
Key Facts
Routine radiographs provide vital and fundamental information regarding tumors and tumorlike conditions of bone. Key features are as follows:
Patterns of bone destruction:
Geographic: least aggressive. Margins may be sclerotic, well defined without sclerosis, or ill defined.
Moth-eaten: more aggressive, less well defined. Longer zone of transition. Seen with malignant lesions and osteomyelitis.
Permeative: most aggressive with more rapid destruction. Margins not defined. Seen with Ewing sarcoma, aggressive malignancies, and infections.
Bone formation
Matrix—calcification or ossification
Trabeculation—seen with giant cell tumors, chondromyxoid fibroma, aneurysmal bone cyst, hemangioma, nonossifying fibroma
Cortical penetration
Periosteal response
Soft tissue mass
Distribution:
Central, eccentric, cortical, juxtacortical
Diaphyseal, metaphyseal, epiphyseal
Skeletal location (e.g., tibia and calcaneus)
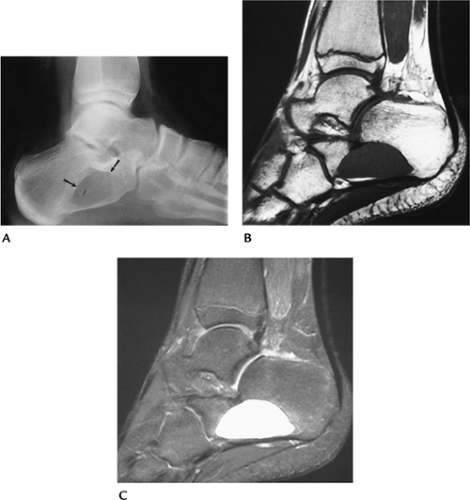 FIGURE 10-1 Patterns of bone destruction—geographic. (A) Lateral radiograph of the calcaneus showing a well-defined geographic lytic lesion (arrows). T1-weighted (B) and T2-weighted (C) magnetic resonance (MR) images showing homogeneous fluid signal caused by a benign unicameral bone cyst. |
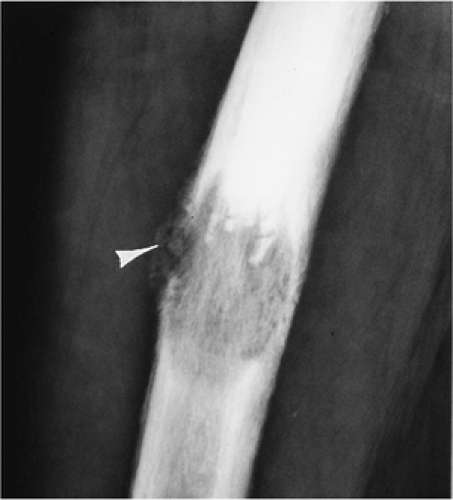 FIGURE 10-2 Moth-eaten. Lateral view of the femur showing a destructive lesion with poorly defined margins and a pathologic fracture anteriorly (arrowhead) as the result of metastasis. |
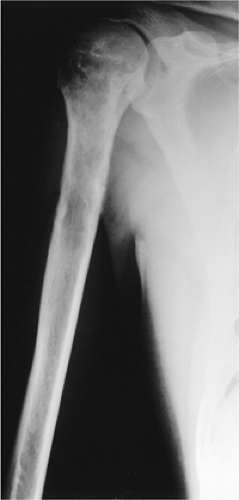 FIGURE 10-3 Permeative. Poorly defined lytic lesion in the proximal humerus with permeative cortical changes attributable to Ewing sarcoma. |
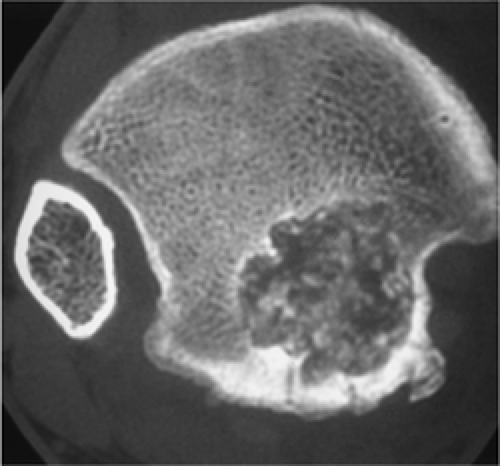 FIGURE 10-4 Matrix calcifications. Axial CT image of the distal tibial epiphysis showing a well-defined geographic lesion with calcifications. Appearance and location characteristic of chondroblastoma. |
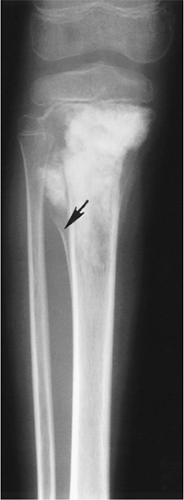 FIGURE 10-5 Periosteal response. Osteogenic sarcoma with bone sclerosis and cortical break: a triangular elevation (arrow) (Codman triangle) seen with aggressive lesions. |
Suggested Reading
Greenspan A, Remagen W. Differential diagnosis of tumors and tumorlike lesion of bone and joints. Philadelphia: Lippincott-Raven; 1998:1–24.
Bone Tumors/Tumorlike Conditions: Magnetic Resonance Imaging Protocols
Key Facts
MRI of bone tumors is approached somewhat differently compared with other indications.
The field of view needs to include a larger area to evaluate adjacent joints and to avoid overlooking skip lesions.
Image planes, especially for long bones, should be selected to demonstrate the osseous structure on one image.
Coil selected should be large enough to cover the needed anatomic area.
Pulse sequences typically include axial T1- and T2-weighted spin-echo MR images. We prefer conventional T2 images to turbo T2 or fat-suppressed turbo T2 images.
Contrast enhancement is used routinely.
 FIGURE 10-6 Patient with a knee sarcoma and midfemoral skip lesion. The knee coil would be optimal for knee imaging, but the skip lesion would not be identified unless the larger body coil was used to evaluate the entire femur. |
 FIGURE 10-7 Optimal image planes. (A,B) Sarcoma in the proximal femur with level of excision for limb salvage marked on coronal images. At least 5 to 7 cm of normal marrow usually is included in the resection. (C) Optimal sagittal image in a different patient showing the entire area of interest on one image. Line marks planned resection. |
Suggested Reading
Kransdorf MJ, Berquist TH. Musculoskeletal neoplasms. In: Berquist TH, ed. MRI of the musculoskeletal system, 5th ed. Philadelphia: Lippincott Williams & Wilkins; 2006:802–915.
Bone Tumors/Tumorlike Conditions: Osteoid Osteoma
Key Facts
Clinical:
Osteoid osteoma is a relatively common lesion accounting for 12% of benign bone tumors. Patients present with pain, worse at night, often relieved by anti-inflammatory medications (75%).
Age: 5 to 35 years, peak second decade
Sex: Males outnumber females 3:1.
Common locations: majority in lower extremity; proximal femur, femoral neck
Three types of osteoid osteoma:
Cortical: most common. Fusiform cortical thickening with a lucent nidus. May contain central calcification.
Cancellous: femoral neck and small bones of the hand, foot, and posterior elements of the spine.
Subperiosteal: least common. Arise in soft tissue adjacent to bone.
Imaging features:
Radiographic features: small round lucent area, usually in cortex with surrounding sclerosis. May have central calcification or ossification.
CT: technique of choice for detection and characterization.
MRI: small focal lesion with bone and soft tissue edema on T2-weighted or short T1 inversion recovery (STIR) images. Subtle lesions enhance with dynamic contrast studies.
Differential diagnosis:
Brodie abscess
Osteoblastoma
Stress fracture
Treatment: complete resection of nidus; percutaneous radiofrequency ablation.
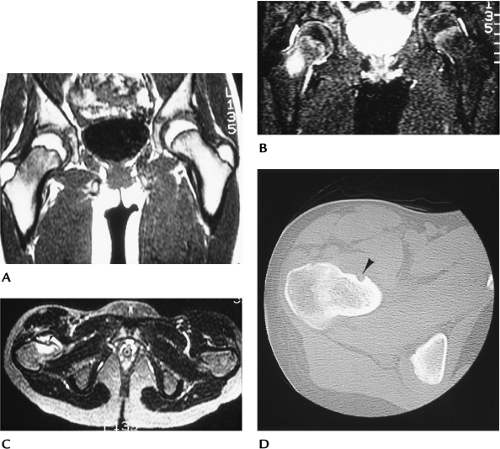 FIGURE 10-8 Intracapsular osteoid osteoma. Coronal T1-weighted (A) and fluid-sensitive (B) weighted images showing a large area of signal abnormality in the right femoral neck. (C) Axial T2-weighted image shows fluid in the joint with a small high signal intensity nidus (arrowhead) and surrounding edema. (D) Axial CT image demonstrates the lucent nidus (arrowhead) more clearly. |
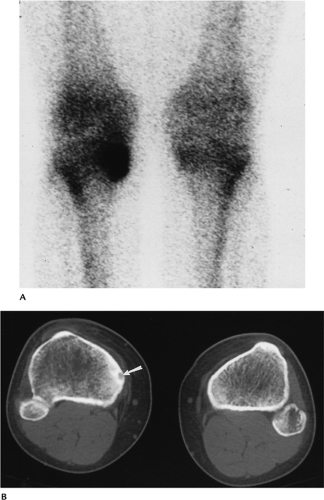 FIGURE 10-9 Tibial osteoid osteoma. (A) Posterior image from a bone scan showing increased tracer in the medial tibia. (B) CT scan clearly defines the nidus (arrow) and surrounding bone sclerosis. |
Suggested Reading
Assorin J, Richardi G, Railhec JJ, et al. Osteoid osteoma. MR imaging versus CT. Radiology 1994;191:217–233.
Greenspan A. Benign bone forming lesions: Osteoma, osteoid osteoma, osteoblastoma. Skel Radiol 1993;22:485–500.
Liu PT, Chivers FS, Roberts CC, et al. Imaging of osteoid osteoma by dynamic gadolinium-enhanced imaging. Radiology 2003;277:691–700.
Bone Tumors/Tumorlike Conditions: Osteoblastoma
Key Facts
Clinical:
Osteoblastomas account for 3.5% of benign bone tumors. Patients present with chronic local pain.
Age: any age, most common second decade
Sex: Males outnumber females 3:1.
Common locations: vertebrae (42.5%), posterior elements most commonly involved
Imaging features:
Radiographic features: May be similar to osteoid osteoma, but larger (>1.5 cm). May have malignant appearance. Bone expanded; 55% have an ossified matrix.
CT: cortical expansion, ossified matrix
MRI: variable, not well defined
Differential diagnosis:
Osteoid osteoma
Aneurysmal bone cyst
Osteosarcoma
Treatment: en bloc resection, bone grafting
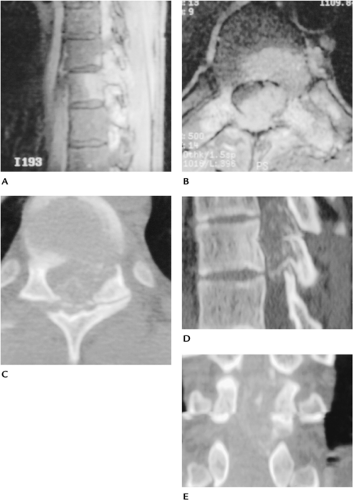 FIGURE 10-10 Osteoblastoma. Sagittal (A) and axial (B) contrast-enhanced T1-weighted images showing a large enhancing lesion that appears to involve the body and neural arch with spinal cord compression. Axial (C), sagittal (D), and coronal (E) CT images demonstrate matrix calcification or ossification with a thin cortical rim characteristic of osteoblastoma. |
Suggested Reading
McLeod RA, Dahlin DC, Beabout JW. The spectrum of osteoblastoma. AJR Am J Roentgenol 1976;126:321–335.
Unni KK. Dahlin’s bone tumors: General aspects and data on 11,087 cases. Philadelphia: Lippincott-Raven; 1996:131–142.
Bone Tumors/Tumorlike Conditions: Osteochondroma
Key Facts
Clinical:
Osteochondromas are the most common accounting for 35% of benign skeletal neoplasms. Patients present with a palpable mass that may be painful.
Age: 5 to 50 years, peak second decade
Sex: Males outnumber females 2:1.
Common locations: distal femur, proximal tibia, proximal humerus
Imaging features:
Radiographic features: bony projection with contiguous marrow and cortex from bone of origin
CT: similar to radiograph. Cartilaginous cap more easily appreciated (normal cap thickness <1.5–2 cm).
MRI: cartilage cap low intensity on T1-weighted and high intensity on T2-weighted sequences. Other features similar to radiographs.
Differential diagnosis:
Usually characteristic
Myositis ossificans
Treatment: Observe unless symptoms or cosmetic deformity, then resect.
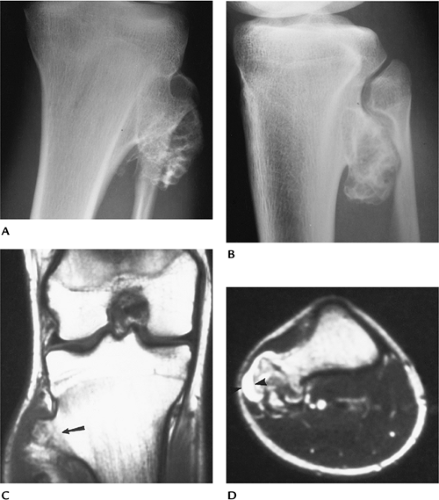 FIGURE 10-11 Anteroposterior (AP) (A) and lateral (B) radiographs of an osteochondroma. Coronal T1-weighted (C) and axial T2-weighted (D) images showing marrow extending into the lesion (arrow) and a thin high signal intensity cartilaginous cap (arrowheads). |
 FIGURE 10-12 Axial CT of an osteochondroma arising from the upper tibia. |
Suggested Reading
Unni KK. Dahlin’s bone tumors: General aspects and data on 11,087 cases, 5th ed. Philadelphia: Lippincott-Raven; 1996:11–24, 121–130, 355–432.
Bone Tumors/Tumorlike Conditions: Enchondroma
Key Facts
Clinical:
Enchondromas account for 13.4% of benign bone tumors. Most are asymptomatic. If painful, low-grade chondrosarcoma should be excluded. Chondrosarcomas have more intense uptake on radionuclide scans and typically erode two thirds of the cortical thickness. There may also be periosteal reaction and a soft tissue mass.
Age: all age groups, 55% in the second through fourth decades
Sex: no sex predilection
Common locations: small bones of hand and feet (50%) with 87% in the hand, proximal femur, and humerus
Imaging features:
Radiographic features: medullary with sharp margins. Calcification common. May be multiple.
CT: well-defined lesion with central calcified matrix. Cortical erosion easily measured.
MRI: lobulated low intensity on T1-weighted and high intensity on T2-weighted images. Useful for differentiating enchondroma from chondrosarcoma. Mineralized areas show decreased signal intensity on all pulse sequences.
Differential diagnosis:
Bone infarct
Chondrosarcoma
Treatment: Observe. Curettage and bone graft if symptomatic.
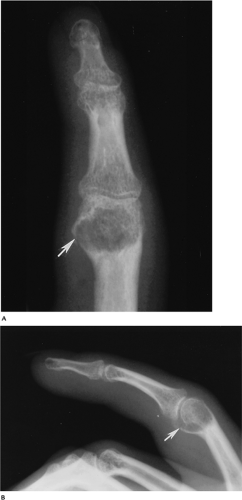 FIGURE 10-13 AP (A) and lateral (B) radiographs of a phalangeal enchondroma. There is cortical expansion and a pathologic fracture (arrow). |
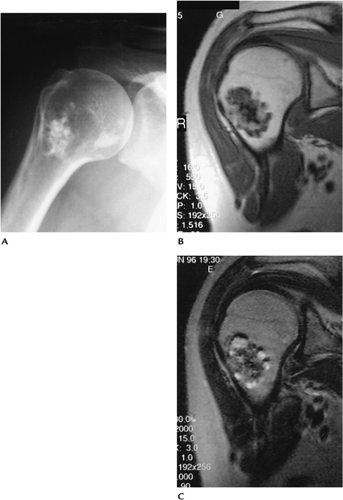 FIGURE 10-14 Enchondroma in a 52-year-old woman. (A) Routine radiograph of the shoulder showing a focus of calcifications in the marrow of the humeral neck with no endosteal scalloping. Coronal T1-weighted (B) and T2-weighted (C) MR images showing areas of low and high intensity in the enchondroma as the result of calcifications. There is no marrow edema, cortical destruction, or soft tissue mass. |
Suggested Reading
Murphy MD, Flemming DJ, Boyea SR, et al. Enchondroma vs. chondrosarcoma in the appendicular skeleton: Differentiating features. Radiographics 1998;18:1213–1237.
Bone Tumors/Tumorlike Conditions: Chondroblastoma
Key Facts
Clinical:
Patients present with chronic local pain.
Age: 90% occur from 5 to 25 years of age, approximately 70% in second decade.
Sex: Males outnumber females 2–3:1.
Common locations: epiphyseal with 40% in the knee and 16% in the proximal humerus
Imaging features:
Radiographic features: epiphyseal location. Sharp margins with sclerotic rim. Calcification in approximately 50% to 60%.
CT: well-defined lesion with sclerotic margins and, frequently, central calcification
MRI: well-defined low-intensity lesion on T1-weighted and variably high signal intensity on T2-weighted sequences, with extensive surrounding edema in the majority of cases
Differential diagnosis:
Giant cell tumor
Avascular necrosis
Clear cell chondrosarcoma
Treatment: curettage and bone grafting
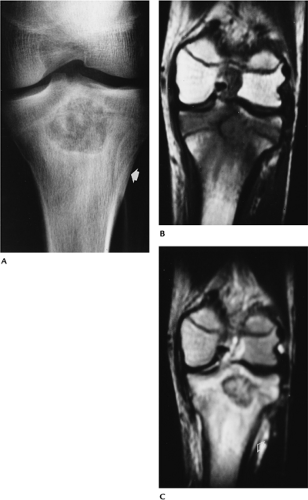 FIGURE 10-15 Chondroblastoma. (A) AP radiograph demonstrates a proximal tibial lesion with sclerotic margins and calcifications. There is subtle periosteal reaction (arrow). Coronal T1- (B) and T2-weighted (C) images demonstrate a well-defined lesion with marrow edema pattern. |
Suggested Reading
Unni KK. Dahlin’s bone tumors: General aspects and data on 11,087 cases. Philadelphia: Lippincott-Raven; 1996:47–57.
Weatherall PT, Moole GE, Mendelsohn DB, et al. Chondroblastoma: Classic and confusing appearance at MR. Radiology 1994;190:467–474.
Bone Tumors/Tumorlike Conditions: Chondromyxoid Fibroma
Key Facts
Clinical:
Patients present with local pain and swelling.
Age: 5 to 50 years, most common (55%) in the second and third decades
Sex: slightly more common in males
Common locations: metaphysis of the knee and distal tibia
Imaging features:
Radiographic features: eccentric metaphyseal lesion with well-defined sclerotic margins. Calcifications seen in 12%, more common in those aged more than 40 years.
CT: eccentric metaphyseal lesion with well-defined sclerotic margins. Calcifications easily appreciated
MRI: well-defined lesion with uniform low intensity on T1-weighted and high or intermediate intensity on T2-weighted sequences
Differential diagnosis:
Fibrous defect
Fibrous dysplasia
Chondroblastoma
Aneurysmal bone cyst
Treatment: curettage and bone grafting
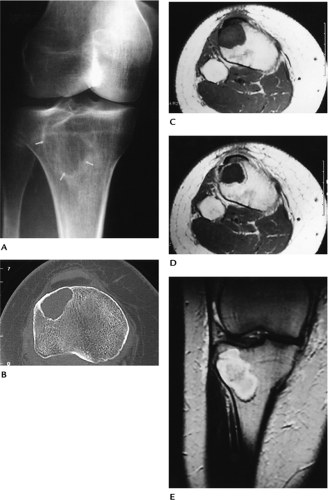 FIGURE 10-16 Chondromyxoid fibroma in a 45-year-old woman. (A) Oblique radiograph of the knee showing a lytic lesion with sclerotic margins (arrows). (B) Axial CT showing the well-defined sclerotic margins with no matrix calcifications. Axial T1-weighted (C), axial enhanced T1-weighted (D), and T2-weighted coronal (E) images showing the lesion to be low signal intensity on T1 (D) with peripheral enhancement. |
Suggested Reading
Rahimi A, Beabout JW, Ivens JC, et al. Chondromyxoid fibroma: A clinicopathological study of 76 cases. Cancer 1972;30:726–736.
Yamaguchi T, Dorfman HD. Radiographic and histologic patterns of calcification in chondromyxoid fibroma. Skel Radiol 1998;27:559–564.
Bone Tumors/Tumorlike Conditions: Nonossifying Fibroma
Key Facts
Clinical:
Nonossifying fibroma, fibrous cortical defect, and fibroxanthoma describe similar metaphyseal lesions. Lesions are common and typically discovered incidentally.
Age: 5 to 35 years, peak second decade
Sex: No sex predilection.
Common locations: distal femur, distal tibia
Imaging features:
Radiographic features: well-defined eccentric lytic defect with scalloped sclerotic margins in the metaphysis of a long bone
CT: well-defined eccentric lytic defect with scalloped sclerotic margins in the metaphysis of a long bone
MRI: well-defined cortical lesion with low to intermediate intensity on T1-weighted and low to intermediate signal intensity on T2-weighted sequences
Differential diagnosis:
Fibrous dysplasia
Chondromyxoid fibroma
Eosinophilic granuloma
Treatment: none unless potential for pathologic fracture
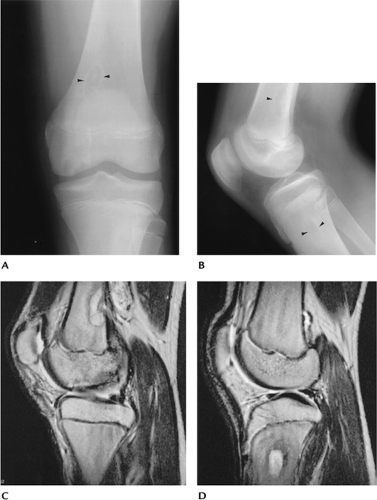 FIGURE 10-17 Nonossifying fibromas in the tibia and femur of a 15-year-old boy. AP (A) and lateral (B) radiographs showing lucent lesions in the tibia and femur (arrowheads) with well-defined sclerotic margins. There also is osteochondritis dissecans in the medial femoral condyle. (C,D) Sagittal T2-weighted MR images showing high signal intensity with low intensity at the margin of the lesions. |
Suggested Reading
Jee W, Choe B, Kang H, et al. Nonossifying fibroma. Characteristics at MR imaging with pathologic correlation. Radiology 1998;209:197–202.
Bone Tumors/Tumorlike Conditions: Bone Cyst
Key Facts
Clinical:
Patients are asymptomatic unless pathologic fracture occurs.
Age: first two decades
Sex: Males outnumber females 3:1.
Common locations: proximal humerus, femur, or tibia (90% in humerus or femur)
Imaging features:
Radiographic features: well-defined lytic lesion frequently near the physis. May be septated. If fracture has occurred, the “fallen fragment sign” (bone fragment in the dependent portion of the cyst) is virtually pathognomonic.
CT: fluid density, well-defined lesion with bony septations
MRI: uniformly low intensity on T1-weighted and high intensity on T2-weighted sequences. Fluid–fluid level or “fallen fragment” after fracture.
Differential diagnosis:
Aneurysmal bone cyst
Fibrous dysplasia
Treatment: aspiration and steroid injection. If in a weight-bearing region, consider curettage and bone grafting.
 FIGURE 10-18 Unicameral bone cyst. AP radiograph of the humerus with a bone cyst and pathologic fracture with the “fallen fragment sign” (arrows). |
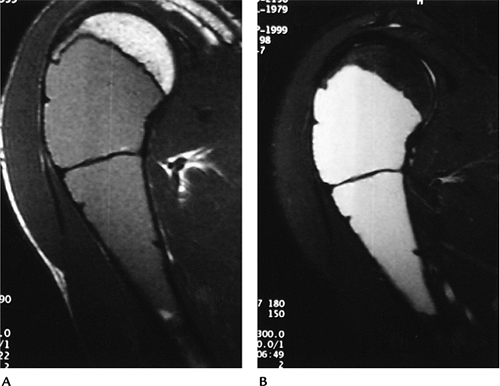 FIGURE 10-19 Unicameral bone cyst. Sagittal T1-weighted (A) and STIR (5300/30/150) (B) images showing low intensity on T1-weighted (A) and high intensity on STIR (B) consistent with a fluid-filled cyst. |
Suggested Reading
Conway WF, Hayes CW. Miscellaneous lesions of the bone. Radiol Clin North Am 1993;31:299–323.
Kileen K. The fallen fragment sign. Radiology 1998;207:261–262.
Bone Tumors/Tumorlike Conditions: Aneurysmal Bone Cyst
Key Facts
Clinical:
Patients present with pain.
Age: 5 to 35 years, 80% in the first two decades
Sex: Females slightly outnumber males.
Common locations: more than 50% in the long bones; 12% to 30% in the spine
Imaging features:
Radiographic features: eccentric lytic lesion with expanded or “ballooned” bony contour. Sclerotic rim and periosteal response are common.
CT: same features as radiographs but fluid density
MRI: well-defined lesion with high signal intensity on T2-weighted sequences. Fluid–fluid levels are common.
Differential diagnosis:
Bone cyst
Giant cell tumor
Osteoblastoma (vertebral location)
Treatment: curettage and bone grafting
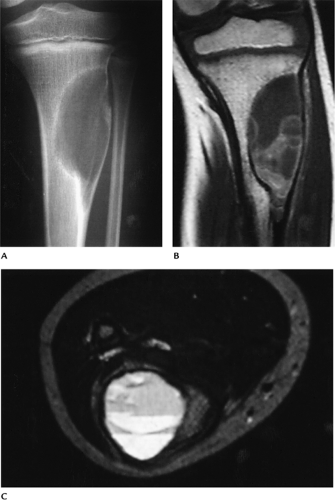 FIGURE 10-20 Aneurysmal bone cyst. (A) AP radiograph showing a lytic expanding lesion in the upper tibia. Coronal T1-weighted (B) and axial T2-weighted (C) MR images showing a cystic lesion with fluid–fluid levels. |
Suggested Reading
Munk PL, Helms CA, Holt RG, et al. MR imaging of aneurysmal bone cysts. AJR Am J Roentgenol 1989;153:99–101.
Bone Tumors/Tumorlike Conditions: Fibrous Dysplasia
Key Facts
Clinical:
Typically asymptomatic. Abnormal bone growth may cause deformity. Lesions may be single (monostotic) in which case the femur, tibia, ribs, and skull base are most commonly involved. Multiple lesions (polyostotic) involve one side of the skeleton in 90% of patients. These lesions are more often symptomatic and may enlarge until skeletal maturity.
Associated syndromes:
Mazabraud syndrome: fibrous dysplasia and multiple intramuscular myxomas
Albright-McCune: females with polyostotic dysplasia, skin lesions, and precocious puberty
Age: most often second or third decade
Sex: slightly more common in females
Common locations: skull, mandible, ribs, femoral neck, tibia
Imaging features:
Radiographic features: metaphyseal or diaphyseal lytic or “ground glass” density with sharp margins and bone expansion. May affect multiple bones in approximately 15% of patients. “Long lesion in long bone.”
CT: well-defined lesion with sclerotic margins
MRI: well-defined lesion with low-intensity margins. Low signal intensity on T1-weighted and intermediate signal intensity on T2-weighted sequences.
Differential diagnosis:
Nonossifying fibroma
Bone cyst
Aneurysmal bone cyst
Chondromyxoid fibroma
Treatment: observation
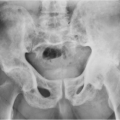
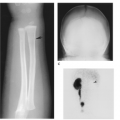
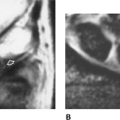
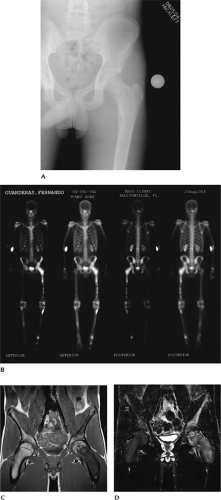 FIGURE 10-21 Thirteen year old male with polyostotic fibrous dysplasia. (A) AP radograph of the pelvis demonstrates lucent lesions in the ilium and femur. (B) Radionuclide bone scan shows multiple lesions on the left involving the pelvis, femur, and tibia. Coronal T1- (C) and T2-weighted (D) images demonstrate abnormal signal intensity in the involved bones with expansion of the femoral neck. |
Suggested Reading
Campanacci M, Laus M. Osteofibrous dysplasia of the tibia and fibula. J Bone Joint Surg 1981;63A:367–375.
Gober GA, Nicholas RW. Case report 800. Skeletal fibrous dysplasia associated with intramuscular myxomas (Mazabraud’s syndrome). Skel Radiol 1993;22:452–455.
Greenspan A, Remagen W. Differential diagnosis of tumors and tumorlike lesions in bone and joints. Philadelphia: Lippincott-Raven; 1998:215–223.
Bone Tumors/Tumorlike Conditions: Giant Cell Tumor
Key Facts
Clinical:
Giant cell tumors account for 22.7% of benign bone tumors. Patients present with pain and swelling in the involved site. A tender palpable mass commonly present.
Age: 20 to 40 years
Sex: Females affected slightly more frequently than males.
Common locations: most involve the distal femur or proximal tibia (46%) followed by the distal radius and sacrum. Epiphyseal location.
Imaging features:
Radiographic features: lytic lesion with nonsclerotic margins originating in the metaphysis but extending to subchondral bone. Cortical breakthrough in 33% to 50% of cases.
CT: similar to radiographs. No tumor matrix.
MRI: low intensity on T1-weighted and intermediate signal on T2-weighted sequences. T2 sequences may show decreased signal because of hemosiderin deposition. In some cases, signal intensity increased on T2-weighted images. May have fluid–fluid levels. Enhanced on post-contrast images.
Differential diagnosis:
Chondroblastoma
Osteosarcoma
Fibrosarcoma
Malignant fibrous histiocytoma
Treatment: resection with grafting or, in some cases, joint prosthesis
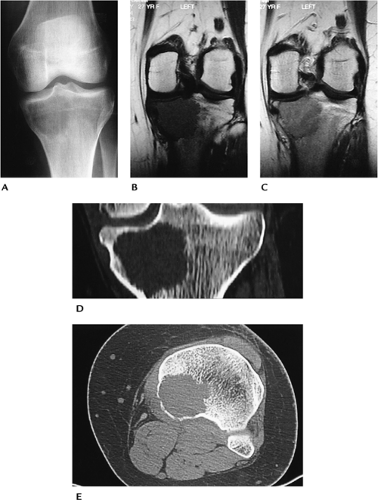 FIGURE 10-22 Giant cell tumor. (A) AP radiograph demonstrates a poorly defined lesion involving the epiphysis and metaphysis. Coronal T1- (B) and postcontrast T1-weighted (C) images show low signal intensity on the T1-weighted image (B) and contrast enhancement (C). Coronal (D) and axial (E) CT images showing low attenuation with no calcified matrix. |
Suggested Reading
Aoki J, Tanikawa H, Ishü K, et al. MR findings indicative of hemosiderin in giant-cell tumor of bone: Frequency, cause, and diagnostic significance. AJR Am J Roentgenol 1996;166:145–148.
Bone Tumors/Tumorlike Conditions: Eosinophilic Granuloma
Related posts:


Stay updated, free articles. Join our Telegram channel

Full access? Get Clinical Tree


