Fig. 1
ICRU target volumes
The second important tool for the planning of percutaneous irradiations are DVHs. Here, the dose given to a certain structure like a target volume or a normal organ is plotted against the cumulative volume of the organ receiving at least this dose (Fig. 2). A multitude of DVH parameters are used for treatment plan evaluation and optimisation, as they are extremely helpful in estimating the probability of tumor control and the probability for normal toxicity complications. So can e.g., the radiotherapy plan for a thoracic tumor be accepted, of the V20 (i.e., the volume of both lungs that receives a dose of more than 20 Gy) is below 30 %, or if the maximum dose to the spinal cord is less than 48 Gy. Derived from DVH calculations, parameters like the tumor control probability (TCP) or the normal tissue complication probability (NTCP) can be estimated, which are however not undisputed.
Fig. 2
Typical dose volume histogram of a RT-plan for radiotherapy of advanced lung cancer. Pink: DVH for PTV, arrow: 95 % of target volume receives >95 % of prescribed dose of 70 Gy. Dark purple: DVH for both lungs, arrow: V20 < <30 %. Green: spinal cord, arrow: maximum dose =48 Gy
For the 3D-delineation of tumors and normal tissues, computed tomography (CT) and magnetic resonance imaging (MRI) have been used for many years. These methods of anatomical imaging have the significant advantage to show the anatomy with a high resolution. Based on these methods, in the last three decades highly sophisticated RT techniques like the 3-dimensional, conformal RT, stereotactic RT and radiosurgery, intensity modulated radiation therapy (IMRT), heavy particles RT, etc. were developed. The main goal of all these techniques is to focus and escalate the irradiation dose on the tumor area with high precision and to spare the normal tissue. Higher percutaneous irradiation dose is generally correlated with higher rate of local tumor control, whereas lower irradiation dose in the normal tissue leads to lower risk of sides effects.
Concerning target volume delineation for RT, anatomical imaging has some significant limitations: tumour visualization is based on variation of tissue density (CT) or magnetic properties (MRI), on macro-anatomic changes and on contrast enhancement, which are not necessarily specific tumour characteristics. Similar changes may also be seen in non-tumour tissue due to pathological conditions, such as inflammation, or after therapy (surgery, radiotherapy or chemotherapy), while biological changes not (yet) influencing the morphology may not be depicted by anatomical imaging. Therefore, anatomical imaging has limits in the presentation of tumour extension, when tumor bearing structures have a yet unchanged anatomy, when tumour and normal tissue have similar density, similar magnetic properties or a similar contrast enhancement. Moreover, anatomical imaging gives no information about important biological characteristics of the tumor like hypoxia and proliferation.
Therefore, the methods of biological imaging (Ling et al. 2000) like PET are of interest. In radiotherapy planning, PET may help in the overall depiction of tumor localisation for GTV definition. Furthermore, biological imaging may enable the radiation oncologist to define biologically interesting subvolumes of the tumor like a target within the GTV, which could be irradiated with a higher dose, e.g., by IMRT. This concept is called “dose painting”, and is yet a promising hypothesis waiting to be validated (Bentzen 2005; Bradley et al. 2004; Ling et al. 2000, 2004; Tanderup et al. 2006) by clinical data. However, as basis for clinical trials, its technical realisation is presently explored with high commitment by several groups. Here the possibility of giving homogenous doses within certain predefined subvolumes (i.e., “dose painting by contours”) are tested as well as the prescription of a certain dose to a certain imaging feature, e.g., the amount of uptake of a radionuclide in this voxel (i.e., “dose painting by numbers”) (Thorwarth et al. 2010).
3 PET for Gross Tumor Volume Delineation
Where is the tumor? This is the core question for the planning of percutaneous radiation and may be of growing interest in times of voxel-based dosimetry of nuclear medicine treatment and in the context of the possible combination of percutaneous and systemic RT. In the process of radiation treatment planning, the gross tumor mass, traditionally delineated on CT and MRI, can be represented three-dimensionally, the ICRU GTV while the CTV encompasses the GTV plus the supposed microscopic tumour infiltration (Fig. 1). GTV and CTV are fundamental concepts in the determination of the irradiation fields’ extension and the irradiation dose. Basic principles of radiation biology show that there is a direct relationship between the number of tumor cells and the total irradiation dose necessary to kill all of them. Therefore, the higher dose will be focussed on the GTV.
The rationale for integrating a biological imaging method in the GTV delineation is its higher sensitivity and specificity for tumor tissue in comparison to CT and MRI alone. The tracers evaluated best in this context are [18F]-labelled flouro-desoxyglucose (FDG) for many extracranial malignancies (Gambhir et al. 2001) and amino-acids like [11C]-labeled methionine (MET) for gliomas. Although these tracers do also have a potential of imaging regional differences in metabolic intensity within tumors (Dierckx and Van de Wiele 2008), they have until now mainly been used for the imaging of overall vital tumor tissue i.e., for GTV-definition.
4 Technical Challenges
4.1 Image Registration
Crucial points in the use of FDG-PET for radiotherapy planning are patient positioning and image coregistration. As the quality of image fusion has been shown to be significantly better when CT and PET have been acquired in identical position, it is mandatory, that a FDG-PET acquisition for RT treatment planning must be done in RT treatment patient position (Coffey and Vaandering 2010). Here, photo documentation and laser systems are of great help. Irrespective of the kind of scanner used (PET or PET/CT), the correct coregistration of PET data with the CT dataset used for RT-planning must be verified. It must be kept in mind that patient position may change, not only between acquisitions on stand-alone PET and CT-scanners, but also during PET/CT acquisitions. Not correcting for the consequent differences in tumor localisation leads to a geographical miss, if PET-derived GTVs are transmitted to CT datasets without critical evaluation of the quality of coregistration. This is best done by comparing anatomical landmarks detectable by both imaging techniques like carina tracheae, lung apices, spine, sternum, thoracic wall and—with care due to breathing mobility—diaphragm (Grgic et al. 2008).
Non-rigid coregistration algorithms may solve a part of the positioning problems. However, although these methods have been proposed for the use in radiotherapy (Ireland et al. 2007) the resulting image datasets have not been evaluated concerning the correct position of pathologic tissues, especially tumors until now. It may well be, that the deformation of image data caused by non rigid algorithms may result in geometrical inexactnesses or geographical misses, predominantly in cases, where the tumours are not unequivocally depicted by the morphological method (Grgic et al. 2009). Unfortunately, the integration of FDG-PET into RT planning is especially needed for those cases. Therefore, to date the use of rigid coregistration algorithms after careful patient positioning in all modalities is the method of choice.
4.2 Target Volume Delineation
Determination of a volume from FDG-PET is a critical step. Various basic approaches were reported in the literature to accurately contour FDG-based GTVs (Erdi et al. 1997; Knight et al. 1996; Pötzsch et al. 2006). Easily applicable from a technical point of view is the visual contouring by the experienced physician, in analogy to the method used for CT-based contouring. However, a significant inter-observer variation (IOV) remains (Pötzsch et al. 2006). To improve this IOV, clinical protocols have been proposed (MacManus et al. 2007; Macmanus and Hicks 2008) and succeeded in a significant convergence of FDG-based GTVs contoured by different observers.
However, visual contouring remains observer dependent and by further distribution of the method into clinical practice, the varying experience of the radiation oncologist with PET will influence the quality of visual GTV-contouring. Therefore other methods for automatic and/or semi-automatic threshold contouring of the—often high contrast—FDG-accumulations have been evaluated.
Herefore, other than absolute or relative SUVs, contrast oriented algorithms appear quite robust under clinical conditions. However, the calibration to the PET and RT-planning system used is mandatory (Schaefer et al. 2008). As technical factors like the methods of reconstruction, attenuation correction of PET images and the change of data formats in transfer processes between different software systems do influence PET image data (Jaskowiak et al. 2005; Schoder et al. 2004; Tarantola et al. 2003), these methods and processes have to be defined before and kept constant after calibration.
Recently, gradient-based and statistical contouring methods have been proposed by some authors (Geets et al. 2007; Graves et al. 2007; Zaidi and El Naqa 2010). These approaches also appear promising, as they may not be susceptible to fluctuating maximum values within tumors and to varying background intensities. However, some of these methods require a high grade of user interaction and computing power and the robustness against intra-tumor inhomogeneities in clinical use, the usefulness for the contouring of low-contrast lesions and the comparison with other methods and gold standards has to be awaited.
Beyond all that, the preferable method for target volume delineation may depend from the tracer used due to widely differing contrast. Example shows the pathologic accumulations of brain tumors in amino acid PET less than twice the tracer uptake seen in normal brain tissue (Kracht et al. 2004), while with FDG, the tracer uptake of tumors may be 10–50-fold higher as compared to normal tissue. In low contrast situations, GTV contouring is often performed visually in cooperation of the radiation oncologist with the experienced nuclear medicine physician. For AA-Pet in glioma, some groups have published threshold values to be used for semi-automatic contouring before visual correction. Proposed values for this purpose are the 1.7-fold uptake compared to normal tissue (Grosu et al. 2005a, b), or the 2.0-fold uptake for intensely accumulating and 1.3-fold for moderately accumulating lesions compared to contralateral normal brain (Miwa et al. 2008). Other groups use thresholds related to the maximum uptake of the lesion, e.g., 75 % (Plotkin et al. 2006) for delineating glioma tissue in MET-PET.
Overall, it must be kept in mind, that the choice of the method for GTV contouring may have significant impact on the size of the GTV (Nestle et al. 2005) and that the most important factor in PET-based GTV delineation is the close collaboration of nuclear medicine and radiotherapy departments on the side of the medical as well as on the side of the physical and technical staff.
4.3 Movements
In percutaneous RT, due to the fixed gantry of the linear accelerators, the movement of an organ relative to the planning position is a parameter of interest (Langen and Jones 2001). In principle, three different categories of motion are of relevance. Organ motion related to patient position changes, motion that occurs in between fractions, and motion which occurs during fractions. Breathing movements of thoracic and abdominal tumors pose a serious problem both for imaging and for radiotherapy treatment application. The problems associated with motion include limitations of image acquisition, of treatment planning and of relevant dose delivery (Keall et al. 2006).
Usually the situation in diagnostic CT is the following: CT is performed in breath-hold condition and may then provide an image of the tumour representative of its instantaneous position and not of its different locations during the whole breathing cycle. Therefore, radiotherapy planning CTs are acquired in flat breathing in order to represent the situation on the treatment couch better. During the process of treatment planning, safety margins are added to the tumor volume determined in CT in order to adjust for respiratory motion. The ICRU recommends the CTV to be expanded to the “ITV” with an internal margin (IM) taking into account for tissue deformations and physiologic movements due to respiration, cardiac motion and peristalsis (ICRU 1993, 1999). For the definition of the IM different methodologies can be used: the application of population-based margins (Langen and Jones 2001); fluoroscopy (Ekberg et al. 1998; Shirato et al. 2004); multiple CT acquisitions (Ross et al. 1990); slow-CT scan (de Koste et al. 2003) or 4D-imaging (Nehmeh et al. 2004).
In contrast to routine CT, a routine PET scan is performed over a multitude of breathing cycles in free breathing condition. Therefore the PET study provides an image of the lesion representing the integral over the whole volume within which the lesion moves during patient respiration. The resulting image ideally shows an increase in lesion size representing the localisation of the tumor during the whole breathing cycle. Therefore, it has been proposed to use ungated PET data to define the ITV for lung tumors (Caldwell et al. 2003).
Beyond the accurate measurement of motion and consecutive definition of the ITV (Bettinardi et al. 2010), various approaches have been undertaken in order to minimize the ITV by influencing either the patients respiration or adapting the treatment application to the respiration cycle (Senan et al. 2004)
However, outcome data have to be awaited demonstrating a clearly reduced normal tissue toxicity or increased tumor control after gated radiotherapy application in order to justify the enourmous technical effort needed.
5 Clinical Applications
As recently summarized in a couple of reviews in more detail, the use of PET and PET/CT for radiotherapy treatment planning has been explored in several tumor entities. The use of FDG-PET in lung and head and neck cancer as well as the use of aminoacid PET in glioma will be outlined in detail below. However, there are several other interesting fields in this context like the use of FDG-PET for gynaecological cancers (Haie-Meder et al. 2010), where especially the detection of lymphatic spread might change CTV concepts, FDG in esophageal cancer, where the length of the GTV as well as the topographically better depiction of affected lymph nodes are of use (Lambrecht and Haustermans 2010). In prostate cancer, Choline PET/CT may prove to be useful for the planning of radiotherapy in postoperatively recurrent cases (Picchio et al. 2010).
5.1 Lung Cancer
In recent years, numerous clinical studies and metanalyses have shown the superiority of FDG-PET over traditional imaging methods in lung cancer staging and its clinical consequences (Dwamena et al. 1999; Eschmann et al. 2007; Hellwig et al. 2007; MacManus et al. 2001; van Tinteren et al. 2002). The promising diagnostic performance of FDG-PET in non-small cell lung cancer (NSCLC) has led to the idea of integrating these data into RT-planning more than ten years ago (Table 1) (Munley et al. 1999; Nestle et al. 1999). The main motivation for these activities is the clearly superior diagnostic accuracy of FDG-PET compared to CT in the staging of NSCLC, which has meanwhile been accepted by the scientific community and has led to the standard use of FDG-PET with this indication in clinical routine.
Table 1
Pioneer planning studies with >30 cases on influence of PET in RT-treatment planning in lung cancer
Author | Pat. # | Method of PET/CT image fusion | Method of GTV contouring (PET) | Change of planning parameters using PET |
|---|---|---|---|---|
Munley et al. (1999) | 35 | CT/PET co-registered manually using transmission PET | Visual evaluation | Change of PTV:12/35 (34 %) |
Nestle et al. (1999) | 34 | PET-portal compared to CT-portal | Visual evaluation | change of field size 35 % |
Vanuytsel et al. (2000) | 73 (N+) | CT-Naruke map compared with CT-PET-Naruke map and pathology | Visual evaluation | Change of GTV: 45/73P(62 %) |
MacManus et al. (2001) | 153 | PET results used for treatment planning, no image fusion | Visual evaluation | Change of GTV: 22/102 P(21 %) |
Kalff et al. (2001) | 34 | PET results used for treatment planning, no image fusion | Visual evaluation | altered treatment delvery 22/34 (65 %) |
Mah et al. (2002) | 30 | image coregistration CT-PET using external fiducial markers | 50 % intensity level of max. FDG uptake | Change of GTV GTV: 5/23 P (22 %) |
Deniaud-Alexandre et al. (2005) | 101 | image fusion using fiducial markers | 50 % intensity level of max. FDG uptake | Change of GTV PTV: 43/101 (43 %) |
However, the diagnostic accuracy of FDG-PET is not 100 %, but only between 85–90 %. This fact must be considered in clinical concepts dealing with the integration of PET-based target volumes in revised treatment algorithms, e.g., when discussing the need for the prophylactic irradiation of macroscopically unaffected lymph node regions.
To date (Nestle et al. 2002, 2006, 2009), over 20 studies in more than 600 patients have shown that the use of FDG-PET image data in radiotherapy planning may lead to an advantage for the patient. The main sources of this possible advantage are the better coverage of the primary tumor and the protection of healthy tissue. The FDG-based target volumes may be both smaller and larger compared to only CT-based ones. However, based on the surgical data regarding the specificity of FDG-PET for tumor staging it can be assumed, that FDG-based target volumes do include the tumor tissue more accurately than merely CT-based volumes. The high percentage of changes in target volumes due to FDG-PET reported in the literature (20–100 %) concerning various parameters of the planning process (field sizes, GTV, CTV, PTV, NTCP etc.) is mainly caused by two factors: the ability to distinguish the tumor from collapsed lung tissue (atelectasis, Fig. 3), and the higher accuracy of FDG-PET in lymph node staging compared to CT.
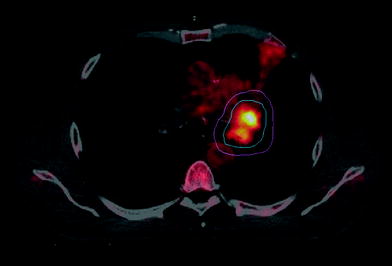
Fig. 3
PET-based RT planning for lung cancer patient with atelectasis. Blue: PET derived GTV. Pink: PTV
The highest possible benefit for the patients from FDG-based RT planning can only be gained, if, due to the exact depiction of tumor localisation by PET, the irradiation of large parts of normal tissues can be omitted. In lung cancer, this supports the concept of selective rather than elective irradiation of mediastinal lymph nodes when defining the CTV (Kiricuta 2001). This could lead to a significant protection of highly radiosensitive normal tissues, e.g., lung, with the consequence of obtaining higher irradiation doses in the tumor. First clinical data with (De Ruysscher et al. 2005) and even without FDG-PET (Rosenzweig et al. 2007), have shown that the risk of “out field”-recurrences after targeting the macroscopic tumor alone is small, much smaller than the risk for local (“in field”) tumor progression.
Regarding the literature data on cases with information on PET-, CT-findings and histology available, one may calculate the residual risk when following one or the other strategy. In a patient cohort published by Vanuytsel et al. (2000) 988 lymph node stations were evaluated by PET, CT and histology (Fig. 4). It can be calculated, that a targeting strategy in this patient group including CT-positive lymph node stations into the treatment fields only would lead to the inclusion of 96 lymph node stations while half of the stations (47 affected stations) would not be treated properly. Using the PET signal for targeting, 84 stations would be treated, while 25 histologically positive stations would not receive adequate treatment, leading to a residual risk for out field recurrences of 2.5 %. Adding both strategies would significantly increase the number of irradiated stations (n = 129; i.e., >50 % more than treating by PET alone) while reducing this residual risk only by 0.5 %. In the end, it is the question of the clinical situation, which will lead to the acceptance or rejection of risks. As locally advanced lung cancers unfortunately by radiochemotherapy can only be locally controlled to an extent of about 30–50 %, current strategies accept these risks in order to dose escalate to the tumor with the chance of a higher rate of tumor control.
Fig. 4
Illustration of different targeting strategies leading to different RT-dose coverage of tumor-affected mediastinal lymph node stations in advanced NSCLC, shown on the example of patient data published by Vanuytsel et al. (2000). The numbers resemble lymph node stations having been investigated by PET, CT and histology
However, prospective randomized clinical studies will have to show, that this policy is safe and beneficial for the patients.
5.2 Head and Neck Cancer
In several studies the sensitivity and specificity of FDG-PET for the detection of lymph node metastases, unknown primary tumor or tumor recurrence after previous treatment in the head and neck region was higher in comparison to MRI and CT. Gambhir et al. (2001) summarized the data of eight studies (468 patients), which evaluated the impact of FDG-PET in staging of head and neck cancer. The average sensitivity and specificity for FDG-PET were 87 and 89 %, whereas for CT 62 and 73 %, respectively. For tumor diagnosis the sensitivity and specificity of FDG-PET, assessed in 7 trials incorporating 193 patient studies, were 93 and 70 %, in comparison to CT with 66 and 56 %, respectively.
Related posts:
 (Yttrium-90 Microspheres) for Metastatic Hepatic Malignancies
 Thyroid Carcinoma
 of Tumors: Pretargeting with Bispecific Antibodies
 Imaging for Radiation Therapy Planning
 Use of Dosimetry in the Planning of Patient Therapy
Stay updated, free articles. Join our Telegram channel

Full access? Get Clinical Tree


