Where Q=flow, μ = blood viscosity, L= length stenosis, and Aa= cross-sectional area.
Moreover, as blood flow converges towards a stenosis a trans-lesion pressure gradient is formed as denoted in the Bernoulli equation.
Where ΔP=pressure gradient, As and νn are the area at the stenosis and the normal reference vessel, respectively, ρ = mass density of blood, L is the length of the stenosis, μ=viscosity of blood,
Accordingly, the pressure gradient occurs due to energy loss as a result of:
1.
Mainly viscous losses due to friction, turbulence plays a minimum role, while separation losses determine the steepness of the stenosis-pressure-flow curve and become more important as flow increase or stenosis becomes more severe
2.
The pressure gradient is inversely related to the square of the stenosis area and directly related to the square of flow.
3.
The lesion length, eccentricity, entrance and exit forces, and distal reference vessel all play a variable role
The gradient generated is exponentially proportionate to baseline stenosis and trans-lesion flow in a curvilinear fashion such that a higher gradient is generated with a more severe stenosis and at high flow levels.
Several invasive techniques have been developed to ascertain myocardial blood flow and its change with coronary stenosis. These are highlighted below:
Coronary flow reserve (CFR) is the ratio of blood flow in a coronary artery at rest to that during maximal hyperemia, and is affected by resistance to flow at any level (i.e. epicardial artery, arterioles, capillaries and myocardium) and thus lacks specificity to determine physiologic significance of epicardial coronary stenoses (Fig. 7.1).
Fig. 7.1
Diagrammatic representation of basal and hyperemic coronary blood flow, fractional flow reserve (FFR), coronary flow reserve (CFR) in normal conditions (CFRN), CFR in the presence of a stenosis (CFRS), as well as instantaneous wave free ratio (iFR) in the presence of stenosis
Relative flow reserve is the ratio of flow during hyperemia in the coronary artery with a stenosis to another coronary artery with no stenosis. However, due to the need for wiring two separate vessels as well as the inherent limitation of multivessel disease, this has not been widely adopted clinically.
Fractional flow reserve (FFR) is a technique that has been developed and validated [6–8] as a means of specifically assessing the physiologic significance of epicardial coronary stenoses. It is defined as the ratio of hyperemic myocardial blood flow beyond an epicardial stenosis (Q s max ) to normal hyperemic myocardial flow in the absence of stenosis (Q N max ):
 Flow (Q) is the ratio of pressure (P) decrease across the microvasculature and myocardium divided by resistance (R), where P d represents pressure distal to stenosis, P a represents pressure in the central aorta, and P v represents pressure in the right atrium:
 Peak hyperemia renders R max negligible, and assuming right atrial pressure is relatively normal, P v also becomes negligible, and the ratio simplifies to the ratio of pressure distal to the stenosis to that in the aorta:
 On the other hand, Coronary FFR (FFR cor ) represents the gradient across an epicardial coronary stenosis without collateral contribution and is defined as
Where P w represents coronary wedge pressure or pressure in the coronary distal to an inflated balloon.
Finally, Collateral FFR (FFR col ) is calculated as (FFRmyo – FFRcor) and represents the FFR related to collateral circulation. FFRmyo is the measure that is most frequently utilized clinically and thus will be referred to through the chapter as simply FFR.
Characteristics of Fractional Flow Reserve
Certain characteristics render FFR attractive as a means of assessing the hemodynamic significant of a coronary stenosis. These are highlighted below:
The Theoretical Normal FFR Value Is 1 Regardless of the Patient, the Vessel, and the Myocardial Bed
This suggests the absence of epicardial vessel resistance to blood flow. The lowest recorded value for a normal coronary was reported at 0.94 [9].
Conversely in patients with detected atherosclerosis elsewhere, 50 % of the coronary arteries will have a lower than normal FFR, and on 10 % the FFR will be lower than the ischemic threshold [9]. This suggests that in the absence of discrete coronary stenosis, but in the presence of atherosclerosis, the epicardial coronary arteries do contribute to the resistance to coronary blood flow. Moreover, myocardial ischemia may be present in patients with atherosclerosis despite the lack of a focal stenosis.
Abnormal FFR Has a Well-defined Cutoff with a Narrow Grey Zone of 0.75–0.8
FFR values <0.75 suggest inducible myocardial ischemia, while values >0.8 may allow safe deferral of revascularization. Intermediate values require sound clinical judgment prior to revascularization or deferral; however, they constitute <10 % of FFR values
FFR Is Not Influenced by Systemic Hemodynamics
FFR is not affected by the response of the microcirculation the changes in heart rate, blood pressure, and myocardial oxygen demand.
FFRmyo Accounts for Both Antegrade and Retrograde (Collateral) Blood Flow
As noted above, collateral flow is accounted for in the equation for FFRmyo.
FFR Normalizes the Stenosis Severity to Myocardial Mass Being Perfused
This means that the larger the myocardial mass being supplied by the coronary, the higher the hyperemic flow, the higher the gradient, and the lower the FFR for a given stenosis. In addition, when the perfusion territory is diminished (as after a myocardial infarction), the FFR value would be higher for a given stenosis, reflecting the decline in the myocardial territory at risk.
FFR Has Unparalleled Special Resolution
FFR reaches a spatial resolution of a few mm. It provides a per segment accuracy of stenosis significance compared to per patient (exercise EKG) and per vessel (stress test) assessment.
Technique and Performance
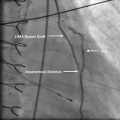
After canalization of the coronary artery, pressure in the aorta is measured from the guide catheter and simultaneous distal pressure can be measured with a commercially available solid-state pressure transducer mounted on a 0.014″ coronary guidewire, such as the FlowWire (St. Jude Medical). The transducer is located at the transition of the radio-opaque distal portion of the wire. Currently available wires are comparable in performance to standard coronary workhorse wires. Prior to crossing the lesion, anticoagulation is achieved as for any percutaneous coronary intervention. Intra-coronary nitroglycerin 200 mcg is administered to ameliorate any coronary vasospasm. The transducer is positioned at the tip of the guide catheter and pressures are “equalized,” making certain that the needle introducer has been backed out of the hemostatic valve. Once the lesion is crossed, an angiogram is obtained to confirm adequate distal wire position. If the guide catheter is deep-seated, it is backed out to avoid pressure dampening (see “Interpretation and Pitfalls” below). Usually, adenosine infused at 140 μg/kg/min through an intravenous catheter is used to induce hyperemia, which typically occurs within 3 min. Central venous catheters were used in the pivotal trials of FFR, but peripheral administration is non-inferior [10]. Other vaso-active agents, such as papaverine, nitroprusside and ragenodoson, have also been used, with variable results [11]. Flushing, tachycardia, bradycardia, hypotension and transient heart block are common side effects of adenosine, while QT prolongation can occur with papaverine, and hypotension routinely occurs with nitroprusside. Side effects are usually self-limiting upon cessation of the infusion.
After achieving steady state, the lowest ratio of mean P d to P a is recorded as the FFR for a given lesion. The pressure loss due to diffuse atherosclerosis is gradual, while that due to a severe focal stenosis is abrupt. This difference can be elucidated during wire pullback and preferably during IV administration. The setup for FFR and a typical readout is displayed in Fig. 7.2.
Fig. 7.2
FFR In a patient with non-significant coronary artery stenosis (Top left) (>0.8) and another with a significant coronary lesion (Top right) (0.76). The bottom left image demonstrates a non-focal stenosis with a gradual decline in the gradient on pull back suggestive of diffuse atherosclerosis (red arrows). On the bottom right, there is a focal stenosis with an abrupt decline in the gradient on pull back (red arrow)
Artifacts, Pitfalls and Troubleshooting
Hyperemic Agents and Pharmacological Considerations
Administration of the hyperemic agent as adenosine should result in a measurable systemic hemodynamic response. If the patient does not experience symptoms and heart rate and blood pressure remain unchanged, the adenosine may not have reached the systemic circulation. If a peripheral IV is being used, it should be checked for patency. If necessary, a central venous catheter can be placed to ensure reliable delivery of vasodilator. If intra-coronary vasodilators are administered, the use of a guide catheter with side holes may result in delivery of some drug into the aorta, rather than the distal coronary microcirculation. Contrast should be cleared from the catheter using heparinized saline to maximize fidelity of pressure recordings. In patients who have received adenosine antagonists as theophylline and caffeine, their effect can be counteracted by intracoronary administration of adenosine.
Hemodynamic Artifacts and Technical Considerations
Careful assessment of pressure waveforms from both transducers is mandatory to obtain reliable FFR data. If the appearance of either pressure tracing is dampened (loss of dicrotic notch, reduction in pulse pressure), checking for air bubbles or leak in transducer equipment is essential. Small guide catheters (<5 French) and not removing the wire transducer will also cause abnormal pressure waveforms.
If systolic and diastolic pressures “drift” downward in one or both transducers, but dicrotic notch and overall appearance of waveform are preserved, both transducers should be re-zeroed to atmospheric pressure and re-equalized at the tip of the guide catheter before proceeding. Decreased pressure and flattening of the aortic diastolic tracing (“ventricularization”) usually occurs distal to a severe stenosis, but may also be artifactually created with deep-seating of the catheter into the coronary artery. In this case, mean aortic pressure will be falsely underestimated, which will lead to a false elevation in FFR [12]. The mean decrease in FFR values for a proximal LAD stenosis between engaged and disengaged catheters in the left main is 0.05 +/- 0.04. If necessary, equalization of pressures can be done in the aorta before catheter engagement, then the catheter is engaged with advancement of guide wire across lesion. The guide catheter can then be disengaged from the coronary artery with the wire still in place across the lesion while FFR measurements are obtained. This technique is particularly useful in the evaluation of aorto-ostial lesions.
“Pseudolesions,” or kinks in the artery, may also lead to a falsely low FFR. Other factors that may affect FFR measurements include, respiratory variation, wirewip artifact, ectopy, and sinewave FFR.
Finally, failure to take into account elevated central venous pressure may lead to falsely elevated FFR. As an example, a lesion has P a = 100 mmHg and P d = 80 mmHg. Assuming central venous pressure is negligible, FFR = 0.80. However, if central venous pressure is 15 mmHg, assuming peak hyperemia is achieved (R max negligible), FFR is actually (80–15)/(100–15) = 0.76.
Less Common Physiological FFR Artifacts
Hydrostatic Pressure Effect
This manifests as a Pd that is higher than Pa and occurs downstream the site of equalization inferring a possible artifact. It occurs due to a differential plane of the distal vessel, which is higher than the proximal vessel (e.g.; PDA and proximal RCA, respectively). This leads to an elevated distal pressure compared to aortic pressure and is usually not greater than 5-mmHg difference. It is more common in the resting condition and in the presence of a stenosis (Fig. 7.3).
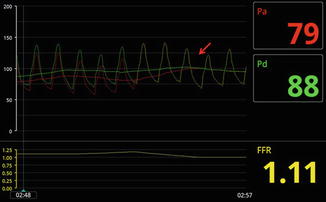
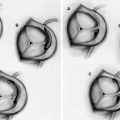
Fig. 7.3
Hydrostatic pressure effect and FFR. In the left figure, when the distal wire is placed in the PDA, the distal transducer is in a lower position than the guide catheter tip. The distal pressure increases due to increased hydrostatic pressure, while the pressure transduced from the guide catheter remains unchanged. This results in a supernormal ratio of distal to proximal pressure (FFR 1.1). The red arrow indicates wire pullback to the ostium of the guide catheter, at which point recorded pressures were identical
Pressure Recovery
This manifests as an FFR that gradually decreases during pullback from distally in the vessel to proximal as the distal edge of the stenosis is reached. It is similar to the pressure recovery phenomenon that occurs across a stenotic aortic valve and is related to recovery of pressure upstream the valve as kinetic energy is reconverted to potential energy and flow separates. It results in an overestimation of the FFR value. As such, it is recommended to place the wire transducer 2–3 vessel diameters distal to the stenosis (Fig. 7.4).
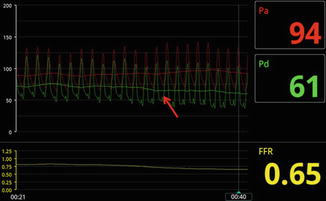
Fig. 7.4
Pressure recovery demonstrated during pull back. As the wire is pulled towards the lesion, the pressure gradient increases. Distal to the lesion, the gradient decreases due to pressure recovery
Oscillation of the FFR Waveform
This manifests as an oscillating pressure waveform secondary to a homeostatic mechanism to maintain a stable blood pressure during vasodilatation. As blood pressure declines, a compensatory mechanism ensues that overcorrects the drop in pressure and subsequently the pressure drops again and the cycle continues. It is more manifest during hyperemia and may interfere with accurate FFR measurement (Fig. 7.5).
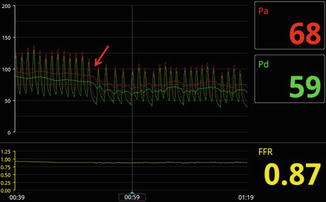
Fig. 7.5
Oscillation of the FFR pressure waveform. Note that as blood pressure declines (red arrow), oscillation of the waveform occurs as a compensatory mechanism that ensues and overcorrects the drop in pressure and subsequently the pressure drops again and the cycle continues
Severe Hypotension, Low Flow/Low Gradient Severe Stenosis, and Paradoxical Vasoconstrictive Response
This manifests as a hyperemic FFR that is higher than baseline FFR and is more common in patients with multivessel disease. During hyperemia, significant hypotension may render the myocardium ischemic due to drop in coronary perfusion pressure. There is a decline in LV contractility with decline in cardiac output and thus the trans-lesion flow is decreased. The diastolic gradient also decreases between Pd and Pa as a result of increased LV pressure. The net effect is an increase in hyperemic FFR value compared to baseline FFR value due to decreased trans-lesional flow (Fig. 7.6).
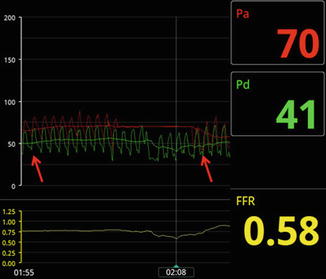
Fig. 7.6
This patient developed hypotension during adenosine infusion due to global LV ischemia, with a decrease in the overall gradient from baseline (red arrows). This is thought to be due to a state of low flow from diminished cardiac output and/or paradoxical vasoconstriction effect caused by adenosine
In patients with severe decrease in LV function and cardiac output, a low flow state may result in a low gradient across an epicardial stenosis despite its severity. This is similar to the low flow/low gradient severe aortic stenosis patients who generate a low gradient across the aortic valve despite a severely narrowed area.
Finally, paradoxical vasoconstriction may occur with adenosine in low flow states. A higher than baseline hyperemic FFR may occur and it has been estimated that this may occur in about 12 % of patients in studies comparing iFFR and FFR.
Specific Lesion and Patient Subsets
Evaluation of Indeterminate Coronary Stenosis and Multivessel CAD
Safety and Efficacy Data
The FFR to Determine Appropriateness of Angioplasty in Moderate Coronary Stenoses (DEFER) trial [13] assessed 325 patients scheduled for percutaneous coronary intervention (PCI) of an intermediate stenosis. Just before planned intervention, FFR was performed. If FFR was ≥0.75, patients were randomly assigned to deferral or performance of PCI. If FFR was <0.75, PCI was performed as planned. There was no statistically significant difference in 5-year survival of patients in the deferral or performance groups, although survival was significantly worse in the reference group (80 %, 73 % and 63 % for deferral, performance and reference groups, respectively). This trial supports the safe deferral of PCI for FFR ≥0.75.
Related posts:
Stay updated, free articles. Join our Telegram channel

Full access? Get Clinical Tree


