Diffusional kurtosis imaging (DKI) is a technique that shows higher sensitivity and specificity compared with diffusion tensor imaging (DTI) in identifying abnormalities in tissue microstructure.1 DKI complements DTI by assessing measures of nongaussian distribution in diffusion.2 To analyze gaussian versus nongaussian diffusion let’s remember that water molecule diffusion is a random process and may be depicted by a probability distribution. For homogeneous solutions, molecular diffusion follows a gaussian curve form of distribution, with the width of the distribution curve proportional to the diffusion coefficient (▶ Fig. 15.1a). This is the assumption used by DTI, resembling the classical diffusion example of a drop of ink in a bucket of still water (▶ Fig. 15.1b).
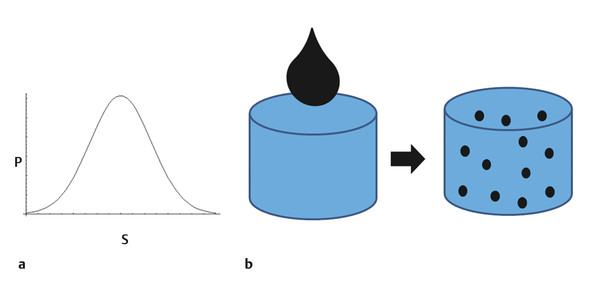
Fig. 15.1 (a) Graphic shows diffusion displacement (S) probability (P). (b) Diagram shows random diffusion displacement in a homogeneous solution, which resembles a drop of ink in a still bucket of water.
Data from water molecules diffusing in the brain can be used to probe tissue microstructure noninvasively with diffusion magnetic resonance imaging (MRI) techniques. Diffusion MRI is most sensitive to the microstructural spaces of 10 μm, which is the typical distance that a water molecule diffuses during approximately 100 ms (the interval of time needed to acquire an individual diffusion signal). Thus diffusion MRI is ideal for investigating cell-sized microstructural features and represents a unique ability to noninvasively assess the microstructure of human brain tissue in vivo. Using the gaussian model approximation, DTI can be used, for example, to measure the anisotropic properties of white matter by exploring the coherent diffusion along axonal fibers. However, the human brain does not resemble a homogeneous solution; it has a variety of compartments, including different types of cells with variable degrees of membrane permeability (depending on channels and membrane properties), and distinct intra- and extracellular contents. This is quite different from the example of a drop of ink in a bucket of still water (▶ Fig. 15.2). Therefore, the gaussian distribution assumption does not truly reflect the probabilistic distribution of water molecules diffusing in brain tissue.3,4,5
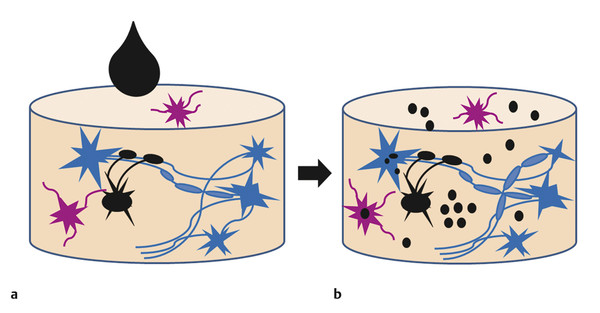
Fig. 15.2 (a) Diagram shows a heterogeneous medium that resembles brain tissue, before a drop of ink is introduced. (b) Diagram shows the uneven diffusivity of a drop of ink in the heterogeneous medium.
More specifically, there are two critical issues for which DTI is limited. The first one involves fiber tractography; the DTI model is incapable of resolving multiple fiber orientations (i.e., crossing fibers). The second issue is that DTI samples only a fraction of the information contained in the dynamics of molecular water diffusion; it does not denote multiple distinct intravoxel compartments and is therefore not capable of depicting intravoxel heterogeneity.6,7,8,9,10 Interestingly, these two limitations are closely related to each other, so that addressing the second leads to a resolution of the first.
Several strategies have been studied to solve these problems; DKI is one of them and it opens the opportunity for further microstructural assessment. The origin of the word kurtosis comes from the Greek word kyrtos, meaning curved or arching. In probabilistic theory and statistics, kurtosis is a description of a dimensionless metric of “peakedness” (width of peak) for a probability distribution of a random value. Excess of kurtosis, measured by DKI, denotes the deviation of a probability distribution from a gaussian form (▶ Fig. 15.3). DKI is not a distinctly new way of acquiring diffusion images, but it is a different way to investigate the information that is contained within the diffusion data.2,3,4,5,11
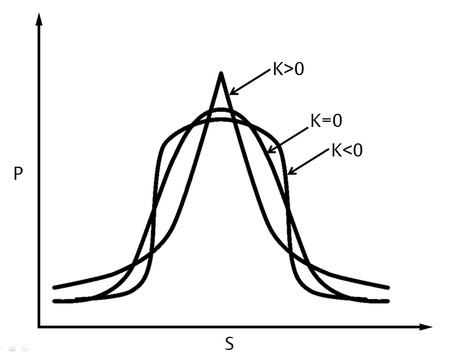
Fig. 15.3 Diagram shows displacement (S) probability (P). K = 0 curve shows a purely gaussian distribution. K > 0 curve shows more weight in the center when compared to the gaussian form. K < 0 curve shows less weight in the center.
15.2 DKI Acquisition
DKI can be obtained on modern clinical MRI systems within a clinically acceptable timeframe of 6 to 7 minutes. DKI data are acquired in a similar fashion compared with conventional DTI, but require at least three b values (up to 2,000 s/mm2), which is somewhat higher than typically used in DTI (1,000 s/mm2). DKI is related to q-space imaging methods, but it is relatively less demanding in terms of imaging time, hardware requirement, and postprocessing effort compared with other techniques.
In order to obtain the DKI with a reasonable degree of precision, b values somewhat larger than those employed in DTI are necessary so that the departure from linearity is measurable. In the brain, b values of ~ 2,000 s/mm2 are sufficient. The precision of DKI estimates decreases rapidly if the maximum b values are reduced substantially below 2,000 s/mm2.1
Additionally, the DKI sequence is acquired with at least 15 diffusion gradient directions. Although this is the minimum number of diffusion directions required, we typically acquire 30 directions for two reasons: first, oversampling of the diffusion directions makes the final estimates for the DKI metrics less sensitive to motion artifacts, such as those caused by cardiac-induced brain pulsations; second, by using more directions one effectively averages some of the higher angular frequencies. In addition, 30 directions is a particularly convenient choice because the diffusion directions can be chosen to lie on the vertices of a truncated icosahedron.
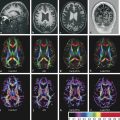
Finally, DKI maintains the ability to estimate all standard DTI metrics, including mean, axial, and radial diffusivity (respectively denoted as MD, D║, D┴) and fractional anisotropy (FA), and one can also generate kurtosis metrics, such as mean, axial, and radial kurtosis (similarly, denoted as MK, K║,K┴)2,3,4,11,12,13,14 (▶ Fig. 15.4).
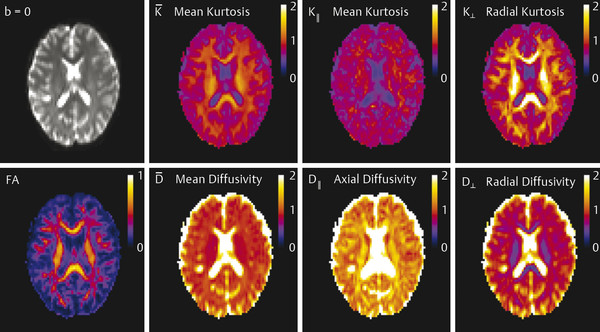
Fig. 15.4 Images show the postprocessed diffusion tensor imaging and diffusional kurtosis imaging metrics of a normal patient. FA, fractional anisotropy. (With permission from Jensen JH, Helpern JA. MRI quantification of non-Gaussian water diffusion by kurtosis analysis. NMR Biomed 2010; 23(7): page 707.)
15.2.1 Postprocessing
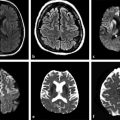
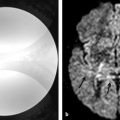
In the conventional analysis of DTI data, the logarithm of the signal intensity is fit to a linear function of the b value, and an estimate for the diffusion coefficient is extracted. In the DKI calculation the data are fitted to a quadratic function, which allows for estimates of both the diffusion and kurtosis tensors. From these tensors, DTI and DKI metrics are then calculated. Most scanner consoles provide DWI and FA calculations, as well as DTI tractography automatically (▶ Fig. 15.5). The resolution is somewhat inferior to that of conventional clinical DWI, but it maintains diagnostic quality (▶ Fig. 15.5a). Postprocessing also includes coregistration, averaging, and (optionally) smoothing.
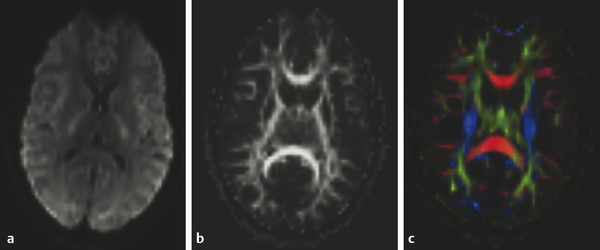
Fig. 15.5 Three diffusion weighted images (DWIs) acquired with multiple b values, maximum b value of 2,000 s/mm2. (a) DWI b 1,000 s/mm2, (b) fractional anisotropy map, (c) tractography with color orientation. The images were generated automatically by the scanner software.
Noise, motion, and imaging artifacts can introduce errors into the estimated tensors, and sufficiently large errors can cause the tensor estimates to be physically and/or biologically erroneous. Typically, it is required that the diffusion coefficients be positive and that the kurtosis lie between a predefined minimum value, Kmin, and a predefined maximum value, Kmax. Any outlier values are systematically brought into this range. For example, if the diffusion coefficient is calculated to be less than zero, then both the diffusion coefficient and the kurtosis are reset to zero. In this manner, the extrinsic and intrinsic artifacts effects on the final diffusion metric maps can be substantially reduced.
There are a number of factors that can lead to errors in DKI values. These include regions with short T2 relaxation (e.g., regions with high iron content leading to poor signal:noise), gradient pulse duration effects, motion, inaccuracies of the fitting model, not fully accounting for imaging gradient contributions to b values, and system noise. However, the reproducibility of DKI measures of nongaussianity is similar to that for standard DTI metrics.4,11,13,15
15.3 DKI Metrics Interpretation: Applications in the Human Brain
Here we review the accumulating evidence that DKI can be a powerful and feasible investigational tool to assess microstructural changes in several developmental and pathological processes. Kurtosis metrics may act as the earliest biomarker to identify some of these pathological processes. The principal advantage of DKI metrics compared with other diffusion metrics is that they are sensitive measures of tissue structure organization and complexity at a micrometer scale believed to arise from diffusion barriers, such as cell membranes, organelles, and water compartments (e.g., extracellular and intracellular). Another advantage is that DKI is sensitive not only to white matter (WM) microstructural changes but also to gray matter (GM) abnormalities.2,14 DKI also enables more accurate WM tractography in anatomical locations of fiber crossing when compared to DTI (see ▶ Fig. 15.6).
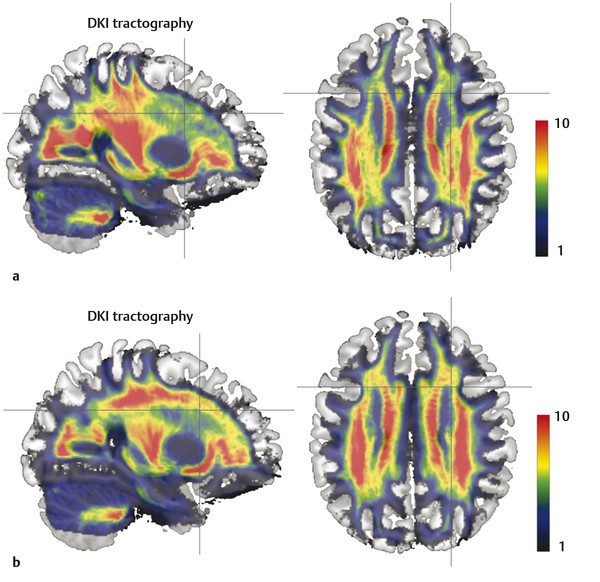
Fig. 15.6 (a) Conventional diffusion tensor imaging (DTI) tractography is limited by its ability to resolve fiber tracking in locations of white matter fiber crossing. (b) Conversely diffusional kurtosis imaging (DKI) is more sensitive to the orientation distribution of water diffusion. The panel shows the voxelwise count of tractography streamlines. Note the count drop in the corona radiata in DTI tractography compared to DKI. (Courtesy of Dr. Leonardo Bonilha with permission.)
One typical example of DTI metrics interpretation is increased mean diffusivity (MD) and decreased FA, indicating loss of WM integrity. Increased D┴ is believed to be derived from an increase in axonal membrane permeability and loss of myelin integrity, and decreased D║ is believed to reflect axonal damage. Mean kurtosis (MK) is the kurtosis counterpart of MD, and an increase in MK appears to be related to an increase in complexity of the medium due to various factors, possibly including an increase in organelles, cell membrane layers, and cell packing, among others. K┴ and K║ resemble directional D┴ and D║ and correspond to directional kurtosis. The combination of these parameters ensures a more sensitive characterization than fitting the signal decay to a monoexponential model only.16
15.3.1 Aging Process
Stay updated, free articles. Join our Telegram channel

Full access? Get Clinical Tree


