Group
T category
N category
M category
Stage 0
Tis
N0
M0
Stage IA
T1
N0
M0
Stage IB
T2
N0
M0
T1
N1
M0
Stage IIA
T3
N0
M0
T2
N1
M0
T1
N2
M0
Stage IIB
T4a
N0
M0
T3
N1
M0
T2
N2
M0
T1
N3
M0
Stage IIIA
T4a
N1
M0
T3
N2
M0
T2
N3
M0
Stage IIIB
T4b
N0
M0
T4b
N1
M0
T4a
N2
M0
T3
N3
M0
Stage IIIC
T4b
N2
M0
T4b
N3
M0
T4a
N3
M0
Stage IV
Any T
Any N
M1
Table 14.2
AJCC TNM staging of gastric carcinoma
Primary tumor (T) | |
TX | Primary tumor cannot be assessed |
T0 | No evidence of primary tumor |
Tis | Carcinoma in situ: intraepithelial tumor without invasion of the lamina propria |
T1 | Tumor invades lamina propria, muscularis mucosae, or submucosa |
T1a | Tumor invades lamina propria or muscularis mucosae |
T1b | Tumor invades submucosa |
T2 | Tumor invades muscularis propria |
T3 | Tumor penetrates subserosal connective tissue without invasion of visceral peritoneum or adjacent structures |
T4 | Tumor invades serosa (visceral peritoneum) or adjacent structures |
T4a | Tumor invades serosa (visceral peritoneum) |
T4b | Tumor invades adjacent structures |
Note: A tumor may penetrate the muscularis propria with extension into the gastrocolic or gastrohepatic ligaments, or into the greater or lesser omentum, without perforation of the visceral peritoneum covering these structures. In this case, the tumor is classified T3. If there is perforation of the visceral peritoneum covering the gastric ligaments or the omentum, the tumor should be classified T4. (TNM) | |
Regional lymph nodes (N) | |
NX | Regional lymph node(s) cannot be assessed |
N0 | No regional lymph node metastasis |
N1 | Metastasis in 1–2 regional lymph nodes |
N2 | Metastasis in 3–6 regional lymph nodes |
N3 | Metastasis in seven or more regional lymph nodes |
N3a | Metastasis in 7–15 regional lymph nodes |
N3b | Metastasis in 16 or more regional lymph nodes |
Note: A designation of pN0 should be used if all examined lymph nodes are negative, regardless of the total number removed and examined. | |
Distant metastasis (M) | |
M0 | No distant metastasis |
M1 | Distant metastasis |
Fig. 14.1
Observed survival rates for 10,601 surgically resected gastric adenocarcinomas. Data from the SEER 1973–2005 Public Use File diagnosed in years 1991–2000. Stage IA includes 1,194; stage IB, 655; stage IIA, 1,161; stage IIB, 1,195; stage IIIA, 1,031; stage IIIB, 1,660; stage IIIC, 1,053; and stage IV, 6,148 (used with the permission of the American Joint Committee on Cancer (AJCC), Chicago, IL. The original source for this material is the AJCC Cancer Staging Manual Seventh Edition (2010), published by Springer Science and Business Media LLC www.springer.com)
Imaging Primary Gastric Carcinoma with [18F]FDG-PET
Unlike esophageal carcinoma, in which the majority of tumors (particularly T2–T4) are identified on [18F]FDG-PET imaging, the primary gastric lesion is less imaged well by [18F]FDG-PET. This has been demonstrated in several series with sensitivity for detection of gastric lesions ranging from 21% to 100%. [3–10]. Specificity ranged from 78% to 100% with a median of 100% due to the study population in which the incidence of disease is often 100%. The true specificity is likely to be well below 100%. There are several factors that affect the sensitivity and specificity to detect a primary gastric carcinoma. Significantly, there is a variable and occasionally intense uptake of [18F]FDG of a physiological nature within the gastric wall [6, 8, 11]. [18F]FDG uptake may also correspond to acute inflammation such as superficial or erosive gastritis [12]. This leads to two disadvantages in the detection of gastric cancer. Firstly, an awareness of this phenomenon must exist in order to avoid a high number of false-positive diagnoses. Conversely, over-awareness may lead to failure to detect weakly enhancing and diffuse malignant lesions.
Tumor Size and Depth (T Stage) and [18F]FDG-PET
Tumor size and T stage may influence the sensitivity of PET imaging in the detection of the primary gastric lesion. Sensitivity has been reported as low as 21% for detecting tumors <30 mm in size, and increased to 76% for lesions over 30 mm [7]. Moreover, gastric cancer limited to the mucosa or submucosa (T1 lesions) is less likely to be detected by PET than more advanced T2–T4 lesions. Early gastric cancers (T1) sensitivity for detection ranges from 26% to 63%, whereas that for more advanced disease (T2–T4) ranges from 83% to 98% [3, 6, 7, 10]. Figure 14.2 graphically depicts the range of sensitivity to diagnose early and advanced gastric cancer.
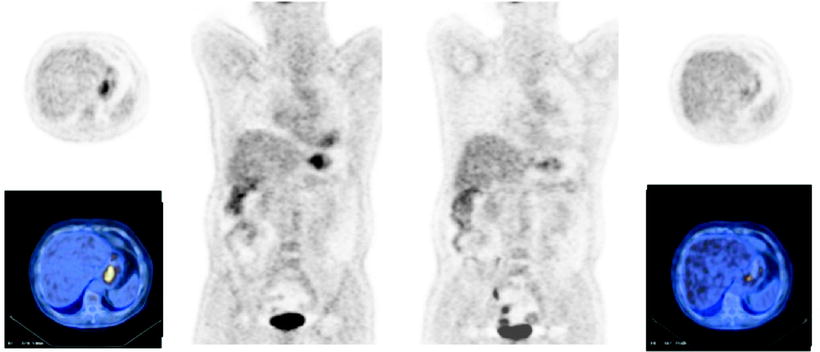
Fig. 14.2
Sensitivity of [18F]FDG-PET to identify primary early and advanced gastric carcinoma
Histological subtype variants also influence glucose uptake and therefore the ability of PET to detect the primary lesion. The ability of [18F]FDG-PET to detect non-intestinal gastric primary tumors can range from 0% for T1 non-intestinal primaries to 77% for advanced non-intestinal disease. For intestinal-type tumors, sensitivity ranges from 44% for T1 tumors to 92% T2 or greater disease [7, 8, 13]. This may relate to the fact that the GLUT-1 transporter has been shown to be preferentially expressed on intestinal type gastric carcinoma cell subtype, with decreased expression on mucous secreting and signet ring type cells [14, 15]. GLUT-1 expression has been shown in multivariate analysis to be the most influential factor relating to [18F]FDG uptake in gastric carcinoma [16]. There is also a strong correlation between intra- or extracellular mucin production and SUV uptake, and many non-intestinal type tumors are represented by signet ring or mucinous gastric carcinomas [8]. However, a number of studies have not shown correlation between histological subtype and SUV uptake and sensitivity of [18F]FDG-PET in detection of primary gastric cancer [5, 6, 17]. It is not clear whether the location of the tumor (proximal/middle/distal) in the stomach influences the results of [18F]FDG-PET scanning, as results in this area are conflicting [6–8].
Techniques to Improve Detection of the Primary Gastric Lesion
Simple measures such as distention of the stomach by water or less commonly food have been shown to improve the accuracy of detection of gastric lesions both preoperatively and in the postoperative remnant stomach [10, 18, 19]. In an effort to improve detection of gastric cancer by PET, the pyrimidine analog 3′-deoxy-3′-18F-fluorothymidine (18F-FLT) has been used as an alternative radiotracer. One study demonstrated increased sensitivity of 18F-FLT-PET for detection of gastric tumors, especially if those tumors were not [18F]FDG avid [4]. This may improve detection of previously difficult to detect tumor types such as mucin producing and signet ring cell tumors. A second smaller study showed comparable efficacy between the two moieties [5]. In both studies, mean SUV uptake was lower for 18F-FLT-PET than for [18F]FDG-PET. Additional improvements may be made possible by improving spatial resolution of the imaging equipment [20].
Screening for Gastric Carcinoma with [18F]FDG-PET
[18F]FDG-PET has not been shown to be an effective screening tool for the diagnosis of gastric cancer. In one study, combined with endoscopy in asymptomatic individuals, PET/CT detected 2/20 cancers from 2,861 patients screened giving a sensitivity of 10% only and a positive predictive value of 8.3%. 18/20 cancers were early gastric cancers (T1). There were 22 false positives on this study. There was no significant difference between the SUV values of the false positives and the true positives [21]. A second study of 1,336 asymptomatic patients detected two gastric cancers in addition to nine other malignancies. The rate of false positive in this study was 3 times the rate of true-positive findings [22]. Therefore, the screening sensitivity of [18F]FDG-PET in an asymptomatic population is less again than that in a diseased population. Furthermore, in a study of 1,006 subjects without a history of cancer who underwent screening PET and CT scan and were divided into two groups: those with a significantly increased SUV in the gastric wall and those without (SUV 4.1 and 2.8, respectively). There were no CT correlates of disease at the time of the PET/CT scan. The subjects were then followed for 1 year. None in the higher SUV group developed a gastric malignancy, and one in the lower SUV group developed a carcinoma in the stomach wall [23]. Thus, even increased SUV without a CT correlate in an otherwise healthy person may not be indicative of malignancy.
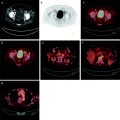
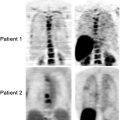
FDG-PET and Lymph Node Status
Survival in gastric cancer patients decreases with lymph node involvement, and with the number of lymph nodes involved. Five-year survival for patients with N0, N1, N2, and N3 gastric cancer is 86.1%, 58.1%, 23.3%, and 5.9%, respectively [24]. Knowledge of lymph node status therefore is not only of importance with respect to prognosis but may also guide in surgical treatment planning and when deciding which patients may benefit from neoadjuvant chemotherapy.
[18F]FDG-PET has been examined both alone, in comparison with CT imaging, and combined as CT-PET, in the preoperative assessment of nodal status for gastric cancer (Table 14.3). The sensitivity of PET is generally low for the detection of lymph node metastases ranging from 22% to 60% for normal resolution scans [3, 6, 7, 9, 17, 20, 25–27]. It is possible that this may reflect the low spatial resolution of PET which leads to difficulty discerning perigastric lymph nodes from the gastric primary tumor, as sensitivity has been shown to increase to up to 73% with a higher resolution scan [20]. This compares poorly to the sensitivity of CT which ranges from 52% to 77% in the same series. By contrast, the specificity of PET is higher than that of CT, ranging from 62% to 100%, compared to CT (range 62–94%).
Table 14.3


Gastric cancer lymph node staging by PET
Related posts:
Stay updated, free articles. Join our Telegram channel
Full access? Get Clinical Tree
