Fig.16.1
Survival stratified according to stage grouping for liver tumors. (Data from Vauthey JN, Lauwers GY, Esnaola N, et al. A simplified staging for hepatocellular carcinoma. J Clin Oncol. 2002;20:1527–36. Used with the permission of the American Joint Committee on Cancer (AJCC), Chicago, Illinois. The original source for this material is the AJCC Cancer Staging Manual, Seventh Edition (2010) published by Springer Science and Business Media LLC, http://www.springer.com)
Fig. 16.2
Stratification of survivals for 647 patients with confirmed intrahepatic cholangiocarcinoma based on new T-stage classification using SEER registry data. T1: solitary tumor without vascular invasion; T2: solitary tumor with vascular invasion or multiple tumors; T3: tumor perforating the visceral peritoneum or involving the local extra hepatic structures by direct invasion. (Used with the permission of the American Joint Committee on Cancer (AJCC), Chicago, Illinois. The original source for this material is the AJCC Cancer Staging Manual, Seventh Edition (2010) published by Springer Science and Business Media LLC, http://www.springer.com)
Table 16.1
AJCC anatomic stage and prognostic groups for liver
Group | T category | N category | M category |
|---|---|---|---|
Stage I | T1 | N0 | M0 |
Stage II | T2 | N0 | M0 |
Stage IIIA | T3a | N0 | M0 |
Stage IIIB | T3b | N0 | M0 |
Stage IIIC | T4 | N0 | M0 |
Stage IVA | Any T | N1 | M0 |
Stage IVB | Any T | Any N | M1 |
Table 16.2
Anatomic stage and prognostic groups for intrahepatic biliary tumors
Group | T category | N category | M category |
|---|---|---|---|
Stage 0 | Tis | N0 | M0 |
Stage I | T1 | N0 | M0 |
Stage II | T2 | N0 | M0 |
Stage III | T3 | N0 | M0 |
Stage IVA | T4 | N0 | M0 |
Any T | N1 | M0 | |
Stage IVB | Any T | Any N | M1 |
Since the uptake of [18F]fluorodeoxyglucose ([18F]FDG), based on the enhanced glucose metabolism in cancer cells, is considered as a sensitive marker of tumor viability, tumor detection by [18F]FDG-PET has been applied for HCC [9, 10]. On the other hand, several reports indicated low sensitivity of [18F]FDG for detecting HCC [10–15]. Relatively low [18F]FDG accumulation in HCC may be due to the presence of glucose-6-phosphatase (G-6-Pase), an enzyme present in normal liver, which converts [18F]FDG-6-P to [18F]FDG, which allows the tracer to diffuse out of tumor cell. Therefore, there may be low contrast between HCC and normal liver tissue, making it very difficult to identify small lesions with certainty [16, 17]. This is particularly true of well-differentiated HCC, whereas poorly differentiated HCC may show higher [18F]FDG uptake [18] (Figs. 16.3 and 16.4). This information is useful in the preoperative assessment of tumor differentiation, especially in patients with multiple lesions. Preoperative [18F]FDG-PET may possibly predict postoperative survival in HCC patients treated with partial hepatectomy [18, 19]. There are a number of tumor biomarkers as prognostic indicators in patients with HCC treated by surgery, including alpha-fetoprotein (AFP), AFP-L3, and PIVKA-II [20–23]. However, it remains unknown whether [18F]FDG-PET/CT will provide additional prognostic information.
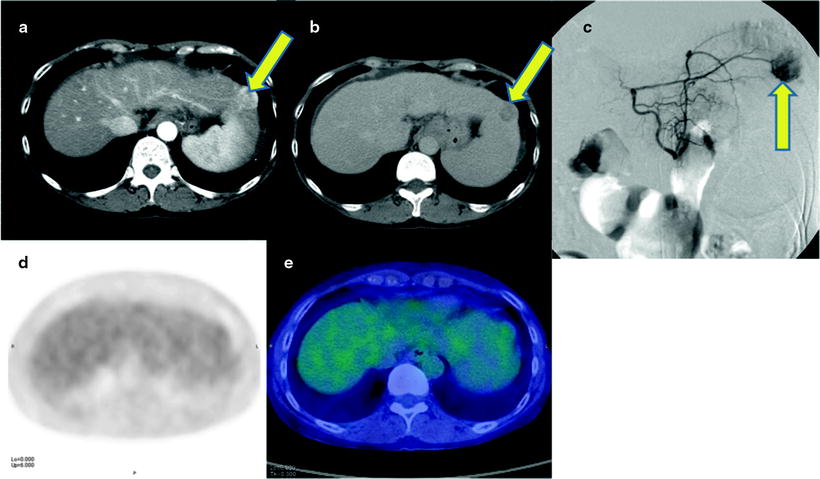
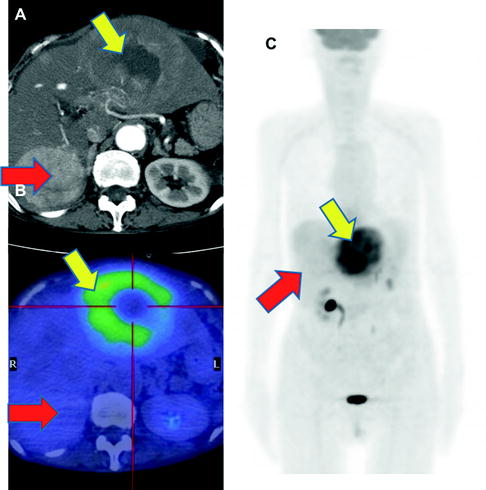
Fig. 16.3
Normoglycolytic hepatoma. Multiphase contrast-enhanced X-CT shows a tumor lesion which has rich arterial perfusion but poor portal perfusion in left lobe (a, b; yellow arrows). Arterial angiography also shows early intense stain at same point (c; yellow arrow). These findings mean a typical classical hepatoma. However, PET and PET-CT images do show only a normal [18F]FDG accumulation on hepatoma (d, e)
Fig. 16.4
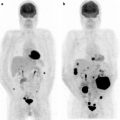
Synchronous double hepatomas. Contrast-enhanced X-CT at arterial phase showed two of intrahepatic tumors. The heterogeneously stained tumor in left lobe shows intensely but heterogeneously accumulation of [18F]FDG (a–c; yellow arrows). The other homogenously stained tumor in right lobe shows [18F]FDG normo-accumulation (a–c; red arrows). Both tumors were biopsied and proved that left-lobe hepatoma was poorly differentiated, but right-lobe one was well differentiated
Accurate assessment of treatment monitoring and outcome is another important role of [18F]FDG-PET [24–28]. When the [18F]FDG uptake in the lesion was higher or similar to the activity in the surrounding tissue, the presence of residual tumor was seen on histological confirmation. On the other hand, reduced [18F]FDG uptake in the lesion makes it unlikely that there is residual tumor after TAE treatment [29, 30].
While [18F]FDG-PET provides low sensitivity for detecting primary HCC lesions, it has clinical value for identifying distant metastasis [31] (Figs. 16.5 and 16.6). The visibility of [18F]FDG in HCC metastases may be due to the relatively low background in areas, such as lung and bone, as compared to the normal liver. In addition, most metastatic lesions occur in patients with poorly differentiated HCC, which have high [18F]FDG uptake. Similarly, [18F]FDG-PET is useful for the early detection of recurrence [32–35] (Fig. 16.7).
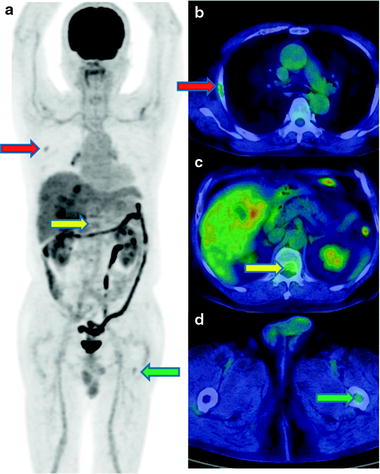
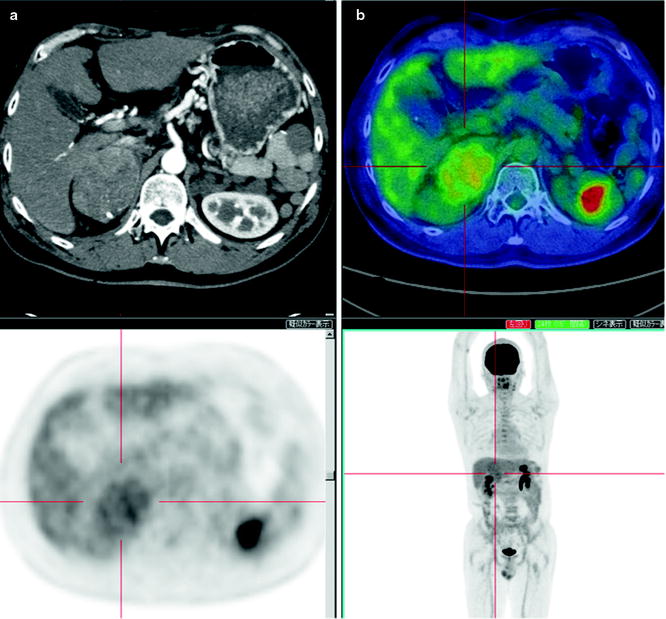
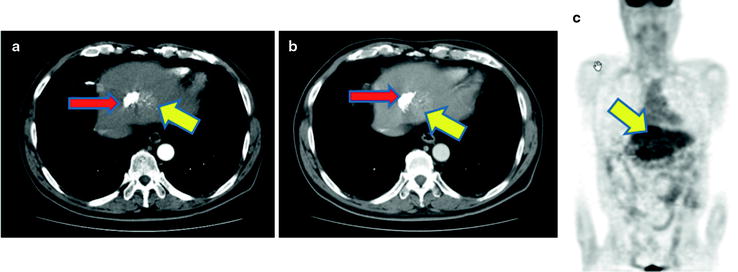
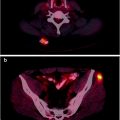
Fig. 16.5
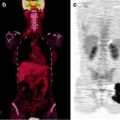
Multiple osseous metastases. Slight [18F]FDG accumulations are shown at right thorax (a; red arrow), back (a; yellow arrow), and left femur (c; green arrow) on PET image. Fusion images disclose that these are respectively costal (b; red arrow), vertebral (c; yellow arrow), and femoral (d; green arrow) bone metastasis
Fig. 16.6
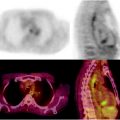
An adrenal metastasis of hepatoma. A male with history of HCC therapy with AFP elevation but no intrahepatic recurrence. Contrast-enhanced X-CT at arterial phase shows early enhance on right enlarged adrenal gland (a). PET-CT shows moderate hyperglycolysis at adrenal gland, so resection of this tumor disclosed metastatic hepatoma of adrenal gland (b). [18F]FDG accumulation is slight and heterogeneous as well as general findings of hepatoma on PET (c, d)
Fig. 16.7
A hepatoma recurrence after arterial chemoembolization. Contrast-enhanced X-CT at both arterial and portal phase shows a slight enhancement as suspected viable recurrent hepatoma, and a high [18F]FDG accumulation is coincident with this stain (a–c; large arrows). [18F]FDG-PET is to easily visualize viable hepatoma if the high-density area at X-CT image is difficult to distinguish with post-chemoembolized change (a, b; small arrows)
To improve the sensitivity of [18F]FDG-PET to detect HCC, investigators have suggested a 2–3 h delay between [18F]FDG injection and imaging instead of the conventional 1 h delay between injection and imaging [36]. The delayed [18F]FDG-PET may differentiate HCC lesion showing persistent [18F]FDG uptake from normal liver tissue with gradual washout of [18F]FDG. Another approach is to use a different PET tracer. [11C]acetate has recently been applied to show higher tracer uptake with better contrast in HCC lesions [37–40]. Although these studies remain preliminary, [11C]acetate PET may hold a promise for wide clinical use for detection, prognosis, and treatment monitoring of HCC.
In conclusion, [18F]FDG-PET provides limited sensitivity for detecting HCC, particularly well-differentiated types due to similar [18F]FDG kinetics with normal liver. However, some poorly differentiated HCC shows high avidity for [18F]FDG, and therefore, preoperative [18F]FDG-PET may select high-risk group. In addition, it has a potential role for detecting distant metastasis and tumor recurrence after treatment. We need more experience to confirm the clinical value of [18F]FDG-PET complementary to the conventionally used tumor biomarkers.
Carcinoma of the Biliary Tract
Cholangiocarcinoma is a neoplasm that arises from the cholangiocytes, the epithelial cells lining the bile ducts. The majority of lesions are adenocarcinoma. Carcinoma of the extrahepatic biliary tract is defined by the location of the tumor into Klatskin (hilar) tumor, hepatic bile duct, common bile duct tumor, gallbladder cancer, and ampulla of Vater cancer. Histopathological characterization of extrahepatic biliary cancer divides lesions into moderately differentiated, poorly differentiated, or undifferentiated adenocarcinoma [41]. Carcinoma of extrahepatic biliary tract is histopathologically divided into mass-forming (nodular), periductal-infiltrating (sclerosing), and intraductal (papillary) type [41] (Fig. 16.8). These histopathological differences classification give a great deal of influences at the situation using the radiological diagnosis. Although mass-forming types shows vertical progression, and periductal-infiltrating lesion shows horizontal progression, both of them progress invasively to around structures. However, intraductal type including mucin-producing tumor progresses horizontally but noninvasively [41].
Fig. 16.8
Classification of cholangiocarcinoma
In the USA, it is estimated that there have been 9,760 new cases of cholangiocarcinoma in 2010, and 3,320 deaths (ACS Cancer Facts 2010). Its incidence is annually 1–2 per 100,000 in the western world [42]. This rate is rising around the world, while in Japan the rate is decreasing in the twenty-first century. The annual number of deaths due to extrahepatic biliary cancer was about 3,600 people in the U.S.A. Statistics show that the 60s are the most frequent age, and the frequency in men is about twice than in women. In 2006, this number is less than in Japan (17,000 people).
Several known risk factors are described for cholangiocarcinoma including primary sclerosing cholangitis [(PSC, often associated with), ulcerative colitis], Caroli’s congenital abnormalities of the biliary tree (Caroli’s disease syndrome, congenital hepatic fibrosis, and choledochal cysts), parasitic biliary infection (e.g., liver fluke, Clonorchis), chronic typhoid fever, and so on [43]. It is thought that a long-term inflammation of the biliary tract or abnormal choledocholithiasis influences carcinogenesis, but there are a lot of unknown molecular carcinogenic processes [44]. However, previous reports predict multistep carcinogenesis because biliary cancer often shows skip lesion and heterochronous lesion.
The first clinical symptom is often painless jaundice, sometimes accompanied by pruritus, weight loss, and fever. Abdominal pain may occur in 30–50% of patients. Patients often have advanced disease at the time of diagnosis. Almost all obstructive jaundice with liver function disorder and more than half have been progressing as undetectable.In general, cholangiocarcinoma have a poor prognosis because complete resection is only curative methods. 5-years survival rate under complete resection is still low (26–51%). Generally the prognosis of biliary cancer is worse than that of ampulla of Vater cancer. Exceptionally, prognosis of intraductal type is better than other types if complete resection is possible [45–52].
In non-resectable cases, chemotherapy, radiotherapy including remote afterloading system (RALS), and expandable metallic biliary endoprosthesis (EMBE) are often used and are done individually or collaboratively as well as in recurrent cases [53]. Chemotherapy with 5-FU and gemcitabine chloride is only evident to improve prognosis of biliary cancer patient [54]. But their prognosis actually worsens to 1%. In another study, a combination of external radiation and RALS with EMBE therapy showed the prolonged survival rate, up to 62% for 1 year and 14% for 3 years. This survival rate is equal to the results in resectable but non-curable patient group. Future direction is the development of early detection technique like new PET tracer and new antitumor agents.
Clinical Diagnosis and Initial Staging
Diagnostic algorithm and TNM staging in biliary cancer are shown in Table 16.1 and Fig. 16.9. The first clinical diagnostic step is transabdominal ultrasonography (US). The US images give the point of biliary obstruction and the indication of percutaneous biliary drainage methods easily. The second diagnostic step is noninvasive tools such as x-ray CT and MRI and MR cholangiopancreatography (MRCP). These images offer information of tumor size, locoregional depth, and metastatic lesions. For the further staging for operability, endoscopic retrograde cholangiography (ERC), percutaneous transhepatic cholangioscopy (PTCS), endoscopic US, intraductal US (IDUS), and peroral cholangioscopy (POCS) are essential but more invasive methods. Using these techniques, biopsy or brush cytology is often possible and easier.
Fig. 16.9
Diagnostic algorithm in biliary cancer
Role of [18F]FDG-PET
Initial Diagnosis and Staging
As similar to most of cancer patients, [18F]FDG-PET has an important role in accurate staging of hepatobiliary cancer and in identifying treatment strategy. In addition, this imaging may select aggressive-type subgroups.
There are a number of reports of diagnostic accuracy of PET and PET-CT for detecting primary lesions of biliary cancer. The sensitivity was ranging 91–95% for biliary cancer, 55–83% for extrahepatic biliary cancer, and 78–94% for gallbladder cancer [55–64] (Table 16.3). Such large difference in diagnostic accuracy may come from different patient population. Of particular, PET or PET/CT may have limited value for detecting small cholangiocarcinoma, especially lesions that do form masses, without mass-forming type due to limited spatial resolution of PET. In addition, high frequency of cholangitis, which may have high [18F]FDG uptake with or without tumor lesions, often causes false-positive findings. Similarly, one may misunderstand tumor localization because jaundice and acute cholangitis almost always coexist (Fig. 16.10). Our previous report and others indicated that the sensitivity of PET was higher for detecting mass-type cholangiocarcinomas tumors than bile duct wall-thickening-type and mucin-producing-type cholangiocarcinomas (Figs. 16.10, 16.11, and 16.12) [61]. Anderson et al. reported that mass-forming or intraductally progressive (volume) type showed higher frequent [18F]FDG accumulation in (17/20) patients compared to the periductal-infiltrating (thin) type, which was found to be [18F]FDG positive in only 2/11 patients [55]. Thus, various histopathological characteristics may significantly alter the rate of detectability in biliary cancer diagnosis [58, 59]. Since ampulla of Vater cancer usually shows a mass almost massive, these lesions are usually [18F]FDG positive [60].
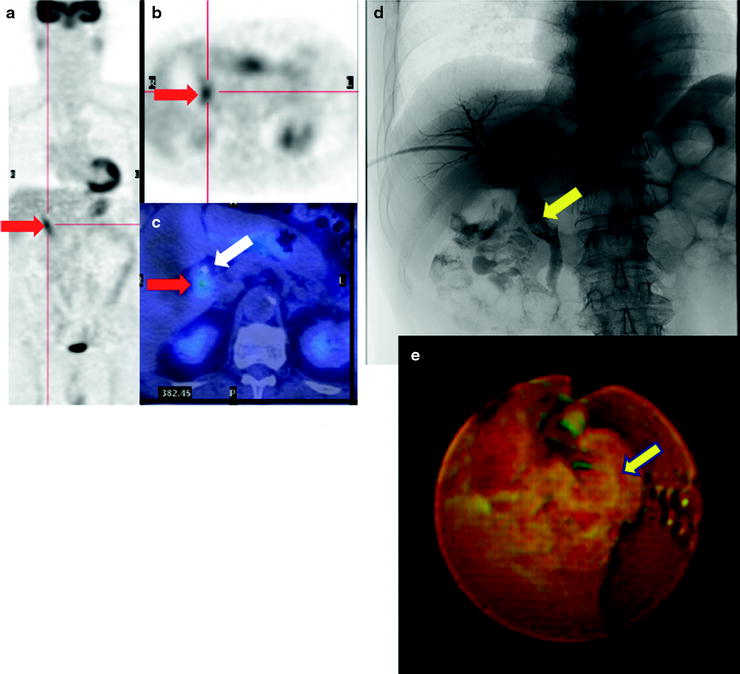
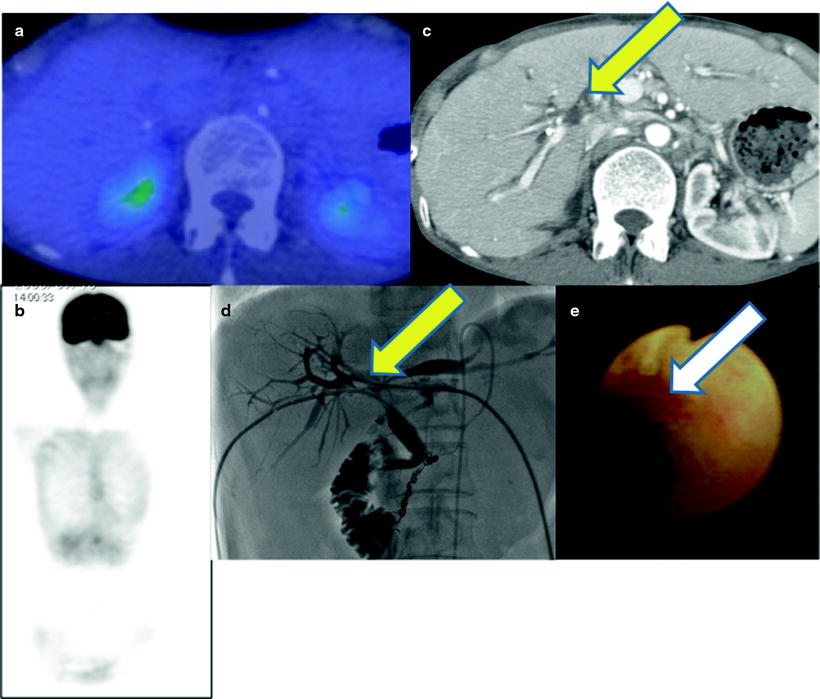
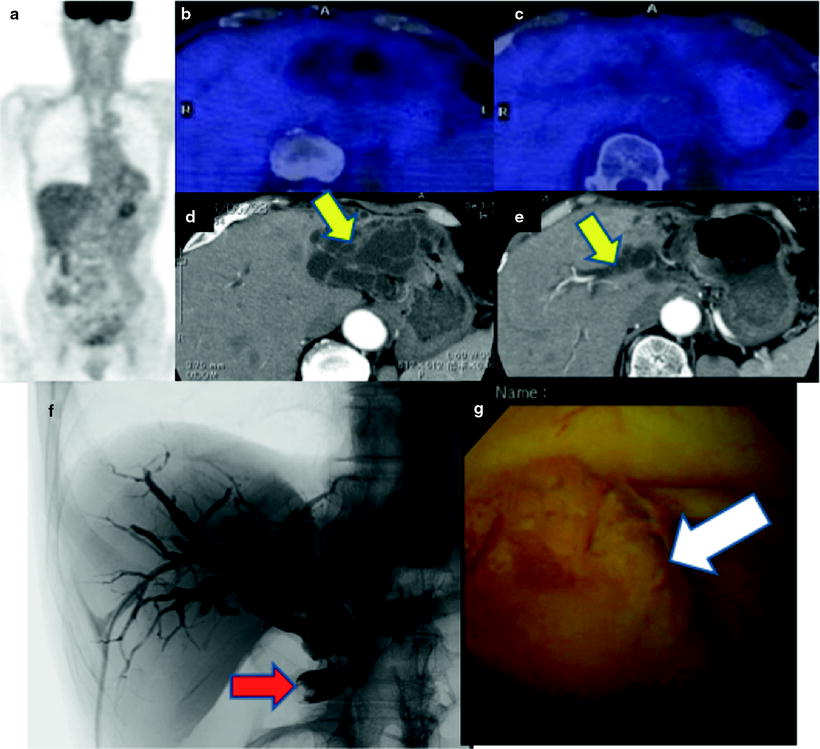
Table 16.3
AJCC anatomic stage and prognostic groups for extrahepatic biliary tumors
Group | T category | N category | M category |
|---|---|---|---|
Stage 0 | Tis | N0 | M0 |
Stage IA | T1 | N0 | M0 |
Stage IB | T2 | N0 | M0 |
Stage IIA | T3 | N0 | M0 |
Stage IIB | T1 | N1 | M0 |
T2 | N1 | M0 | |
T3 | N1 | M0 | |
Stage III | T4 | Any N | M0 |
Stage IV | Any T | Any N | M1 |
Fig. 16.10
Pretherapeutic extrahepatic bile duct (common bile duct) cancer. [18F]FDG abnormally accumulates in common bile duct (a–c; red arrows). And fusion image clearly discloses a local relationship between tumor and replaced drainage tube (c; white arrow). Cholangiography shows a filling defect on the dilated common bile duct (d; yellow arrow), and PTCS finding is mass-forming tumor (e; yellow arrow)
Fig. 16.11
Pretherapeutic Klatskin tumor. PET-CT does not show abnormal [18F]FDG accumulation (a, b). Contrast-enhanced CT and cholangiography shows multiple filling defects (c, d; yellow arrows) because of tumor in hilum. PTCS shows focal mucosal redness (e; white arrow). Biopsy specimen proved periductal-infiltrating-type adenocarcinoma
Fig. 16.12
Mucin-producing extrahepatic bile duct tumor. PET-CT does not show abnormal [18F]FDG accumulation (a–c). Contrast-enhanced CT shows bile duct dilatation in bilateral lobe (d, e, yellow arrows). Cholangiography shows extra- and intrahepatic biliary dilatation and filling defect at lower common bile duct (f; red arrow). PTCS shows focal mucosal redness (g; white arrow). Biopsy specimen proved papillary type, mucin-producing adenocarcinoma
It is important to distinguish biliary cancer, since IgG4-related disease is characterized by high serum IgG4 concentrations and sclerosing inflammation (involving the parotid gland, pancreas, bile duct, and so on) with numerous IgG4-positive plasma cells. These sclerosing inflammations can accumulate [18F]FDG, so differentiation from biliary cancer may be difficult using only PET image (Fig. 16.13).
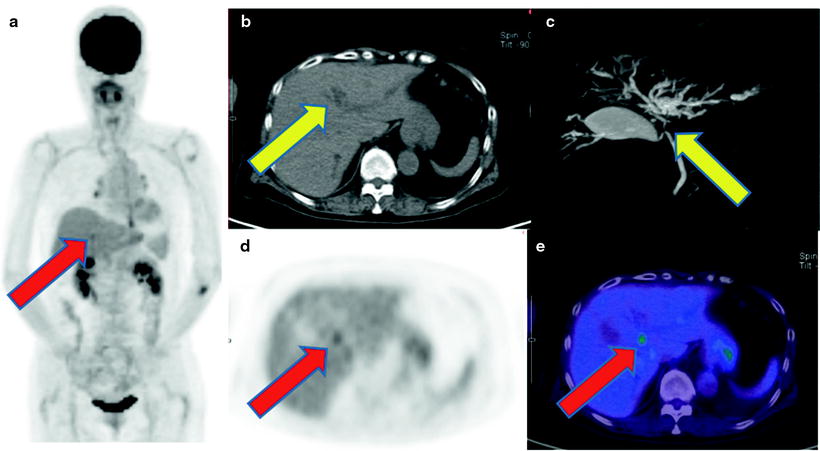
Fig. 16.13
IgG4-related sclerosing cholangitis. Non-contrast CT and MRCP show intrahepatic bile duct dilatation due to hepatic hilar severe stenosis (b, c; yellow arrows). [18F]FDG accumulates on the point of hepatic hilum (a, d, e; red arrows). But biopsy specimen proved no carcinoma cell but sclerosis cholangitis with plasmacyte and lymphocyte infiltration. His serum IgG4 level was so high that IgG4-related disease was confirmed
With similar reason, gallbladder carcinoma is usually [18F]FDG positive and PET shows high sensitivity. On the other hand, however, false-positive findings may often be seen in gallbladder lesions due to [18F]FDG uptake occurring in inflammation, particularly in patients with xanthogranulomatous cholecystitis [64], which may be difficult to distinguish from a neoplasm.
Recent progress in multislice CT and MRI may provide high spatial resolution and high-contrast bile duct images which may show similar or even higher diagnostic accuracy for detecting bile duct carcinoma than [18F]FDG-PET/CT. Kim et al. compared these modalities in 94 patients with bile duct carcinoma [57]. The sensitivity was 95% for [18F]FDG-PET and contrast-enhanced CT and 100% for MRI/MRCP. Thus, a high-resolution imaging study may be required for precise evaluation of the primary tumor lesions in addition to [18F]FDG-PET.
Accurate diagnosis of lymph node involvement is of clinical value for accurate staging in each patient. Again, [18F]FDG-PET may have limited value for this purpose due to limited spatial resolution. One of the major limitations is that lymph node involvement is mainly seen in the adjacent areas of the primary tumor, therefore making it rather difficult to separate the lymph node lesion, without the use of PET/CT from the primary lesion by relatively low-resolution PET. In addition, it is rather difficult to differentiate malignant invasion from the accompanied benign inflammatory lesions which is often seen in biliary tracts. On the other hand, [18F]FDG-PET has a high diagnostic value for detecting distant lymph node involvement [57]. The previous reports showed a wide range of sensitivity (12–50%), specificity (80–100%), and overall accuracy (69–77%) [46–60, 63, 65]. However, the relatively high specificity may prove the clinical value of [18F]FDG-PET for identifying distant nodal involvement in patient management. These results seem to be quite concordant to the finding of detection of lymph node involvement in many other malignant lesions.
Detection of Recurrence
Up to now, only complete resection is essential for curing biliary cancer. In cases of incomplete resection or recurrence, chemotherapy and/or radiation and palliative interventional radiology technique, such as stent replacement, are collaborated. Especially, only gemcitabine chloride has evidences to improve prognosis of biliary cancer patient. While response evaluation criteria in solid tumors (RECIST) is routinely adopted for cancer chemotherapy monitoring, we must notice that RECIST criteria are incomplete because this criteria is only judged by tumor size or diameter [66, 67]. Radical operation of biliary cancer is usually associated with broad resection like pancreatoduodenectomy, partial liver resection, and combined resection of portal vein. Therefore, it is very difficult to differentiate postoperative change with tumor recurrence on CT and MRI. CT and MRI imaging in combination with serum tumor markers, such as CA19-9, SPAN-1, and CEA, have been most commonly used for detection of tumor recurrence.
Generally, tumor morphological effect is preceded by metabolic effect, and therefore, [18F]FDG-PET and PET/CT can detect and monitor response earlier than CT and MR (Fig. 16.14). PET can visualize recurrent lesion at the choledochojejunostomized area and at the area where metallic device was replaced. In addition, PET is useful for detecting distant recurrence from the primary lesions by whole-body imaging and for accurate localization of the tumor recurrence when CT and MRI may not identify the specific lesion in cases with high tumor marker (Fig. 16.15). Previous reports showed high sensitivity (86–100%) and specificity (91–100%) for detection of tumor recurrence by PET and PET/CT. In addition, [18F]FDG PET/CT may improve both sensitivity and specificity from 82 and 43% to 94 and 100%, respectively [68–70].
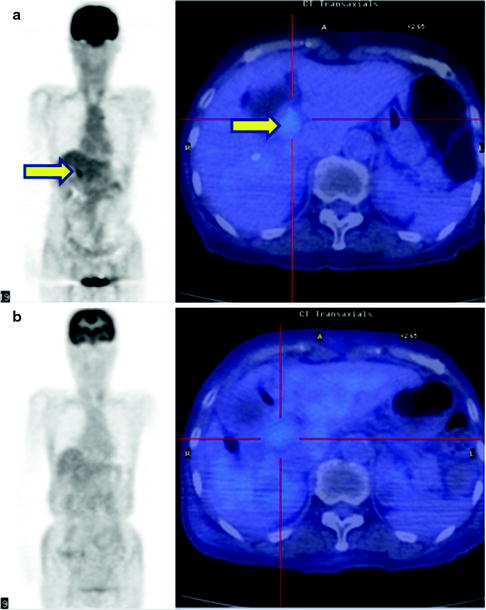
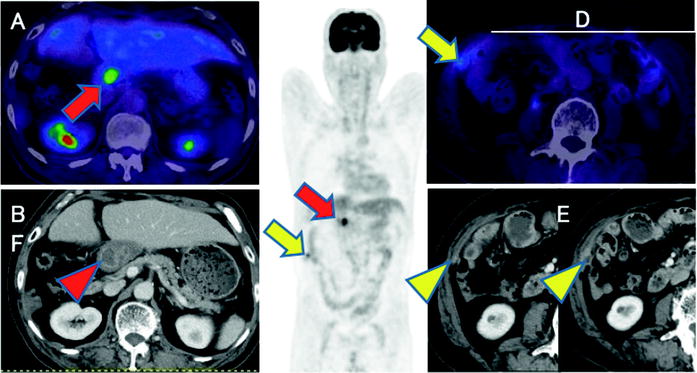
Fig. 16.14
Therapy monitor imaging of unresectable Klatskin tumor. [18F]FDG abnormally accumulates primary tumor at hepatic hilum (a, b; yellow arrows). After external radiation (44 Gy) and brachytherapy (12Gy) with concurrent hepatic arterial infusion (AI) together, [18F]FDG accumulation became indistinct
Fig. 16.15
Postoperative common bile duct cancer patient with CA19-9 elevation. Abnormal [18F]FDG accumulations are shown at hepatic hilum (a, c; red arrows) and intra-abdominal space (c, d; yellow arrows). So these are highly suspected recurrent lesions including local recurrence and peritoneal dissemination. Coincidently, contrast-enhanced CT shows choledochojejunostomized wall (b; red arrowhead) and peritoneal small and increasing enhanced nodule (e, f; yellow arrowheads). But it is difficult to differentiate anastomosis and recurrence
Our recent multicenter retrospective study in 50 patients with posttreatment surveillance of biliary cancer in Japan indicated that PET provided high sensitivity (86%), specificity (91%), and overall accuracy (88%) for detecting tumor recurrence in patient basis [71]. In addition, the PET findings resulted in a change in management of 10 of the 50 patients (20%) by initiating an unplanned treatment strategy (n = 7), by obviating the need for planned diagnostic procedures (n = 2), and by changing the treatment planning (n = 1) [71]. These multicenter studies confirmed the value of PET in patients with bile duct cancer after operation.
Risk Stratification
There are a number of established criteria for assessing prognosis of patients with bile duct cancer, including tumor histology and staging. Most of criteria may come from the findings during or after operation surgery. PET and PET/CT may have a potential for selecting high-risk patients on the basis of tissue characterization. Furukawa et al. studied 69 patients with bile duct cancer. These investigators found the [18F]FDG uptake as a significant prognostic indicator. Those with SUVmax of higher than 6.3 on [18F]FDG-PET were in the poor prognostic group with a 3-year survival rate of 44.1%, whereas those with SUVmax of 6.3 or less on [18F]FDG-PET were in the better prognostic group with a 3-year survival rate of 74.3% (P = 0.012) [60]. On the other hand, the multivariate analysis indicated that the N and M factors were the only significant prognostic indicators; however, [18F]FDG uptake may not be an independent prognostic indicator [60]. Kitamura et al. studied 73 patients with extrahepatic bile duct cancers to show SUVmax value of 5.7 as a significant cutoff point to differentiate poor prognosis from good prognosis subgroups [72] (Table 16.4). They showed [18F]FDG uptake value as an independent significant prognostic indicator on multivariate analysis. In the sub-study of 48 patients with operable case disease, lymph node involvement on [18F]FDG-PET findings was a significant prognostic indicator, in addition to the neurological and lymph node involvement on operative findings [72]. Seo et al. also studied the prognostic factors in 35 patients’ postoperative cases with mass-forming-type bile duct cancer. The results identified [18F]FDG uptake as the only independent prognostic indicator [65]. Most of these prognostic studies remain to be preliminary with limited numbers of patients demonstrating the potential value of [18F]FDG-PET/CT in patients with cancer of the biliary tract. Similarly with other oncological areas, more clinical experiences may provide a definite prognostic value of PET and PET/CT in combination with various clinical and pathological findings.
Table 16.4
AJCC anatomic stage and prognostic groups for extrahepatic bile duct cancer
Tx | Primary tumor cannot be assessed |
T0 | No evidence of primary tumor |
Tis | Carcinoma in situ |
T1 | Tumor confined to the bile duct histologically |
T2 | Tumor invades beyond the wall of the bile duct |
T3 | Tumor invades liver, pancreas, gallbladder |
T4 | Tumor invades duodenum, colon, stomach, abdominal wall |
Nx | Regional lymph nodes cannot be assessed |
N0 | No regional lymph node metastasis |
N1 | Regional lymph node metastasis |
Mx | Distant metastasis cannot be assessed |
M0 | No distant metastasis |
M1 | Distant metastasis |
Group | T category | N category | M category |
|---|---|---|---|
Stage 0 | Tis | N0 | M0
Related posts:Stay updated, free articles. Join our Telegram channel
Full access? Get Clinical Tree
 Get Clinical Tree app for offline access

|