, Pravin C. Singhal2 and Abdelhamid H. Elgazzar3
(1)
Department of Nuclear Medicine, Jacobi Medical Center, Bronx, NY, USA
(2)
Division of Kidney Diseases and Hypertension, Hofstra Norh Shore LIJ Medical School, Great Neck, NY, USA
(3)
Department of Nuclear Medicine, Faculty of Medicine, Kuwait University, Kuwait City, Kuwait
10.1 Introduction
10.2 General Physiology
10.2.1 The Nephron
10.2.2 Loop Diuretics
10.2.3 Renal Vasculature
10.2.4 Juxtaglomerular Apparatus
10.3 Renal Scintigraphy
10.3.1 Radiopharmaceuticals
10.3.2 Interpretation
10.4.1 Introduction
10.4.3 Effects of Angiotensin II
10.5.1 Introduction
10.5.3 Hydronephrosis
10.5.4 Diuretic Renography
10.6.1 Introduction
10.6.2 Surgical Complications
10.6.3 Medical Complications
10.7.1 Pathophysiology
10.7.2 Scintigraphy
10.8.1 Pathophysiology
10.8.2 Scintigraphy
10.9 Testicular Torsion
10.9.1 Pathophysiology
10.9.2 Diagnosis
10.9.3 Scrotal Imaging
10.9.4 Scintigraphy
10.1 Introduction
Scintigraphy has provided a unique tool for the noninvasive evaluation of renal pathophysiology, and the past two decades have witnessed a rapid increase in the scope and number of radionuclide renal studies. This chapter is intended to familiarize nuclear medicine physicians with the pathophysiological basis of renal scintigraphy. To this end, a general review of relevant renal physiology and scintigraphic techniques is followed by detailed discussions of specific disorders frequently encountered in nuclear medicine. These include renovascular hypertension, urinary tract obstruction, acute pyelonephritis, and renal transplant complications.
10.2 General Physiology
10.2.1 The Nephron
The principal functions of the kidneys are the maintenance of water, electrolyte, and acid-base balance, elimination of waste products, and regulation of blood pressure. The functional unit of the kidney is a nephron, which consists of a glomerulus and a tubule, and urine is formed as a result of glomerular filtration, tubular reabsorption, and tubular secretion [1].
The glomerulus consists of a network of capillaries derived from the afferent glomerular arteriole. The glomerular capillary tuft acts as a filter for plasma. It is encased by two epithelial layers, the inner layer becoming part of the outer capillary wall and the outer layer lining Bowman’s space (capsule), which receives the filtered fluid. The glomerular filtration rate (GFR) is dependent largely on the hydrostatic and colloid osmotic pressure in the glomerular capillaries and the hydrostatic pressure in Bowman’s space. Filtered fluid from Bowman’s space enters the tubule, which can be broadly divided into several portions: the proximal tubule, loop of Henle, distal tubule, collecting tubule, and collecting duct system (Fig. 10.1).
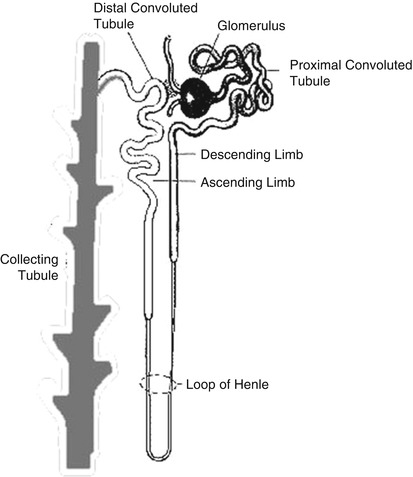
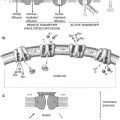
The proximal tubule plays a key role in reabsorbing filtered solutes. About half to two thirds of the sodium, chloride, and potassium are reabsorbed in this segment. Reabsorption of solutes is accompanied by passive osmotic diffusion of water.
The loop of Henle, consisting of a descending limb and an ascending limb, is the site of reabsorption of about 25 % of the filtered solutes. Reabsorption occurs primarily in the “thick” ascending limb, where the epithelial cells are thick and metabolically very active. It is in this section that “loop” diuretics such as furosemide exert their effects (see later). The reabsorbed solutes enter the medullary interstitium and contribute to its hypertonicity.
The distal tubule transports sodium, chloride, and potassium, but not water, from its proximal part, similar to the loop of Henle. The terminal distal tubule shares similar functions with the collecting tubules (see later). At the very beginning of the distal tubule is the macula densa, a region of specialized cells in close proximity to the juxtaglomerular (JG) cells in the afferent arteriole that store renin. In response to changes in sodium and chloride concentration in this portion of the tubule, the macula densa sends signals to the JG cells to release renin.
The collecting tubule and terminal distal tubule are under the influence of aldosterone and antidiuretic hormone (ADH). Aldosterone, released from the zona glomerulosa of the adrenal cortex in response to angiotensin II, increases potassium secretion and sodium reabsorption. The latter promotes water reabsorption by osmosis and raises blood volume. ADH, originating in the hypothalamus and posterior pituitary and released in response to a rise in osmotic pressure of extracellular fluids or low blood pressure, increases the permeability of the cortical collecting ducts to water, which helps to maintain body fluid osmolality and effective plasma volume and to form concentrated urine. A hyperosmotic medullary interstitium, primarily the result of reabsorption of solutes from the thick ascending limb of the loop of Henle, also contributes to the reabsorption of fluid and the formation of concentrated urine.
10.2.2 Loop Diuretics
Furosemide, used for the scintigraphic evaluation of urinary tract obstruction, and other loop diuretics block the reabsorption of sodium, chloride, and potassium in the thick ascending limb of the loop of Henle. Increased tubular sodium decreases water reabsorption by an osmotic effect. Additionally, decreased sodium reabsorption into the medullary interstitium reduces its osmolarity, which in turn reduces water reabsorption from the collecting tubules.
10.2.3 Renal Vasculature
The renal artery enters through the hilum of the kidney and branches successively into the interlobar arteries, arcuate arteries, interlobular arteries, and afferent arterioles. Each afferent arteriole eventually branches into the glomerular capillaries. The distal glomerular capillaries merge to form the efferent arteriole. Efferent arterioles subdivide to form peritubular capillaries in the cortex or the vasa recta in the medulla. As discussed later, changes in the afferent or efferent arteriolar tone play an important role in regulating the GFR.
10.2.4 Juxtaglomerular Apparatus
The afferent arteriole has specialized smooth muscle cells called juxtaglomerular (JG) cells that store renin and stretch receptors that respond to changes in arteriolar pressure. Renin is released as a result of decreased stretch of the arteriolar wall when arteriolar pressure is decreased. Another stimulus for renin comes from the macula densa, which consists of specialized cells in the first part of the distal tubule, and is located close to the JG cells. The macula densa signals the JG cells to release renin when the sodium and chloride content of this part of the tubule is low. Finally, the sympathetic nervous system can stimulate renin release in response to systemic baroreceptor stimuli. These mechanisms are discussed further under Sect. 10.4.
10.3 Renal Scintigraphy
10.3.1 Radiopharmaceuticals
Based on kinetics, renal radiopharmaceuticals can be divided into two broad classes—those that are excreted rapidly into the urine and those that are retained for prolonged periods in the renal parenchyma. In the first category are 99mTc-mercaptoacetyltriglycine (MAG3), 99mTc-diethylenetriamine pentaacetic acid (DTPA), and 131I-orthoiodohippurate (OIH) and, in the second category, 99mTc-dimercaptosuccinic acid (DMSA) and 99mTc-glucoheptonate.
10.3.1.1 Rapidly Excreted Radiopharmaceuticals
The rapidly excreted radiopharmaceuticals are used to assess individual renal function [2–5]. 99mTc-MAG3, the agent of choice, is 90 % protein bound and excreted almost exclusively by the renal tubules. High renal-to-background count ratios provide excellent images and permit visualization of poorly functioning kidneys that may not be adequately visualized by 99mTc-DTPA or 131I-OIH. The renal extraction fraction for MAG3 (about 70 %) is lower than that for OIH (80–90 %). Although this characteristic is not ideal for precise quantification of renal blood flow, reasonable estimates can be made with the use of correction factors.
99mTc-DTPA was the most popular radiopharmaceutical in its category prior to the introduction of 99mTc-MAG3. It shows little protein binding (about 5 %) and is excreted exclusively by glomerular filtration. Renal uptake of 99mTc-DTPA is limited because only 20 % of the renal blood flow is filtered by the glomeruli. The 20 % extraction fraction is considerably lower than that of 99mTc-MAG3 and yields lower renal-to-background uptake ratios. However, 99mTc-DTPA is less costly and may be used as an alternative to 99mTc-MAG3, particularly if a quantitative estimate of GFR is also needed. Functional assessment with 99mTc-MAG3 and 99mTc-DTPA generally is concordant. However, differences may be noted with glomerular-tubular dissociation in some cases of tubulointerstitial disease.
Orthoiodohippurate is about 70 % protein bound. Approximately 15–20 % of the radiotracer is excreted by glomerular filtration and the remainder by tubular secretion. The use of 131I-OIH for scintigraphy has been largely abandoned because of the limitations of a higher radiation exposure [6] and poor image quality related to a lower administered dose (1/15 that of 99mTc-MAG3). Radiation exposure with 123I-labeled OIH is lower, and better images can be obtained using larger amounts of radiotracer. However, this radiopharmaceutical is expensive and not readily available. The extraction fraction of OIH, while not optimum (since it is not completely extracted by the kidneys), is the highest among the radiopharmaceuticals in use today. Therefore, it can be used for the quantification of renal blood flow.
10.3.1.2 Slowly Excreted Radiopharmaceuticals
Prolonged cortical retention of the slowly excreted radiopharmaceuticals allows the assessment of parenchymal morphology, and since accumulation occurs only in functioning tubules, uptake can be quantified to assess differential renal function [2, 3]. Technetium-99m-DMSA, the preferred agent, is 90 % protein bound and accumulates in functioning tubules. Since very little of the radiotracer is excreted, interference from collecting system activity, particularly on delayed images, is minimal. A total of about 40 % of the administered amount is accumulated in the renal cortex versus about 20 % for Tc-99m glucoheptonate. Additionally, significant amounts of 99mTc-glucoheptonate are excreted by glomerular filtration, resulting in interfering activity in the collecting system.
10.3.2 Interpretation
10.3.2.1 Rapidly Excreted Radiopharmaceuticals
Renal scintigraphy using the rapidly excreted radiopharmaceuticals generally involves dynamic acquisition over a period of approximately 30 min after radiotracer administration. Images are usually grouped in 2-min frames and a time-activity histogram is obtained. Assessment of function is based on a number of criteria, including initial cortical uptake of the radiotracer, cortical retention, first visualization of the collecting system, and time to peak cortical activity. It is cautioned, however, that these parameters also may be affected by the state of hydration. An adequate assessment should include analysis of both the images and the time-activity curves.
Cortical Uptake
The first minute after radiotracer administration represents the vascular delivery phase. The next 2 min constitutes the “parenchymal phase.” Uptake in the kidney during this interval, i.e., between 1 and 3 min after radiotracer injection, is proportional to its function, using either tubular or glomerular agents. In practice, renal counts are obtained over a 1-min period, typically between 1 and 2 min for 99mTc-MAG3, and expressed as a percentage of the combined renal counts.
Cortical Retention
The cortical retention of radiotracer, quantified by expressing renal counts at 20–30 min on the time-activity curve as a percentage of the peak uptake, is a measure of the rapidity with which the radiotracer is excreted by the kidney. As renal function deteriorates, the percentage retained increases. An apparent increase in retention may occur with urine stasis in the collecting system, hence the need for evaluating the time-activity curve in conjunction with the images.
First Visualization of Collecting System
The interval between radiotracer administration and excretion of activity into the collecting system, i.e., the pelvis and/or calyces, is a measure of cortical function. This interval, needless to say, is obtained from the sequential images. Delayed appearance of the collecting system is associated with renal insufficiency.
Time to Peak
The interval between radiotracer administration and maximum cortical activity is another parameter of function. It is more easily measured from the time-activity curve, although an accurate estimate may not be possible in the absence of a peak, which is often the case in significant renal dysfunction.
A 1-min dynamic flow study, with images grouped in 3-s frames, is frequently combined with the functional evaluation. These images reflect renal perfusion and generally are concordant with the functional study. Sophisticated quantitative techniques have been developed to quantify perfusion [7]. These may have a potential role, particularly for the transplanted kidney, but are not widely used.
10.3.2.2 Slowly Excreted Radiopharmaceuticals
Scintigraphy with 99mTc-DMSA and 99mTc-glucoheptonate is done between 4 and 24 h after radiotracer administration. It is usually used to detect renal parenchymal defects such as pyelonephritis, scars, and infarcts. Since only functioning tubular cells accumulate these radiopharmaceuticals, the total renal uptake is a measure of individual renal function. Thus, relative renal function can be measured as with the rapidly excreted radiopharmaceuticals.
10.4 Renovascular Hypertension
10.4.1 Introduction
The teleological function of the renin-angiotensin system, i.e., maintenance of systemic blood pressure, is well served in such conditions as hypotension and shock. In significant renal artery stenosis, however, activation of the renin-angiotensin system is a mixed blessing, limiting a fall in GFR but causing systemic (renovascular) hypertension. Systemic blood pressure is maintained primarily by increase in vascular tone and retention of sodium and water, while a sharp reduction in GFR is prevented by increase in the glomerular capillary hydrostatic pressure.
Glomerular capillary hydrostatic pressure is modulated by the tone of the afferent and efferent glomerular arterioles. Increased tone in the efferent arteriole or decreased tone (increased flow) in the afferent arteriole raises capillary hydrostatic pressure and GFR, while decreased tone in the efferent arteriole or increased tone (decreased flow) in the afferent arteriole lowers GFR.
10.4.2 Activation of Renin-Angiotensin System
The first step in the activation of the renin-angiotensin system is the release of renin by the renal JG cells. The following mechanisms are involved [8, 9]:
1.
Signals from baroreceptors (“stretch” receptors) in the afferent arteriole, stemming from decreased arteriolar pressure due to systemic hypotension/decreased effective blood volume or significant renal artery stenosis. Baroreceptor signals are modulated by prostaglandins.
2.
Chemoreceptor signals from the macula densa (located in the initial portion of the distal tubule) related to decreased sodium and chloride in the distal tubule (reduction in GFR leads to slower flow and greater reabsorption of sodium and chloride in the loop of Henle). Macula densa signals are modulated by prostaglandins and adenosine.
3.
Increased sympathetic activity due to activation of systemic cardiopulmonary and carotid sinus baroreceptors by hypotension. The renal baroreceptor signals are modulated by prostaglandins and the macula densa signals by adenosine and prostaglandins.
Renin released as a result of the above stimuli converts circulating angiotensinogen, an alpha2 globulin produced by the liver, to angiotensin I, a decapeptide. Angiotensin I is then converted to the active octapeptide form, angiotensin II, by angiotensin-converting enzyme (ACE), found in vascular endothelium, and the bulk of this conversion occurs in the pulmonary vascular bed. Angiotensin II is also produced in the kidney.
10.4.3 Effects of Angiotensin II
10.4.3.1 Systemic Effects
Angiotensin II raises systemic blood pressure primarily by increasing vascular tone and stimulating the synthesis and secretion of aldosterone from the zona glomerulosa of the adrenal cortex, which promotes sodium and water reabsorption from the renal tubules.
10.4.3.2 Intrarenal Effects
The intrarenal effects of angiotensin II help counter a fall in GFR due to decreased afferent arteriolar and glomerular capillary hydrostatic pressure [8, 9]. First, angiotensin II raises GFR by preferential constriction of the efferent glomerular arteriole. Second, angiotensin II increases tubular reabsorption of sodium and water directly and indirectly (increased tone in efferent arteriole decreases hydrostatic pressure in peritubular capillaries with resultant increase in sodium and water reabsorption). In unilateral renal artery stenosis, GFR remains unchanged in the contralateral normal kidney, because increased efferent arteriolar tone is offset by an increase in afferent arteriolar tone in response to a higher systemic blood pressure.
The effects of angiotensin II eventually lead to inhibition of renin release. In unilateral renovascular disease, sodium retention is offset by pressure natriuresis (decreased sodium chloride reabsorption in the proximal tubule) by the normal kidney. This limits the expansion in blood volume, so that pressure in the afferent arteriole of the stenotic kidney continues to be low. In bilateral renovascular disease, however, blood volume expansion may be sufficient to increase afferent arteriolar pressure and decrease (but not necessarily normalize) renin secretion. Angiotensin II also has a direct inhibitory effect on the JG cells.
10.4.4 Scintigraphy in Renovascular Hypertension
10.4.4.1 Principles
The scintirenographic diagnosis of renovascular hypertension is based on the demonstration of changes in renal physiology following the administration of an ACE inhibitor [10–16]. As noted above, angiotensin II, formed by the activation of the renin-angiotensin system, helps maintain GFR by increasing the tone of the efferent glomerular arteriole which, in turn, raises the glomerular capillary hydrostatic pressure. These changes are reversed by ACE inhibitors, which block the conversion of angiotensin I to angiotensin II. Consequently, there is a sharp drop in GFR and in proximal tubular urine flow.
Decreased GFR and tubular flow after the administration of an ACE inhibitor will result in decreased uptake and prolonged cortical retention of 99mTc-DTPA, a radiopharmaceutical excreted by glomerular filtration. Since renal blood flow generally is not significantly changed, a blood flow agent such as 99mTc-MAG3 shows only prolonged cortical retention without decreased uptake. Rarely, uptake of 99mTc-MAG3 may actually decrease, presumably due to a fall in blood pressure below a critical level required to maintain perfusion in the stenotic kidney. The general principles of ACE inhibitor renography also apply to patients receiving chronic treatment with angiotensin II (AT1) receptor antagonists [17].
10.4.4.2 Interpretation
Scintigraphic studies are generally interpreted by comparing a baseline examination with one performed after the administration of ACE inhibitor. Both the images and the time-activity curves are evaluated using the traditional parameters of function discussed earlier, and the following changes after ACE inhibition are considered significant for renovascular hypertension [14, 15]:
1.
Increase in cortical retention by at least 15 %
2.
Delay in collecting system visualization by at least 2 min
3.
Decrease in initial cortical uptake by at least 10 %
4.
Increase in time to peak by at least 2 min
10.4.4.3 Factors Influencing ACE Inhibitor Scintigraphy
Because of the complexity of the renin-angiotensin system, ACE inhibitor renography is subject to a number of variables that may result in false-positive or false-negative studies.
1.
Hypotension or a marked change in blood pressure after ACE inhibitor administration is often associated with bilateral symmetrical renal retention of radiotracer. Presumably, this is related to compensatory mechanisms triggered by hypotension that promote fluid reabsorption from the tubules and reduce urine flow. This finding should not be mistaken for bilateral renal artery stenosis, which characteristically responds asymmetrically to ACE inhibition.
2.
Diuretics may cause dehydration, with resultant decrease in tubular flow and increase in cortical radiotracer retention [18]. Here again, the abnormality is symmetrical. Diuretics also increase the likelihood of hypotension after ACE inhibition. Therefore, adequate hydration is particularly important for patients receiving diuretic treatment.
3.
Chronic ACE inhibitor therapy potentially may lower scintigraphic sensitivity and should be discontinued before the test. Alternatively, if the ACE inhibitor cannot be discontinued, scintigraphy may be performed while the patient is on therapy. If renal function appears symmetrical, renovascular hypertension is unlikely and a baseline study need not be done. However, if function is asymmetrical, the ACE inhibitor should be discontinued before the baseline study.
4.
Aspirin and such other nonsteroidal anti-inflammatory agents as indomethacin may decrease the sensitivity of the test. As described earlier, renin release by the juxtaglomerular apparatus in response to baroreceptor and chemoreceptor stimuli is mediated by prostaglandins. Aspirin and indomethacin decrease prostaglandin activity and therefore indirectly decrease renin-angiotensin activity. Consequently, their effect on scintigraphy is the same as that of chronic ACE inhibitor therapy. It is interesting that a single dose of aspirin may cause scintigraphic changes in a stenotic kidney, not unlike those seen after captopril [19].
5.
Calcium channel blocking drugs are commonly used in renovascular hypertension. Although their effect on GFR is not as pronounced as that of ACE inhibitors, these drugs have been implicated as a cause of false-positive studies [20, 21]. The mechanisms responsible for this finding are not entirely clear. It appears that the effect of angiotensin II on efferent arteriolar constriction requires the presence of extracellular calcium and therefore can be attenuated by calcium channel blockers. Perhaps a marked decrease in GFR resulting from the combined effect of both calcium channel blockers and captopril may explain the above findings.
10.4.4.4 Relationship of Renal Artery Stenosis to Renovascular Hypertension
Approximately 3 % of hypertension is renovascular in origin. The incidence is higher in a selected hypertensive population and may be as high as 30–40 %. Renal artery stenosis generally is due to atherosclerotic plaques or fibromuscular dysplasia, the latter occurring in younger individuals. “Significant” stenosis, i.e., one that would trigger the activation of the renin-angiotensin system and lead to the development of renovascular hypertension, has been defined as a reduction in intraluminal diameter by 50 % or greater. However, the degree of anatomically defined renal artery stenosis does not always correlate with the presence of renovascular hypertension.
In an autopsy study, 17 % of individuals who had been normotensive had ≥50 % renal artery stenosis [22]. In another study, half of the patients undergoing aortography for reasons other than hypertension had ≥50 % stenosis [23]. Thus, the characterization of “significant stenosis” by anatomical criteria remains uncertain.
Ideally, a test for the diagnosis of renovascular hypertension should allow the prediction of therapeutic outcome. In other words, those with positive studies should derive benefit from revascularization and vice versa. Follow-up studies after ACE inhibitor renography have indeed shown good correlation with outcome after angioplasty, though additional prospective studies are clearly needed for corroboration [24–27]. The emergence of high-resolution, noninvasive imaging techniques, notably contrast-enhanced magnetic resonance angiography, has considerably improved our ability to detect renal artery stenosis [28–33]. However, additional studies are needed to define their place in the diagnostic algorithm.
10.5 Urinary Tract Obstruction
10.5.1 Introduction
Urinary tract obstruction may be complete or partial, and it may occur at various locations including the ureteropelvic junction (UPJ), ureterovesical junction (UVJ), and bladder outlet. The clinical consequences are quite dramatic and predictable in an acute and complete obstruction, but not in a partial and chronic one, exemplified by UPJ obstruction in children. Chronic UPJ obstruction, however, may eventually lead to renal cortical atrophy. Hence diagnostic markers are needed to identify those patients at risk of progressive renal insufficiency.
Despite a large body of literature on the diagnostic evaluation of urinary tract obstruction, the identification of “significant obstruction,” i.e., one that would result in progressive renal failure, remains somewhat elusive. This is because significant obstruction is probably much more a functional entity than an anatomical one, and left untreated, similar types of obstruction may have markedly dissimilar outcomes. This section is devoted primarily to chronic (partial) UPJ obstruction in infants and young children, an entity frequently encountered by the nuclear medicine physician, and its relationship to hydronephrosis and renal function.
10.5.2 Ureteropelvic Junction Obstruction
UPJ obstruction may be extrinsic or intrinsic, and both conditions may exist in the same patient. Extrinsic obstruction is usually caused by adventitial bands compressing the upper ureter. Typically, this type of obstruction is intermittent and brought on by increased diuresis, which dilates the pelvis and increases the constrictive pressure of the adventitial bands. As might be expected, pressure-flow studies of the renal pelvis are not linear in this condition. More importantly, the diuretic renogram may be negative if adequate diuresis, i.e., adequate dilatation of the pelvis, is not achieved because of dehydration, inadequate diuretic dosage, or renal dysfunction.
Intrinsic obstruction may be related to luminal narrowing of a segment of the upper ureter or to an adynamic segment. This type of obstruction generally exhibits a linear pressure-flow relationship, and although considered “fixed,” the obstruction is not necessarily permanent and does not invariably cause progressive renal deterioration.
10.5.3 Hydronephrosis
Hydronephrosis may be due to obstruction or to such nonobstructive conditions as vesicoureteral reflux, congenital dysmorphism, and urinary tract infection. It may be temporary with spontaneous resolution in infants and young children, or intermittent, or progressive with eventual stabilization. Such variability is related to the multifactorial etiology of hydronephrosis [34–36]. These factors include the following:
1.
Compliance and capacity of the renal pelvis, which determine intrapelvic pressure
2.
Renal function, which determines the rate of urine flow
3.
Degree of obstruction
Progression or stabilization of hydronephrosis depends on the degree of balance between these factors. Pressure in the renal pelvis, though not measurable by diuretic renography, is a critical component in the pathogenesis of hydronephrosis and renal dysfunction. Pressure-flow studies suggest that the pelvis fills at low pressures initially until a critical volume (“capacity”) is reached, above which the pelvic pressure rises. Subsequent development of hydronephrosis tends to relieve pelvic pressure. A low-capacity pelvis is more likely to have higher pelvic pressures with progressive hydronephrosis. In this instance, cortical atrophy eventually occurs, with decrease in urine formation and reduction of pelvic pressure.
10.5.4 Diuretic Renography
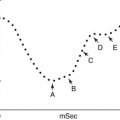
Diuretic renography [35–39] is based on the premise that increased urine flow resulting after furosemide administration causes rapid “washout” of radiotracer from the unobstructed collecting system (Fig. 10.2), but delayed washout if obstruction is present (Fig. 10.3). While furosemide generally is administered intravenously after filling of the pelvicalyceal system, administration at the time of or prior to radiotracer administration also has been advocated. The washout half-time following diuretic injection is determined from the time-activity curve. A half-time of 10 min or less is considered normal, 10–20 min equivocal, and more than 20 min abnormal. However, over-reliance on the washout half-time may not be justified because a number of factors may influence the diuretic renogram.
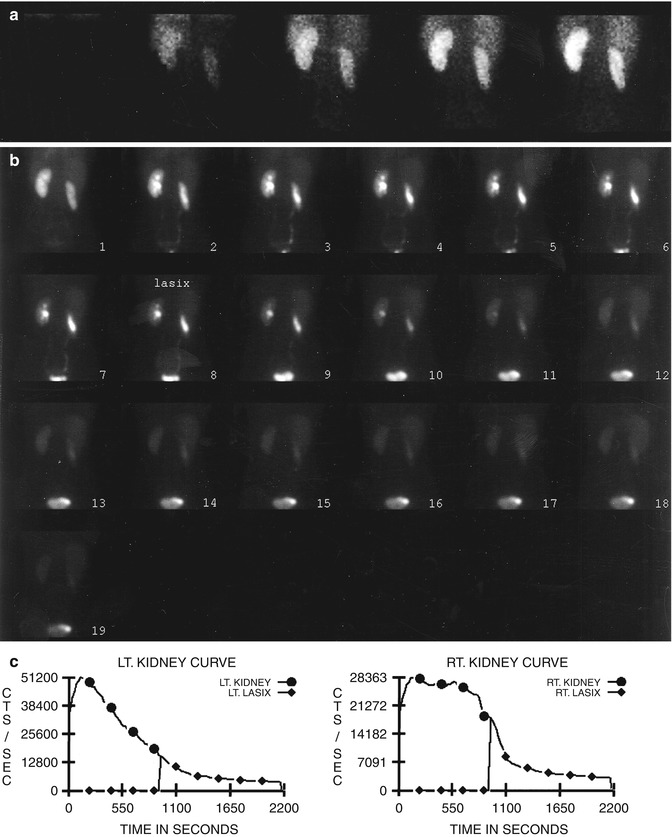
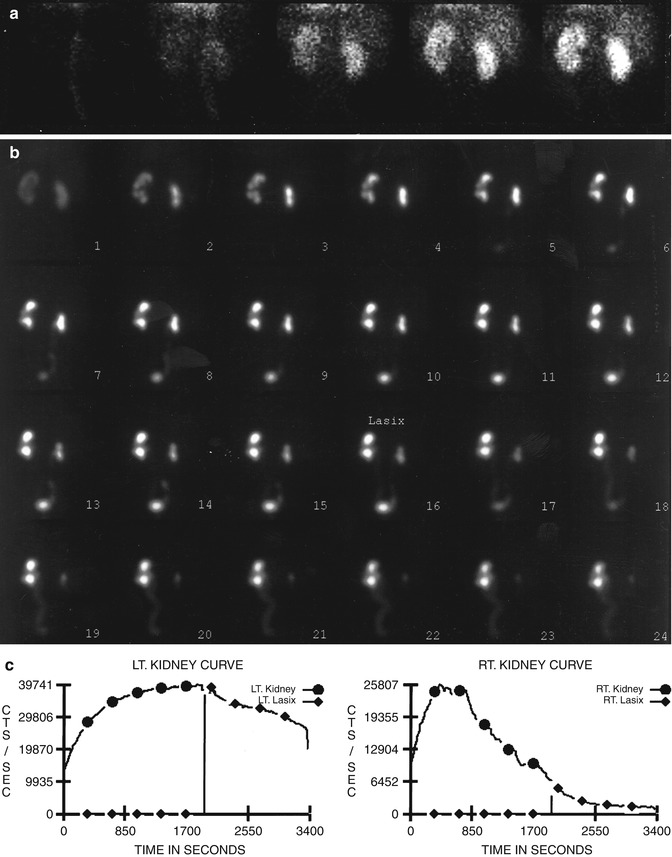
Fig. 10.2
Nonobstructive hydronephrosis: flow (a) and sequential (b) images and renogram (c) of a 14-year-old girl with right hydronephrosis (sonogram). Rapid washout of right renal collecting system following administration of Lasix (furosemide), with washout T1/2 of 3 min
Fig. 10.3


Left hydronephrosis in an 8-month-old boy, first detected in the womb. Renal images with MAG3 flow (a) and sequential (b) 2 min/frame show obstruction of hydronephrotic left kidney, with washout T1/2 of 47 min after Lasix administration (c)
Related posts:
Stay updated, free articles. Join our Telegram channel
Full access? Get Clinical Tree
