Fig. 17.1
Forty-five-year-old woman with incidental finding of a duodenal diverticulum next to the left adrenal gland. (a) Axial CECT image shows that the diverticulum is mostly decompressed, with only a trace of hyperdense oral contrast within it (white arrow). (b) Follow-up axial CECT image shows that the diverticulum is distended by food and fluid (white arrow). The neck of the diverticulum is clearly seen communicating with the stomach (arrowheads)
17.2.2 Adrenal Adenoma CT Pitfalls
Adrenal adenomas are common incidental findings, occurring in 5–7% of elderly patients (Glazer et al. 1982; Song et al. 2008). On contrast-enhanced CT (CECT), there are overlapping imaging appearances between adrenal adenomas, metastases, and early primary adrenal malignancies; this is a frequent diagnostic dilemma when found incidentally (Boland et al. 1998; Johnson et al. 2009). Lee et al. (1991) were first to describe the finding of decreased density on non-enhanced CT (NECT) (densitometry) for the diagnosis of adenoma. Initial threshold levels of 0 Hounsfield Unit (HU) yielded specificity of 100% but an unacceptably low sensitivity of only 47 % for the diagnosis of adenoma. Subsequently a higher threshold of 10 HU was identified through meta-analysis with sensitivity of 71% while maintaining a high specificity of 98 % (Boland et al. 1998). It is important to place the region-of-interest (ROI) measurement tools over one half to two thirds of the center of the lesion in order to reduce measurement error. Placing a smaller ROI measurement can selectively underestimate the true density of a lesion. Placing the ROI measurement at the periphery of a lesion can result in decreased measurements due to averaging with retroperitoneal fat (Taffel et al. 2012) (Fig. 17.2a–e).
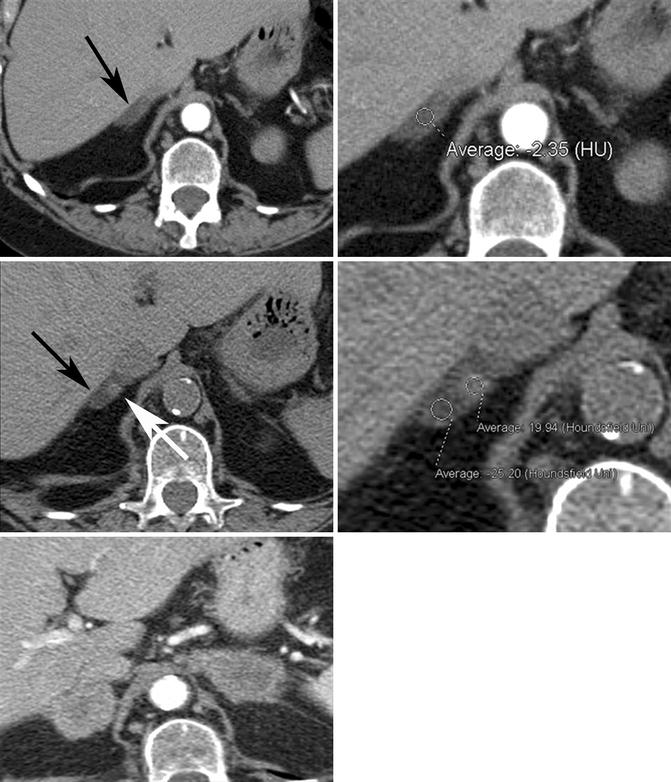
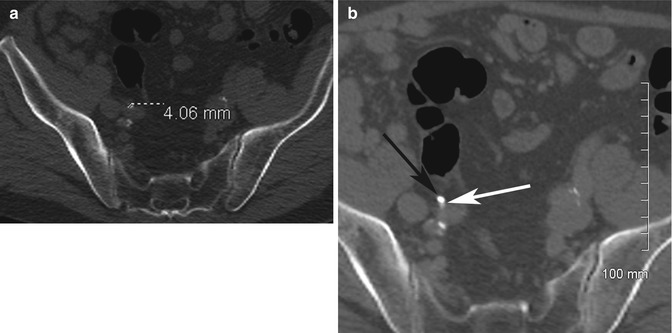
Fig. 17.2
Seventy-eight-year-old woman with adrenal collision tumor; adrenal metastasis arising in a gland with a preexisting adenoma. (Top row) Baseline axial CECT images taken at time of diagnosis show a large right upper lobe non-small cell carcinoma (not shown) and a right adrenal nodule with homogeneous low density (black arrow) measuring −2 HU, diagnostic of adrenal adenoma. (Middle row) Follow-up axial NECT images performed 6 months later show a minute focus of increased density (white arrow) that has subsequently developed within the right adrenal gland (black arrow) which measures 20 HU in density. The remainder of the adrenal gland continues to show imaging characteristics and density values in keeping with adenoma. (Bottom image) Follow-up axial CECT image performed 5 months later shows bilateral enhancing adrenal masses in keeping with metastases. Heterogeneous low density with NECT or loss of signal intensity on CSI in a patient with underlying primary malignancy should alert the radiologist to the diagnosis of adrenal collision tumor
17.2.3 Adrenal Adenoma MRI Pitfalls
Mitchell et al. (1992) were the first to describe a loss of signal intensity with in- and opposed-phase or chemical shift gradient-echo imaging (CSI) for the diagnosis of adenoma. CSI is based on the principle that resonance frequencies of protons in water and lipid differ due to shielding effects from –CH2 groups within lipid molecules. The difference in precessional frequency can be exploited during gradient-echo imaging by selecting echo times (TE) where lipid and water protons will be in and out of phase with respect to each other. The chemical shift between water and lipid protons is 3.5 ppm (independent of field strength). This corresponds to a frequency shift of 220 Hz at 1.5 T and 440 Hz at 3 T. When lipid and water protons are in the same voxel but opposed (out of phase), there is signal cancellation in that voxel. The exact echo time for in- and opposed-phase CSI is dependent on field strength, with lipid and water protons becoming out of phase with each other once every 2.2 ms or 1.1 ms at 1.5 T and 3 T, respectively (Siegelman 2012).
Pitfall: When assessing adrenal lesions for lipid content, the first out–of–phase echo should be sampled. If the second out–of–phase echo is sampled and compared to the shorter in-phase echo, then loss of signal on the out–of–phase images could be due to either lipid content or susceptibility (T2*) effects from calcification or hemosiderin (Siegelman 2012) (Fig. 17.3a, b). This is relatively straightforward at 1.5 T as current MRI systems are capable of performing dual-echo gradient-echo imaging during a single breath-hold with TE values of 2.2 and 4.4 ms. This requirement becomes more problematic at 3 T when sampling the first out-of-phase echo at 1.1 ms during the same breath-hold as the in-phase echo at 2.2 ms. Some vendors using older generation 3 T systems recommended sampling the first in-phase echo at 2.2 ms and the second out-of-phase echo at 3.3 ms. This strategy is suboptimal and can lead to the incorrect characterization of adrenal lesions, as described above.
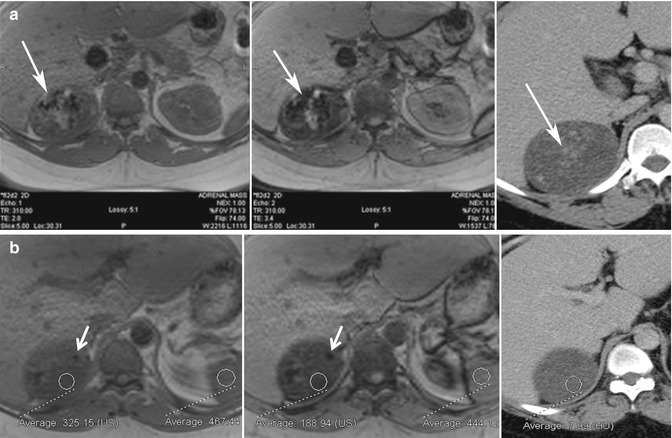
Fig. 17.3
Thirty-four-year-old man with proven adrenal cortical carcinoma following resection. (a) Axial in-phase (TE = 2.0 ms) and opposed-phase (TE = 3.4 ms) gradient-echo (GRE) MR images show the potential pitfall of chemical shift imaging at 3 T. When the opposed-phase image is compared to the in-phase image, there is a large area of decreased signal intensity (white arrow) related to calcifications within the tumor from T2* effects, which is confirmed in the axial CECT image. Another focus of calcification is noted in a separate portion of the mass (white arrow) with blooming artifact from T2* effects. When opposed-phase images are performed at a longer TE, drop in signal can be related to lipid or susceptibility artifact. (b) Other areas within the mass (ROI) show drop of signal intensity on the opposed-phase MR image and corresponding low density on CT (<10 HU) and represent areas of intracytoplasmic lipid. This can be diagnosed by visually assessing the signal intensity difference between the in- and opposed-phase MR images or by calculation of the adrenal index or adrenal-to-spleen signal intensity ratio. This illustrates an important imaging pitfall in adrenal imaging. Not all adrenal lesions that contain lipid are adenomas. Size, heterogeneity, and presence of calcification indicate that the adrenal mass in this patient is unlikely to represent adenoma, and diagnosis of adrenal cortical carcinoma was prospectively suggested at the time of diagnosis
The diagnosis of adrenal adenoma with CSI can be performed qualitatively by visually inspecting for a drop of single on opposed-phase images or by use of subtraction imaging (Siegelman 2012). Quantitative analysis can also be performed by calculating the chemical shift index ([signal intensity of lesion on in phase – signal intensity of lesion on opposed phase/signal intensity of lesion on in phase] × 100 %) or the adrenal-to-spleen chemical shift ratio ([signal intensity of lesion on opposed phase/signal intensity of spleen on opposed phase]/[signal intensity of lesion on in phase/signal intensity of spleen on in phase]), with respective values of >16.5 % and <0.71 being diagnostic of adenoma (Taffel et al. 2012). With CSI, the sensitivity and specificity for the diagnosis of adenoma range from 81–100 % to 94–100 %, respectively (Taffel et al. 2012).
Approximately 70 % of adrenal adenomas have sufficient intracytoplasmic fat content to be reliably diagnosed using either NECT or CSI. Conversely, 30 % of adrenal adenomas do not have high enough concentrations of lipid to be reliably diagnosed by either NECT or CSI and are referred to as “lipid-poor adenomas” (Boland et al. 1998). Both NECT and CSI exploit the same property of intracytoplasmic fat for diagnosis; therefore, CSI should offer no advantage in the diagnosis of adenomas that do not measure less than 10 HU in density on NECT (Boland et al. 1998). There is a slightly increased rate of diagnosis of adenoma with CSI compared to NECT (Haider et al. 2004), although for adrenal lesions that measure >25–30 HU on NECT, CSI is unlikely to be able to detect sufficient amounts of intracytoplasmic fat to diagnose an adenoma (Taffel et al. 2012). For adrenal lesions that are “lipid poor,” adrenal washout CT can reliably differentiate adenomas from other lesions by enhancement patterns.
Pitfall: Not all adenomas will not show signal drop on opposed–phase CSI. In patients with adrenal lesions that do not show signal loss on CSI, adrenal washout CT should be performed for further characterization (Boland et al. 1998). Studies have validated adrenal washout CT as an accurate imaging test for the diagnosis of both “lipid-rich” (those with sufficient lipid for diagnosis with NECT or CSI) and “lipid-poor” adenomas, with both types of adenoma having similar enhancement patterns (Taffel et al. 2012). Benign adenomas washout or de-enhance faster than malignant adrenal lesions, presumably related to the disorganized angiogenesis in malignancy which leads to prolonged contrast accumulation (Taffel et al. 2012). Adrenal washout CT should be performed after a standard contrast-enhanced 60 s portal venous phase (PVP) delay and 15 min post-contrast delay, with or without NECT. Calculation of HU ratios can be relative (enhanced – delayed/enhanced × 100 %) or absolute (enhanced – delayed/enhanced – unenhanced × 100 %) with values >60 % or >40 % diagnostic of adenoma, respectively (Boland et al. 1997; Korobkin et al. 1998; Caoili et al. 2000). Ten-minute delays have also been studied to decrease imaging time but have decreased diagnostic accuracy when compared to 15 min delays (Blake et al. 2006; Taffel et al. 2012).
17.2.4 Pheochromocytoma CT Pitfalls
Pitfall: Pheochromocytomas may demonstrate washout on adrenal CT washout studies. Pheochromocytoma is a rare primary adrenal neoplasm, found in 0.1–0.2 % of patients with hypertension. These vascular neoplasms may demonstrate similar CT washout kinetics as benign adenomas but in contradistinction to adenomas, pheochromocytomas have marked absolute enhancement on the 60 s PVP scan. If the absolute ROI attenuation on PVP exceeds 100 HU, one should strongly suspect a diagnosis of pheochromocytoma, regardless of the % washout at 15 min (Boland et al. 1997) and clinical workup should be initiated.
17.2.5 India Ink Artifact
Pitfall: India ink artifact can mimic signal drop on CSI in very small lesions. Opposed-phase gradient recalled echo images demonstrate chemical shift artifact of the second kind, also called “India ink” artifact at fat-water boundaries. This artifact is due to the presence of an admixture of fat and water protons (from two different tissues) within the same imaging voxel, resulting in a drop of signal when protons are out of phase (Delfaut et al. 1999). It is important not to confuse India ink artifact at the boundary of an adrenal lesion and retroperitoneal fat as signal drop within the adrenal lesion. This can result in the erroneous diagnosis of adenoma and can be particularly problematic for very small adrenal lesions.
17.2.6 Lipid-Containing Adrenal Tumors
Pitfall: Not all adrenal lesions that lose signal on CSI are benign adenomas. Lipid-containing primary tumors such as clear cell renal cell carcinoma (ccRCC) and hepatocellular carcinoma (HCC) can metastasize to the adrenal glands, though usually these are advanced cases. These metastases may demonstrate a loss of signal with CSI and can mimic adenomas (Shinozaki et al. 2001; Sydbow et al. 2006). Typically, this is not an imaging quandary as patients are known to have an underlying primary malignancy, and adrenal lesions will either develop de novo or demonstrate rapid growth on follow-up imaging. Choi et al. (2013) recently demonstrated that adrenal washout CT is not a reliable means to differentiate metastases from HCC or ccRCC from adenoma, advising follow-up if this diagnosis is being considered. Rarely, primary adrenal neoplasms, such as adrenal cortical carcinoma and pheochromocytoma, can also contain intracytoplasmic lipid and demonstrate low density on NECT and loss of signal on CSI, mimicking adenoma. Differentiation from adenoma is based on clinical symptoms, laboratory investigations and additional imaging features such as size, heterogeneity, and calcification (Blake et al. 2003; Elsayes et al. 2004).
17.2.7 Adrenal Collision Tumor
Pitfall: Heterogeneous low density on NECT or loss of signal intensity on CSI in a patient with known malignancy can rarely be due to an adrenal collision tumor. Case reports exist of adrenal metastases arising within an adrenal gland that contains a preexisting benign adrenal adenoma. In a study of 104 patients with known primary malignant tumor and an adrenal mass, 2 % of cases had a collision tumor (Schwartz et al. 1996). These tumors are important to recognize, particularly if biopsy is being planned, since the potentially malignant portion of the mass should be selectively sampled for adequate diagnosis (Fig. 17.2a–e).
17.3 Pitfalls in Imaging the Kidneys
All imaging modalities have a role in renal imaging, depending on the clinical indication. It is estimated that there are more than 1.2 million visits to the emergency department (ED) yearly in USA for acute flank pain (Pitts et al. 2008). This can be due to renal calculi, trauma, infections, neoplasms, as well as nonrenal causes. Evaluation can be done with ultrasound imaging or CT, depending on patient’s age, body habitus, and institutional availability of imaging modalities. For ultrasonographic evaluation, optimal operator technique is required, including adjusting the depth of imaging and the location of the focal spot to be at or just behind the area of interest, as well as patient factors including the ability to hold their breath. Calculi can be identified on ultrasound imaging as echogenic foci which demonstrate shadowing behind them, though calculi can be missed due to small size, surrounding echogenic renal sinus fat and patient factors such as large body habitus.
17.3.1 Twinkling Artifact
An aid to identifying renal calculi is the “twinkling artifact.” The “twinkling artifact” appears as a rapidly alternating color Doppler signal that imitates turbulent flow, often identified behind a strongly reflecting, irregular interface, such as a renal calculus (Rahmouni et al. 1996) (Fig. 17.4a, b). In order to evaluate confirm a twinkling artifact, a high pulse repetition frequency should be chosen to eliminate Doppler signal from vascular structures. A Doppler spectrum of the area of twinkling demonstrates a broadband aliasing signal consistent with noise produced by the reflected signal. In a prospective study in patients with flank pain, the positive predictive value (PPV) of twinkling artifact for identifying calculi was 94 %. In comparison, PPV of grayscale US for detecting urinary tract calculi was only 65 % (Kielar et al. 2012).
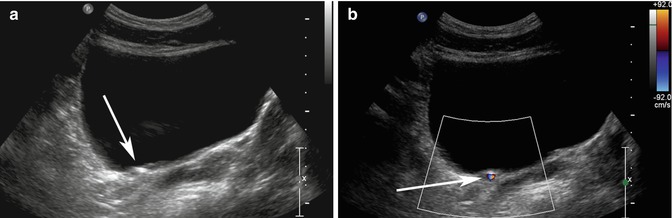
Fig. 17.4
(a) Transverse ultrasound image of the bladder shows an echogenic structure at the right UVJ (arrow) which could represent a calculus, but there is no definite shadowing behind it. (b) When color Doppler is turned on with high pulse repetition frequency (92 cm/s at top right of image), the twinkling artifact is readily identified behind the calculus (arrow)
17.3.2 Renal Pseudotumors
Pitfall: On ultrasound imaging, pseudotumors such as columns of Bertin and dromedary humps, as well as focal infarcts and focal bacterial pyelonephritis, can present as mass–like abnormalities in the kidney (Tsuji et al. 2007). A column of Bertin is a normal variant of unresorbed parenchyma of one or both of the two sub-kidneys that fuse in fetal development to form a normal kidney (Bhatt et al. 2007). It projects into the renal sinus, splaying the sinus. A dromedary hump is a focal bulge of the lateral border of the left kidney as the kidney adapts to the shape of the adjacent spleen (Bhatt et al. 2007). These variants can usually be diagnosed on ultrasound imaging as being normal, since there is no loss of expected differentiation between the cortex and medulla, despite their unusual location or shape. For diagnosis of infarcts, focal pyelonephritis and other nonspecific mass-like areas, CECT is frequently used for characterization. Both focal pyelonephritis and infarcts can demonstrate areas of reduced enhancement on CECT (Tsuji et al. 2007) (Figs. 17.5a, b and 17.6a, b).
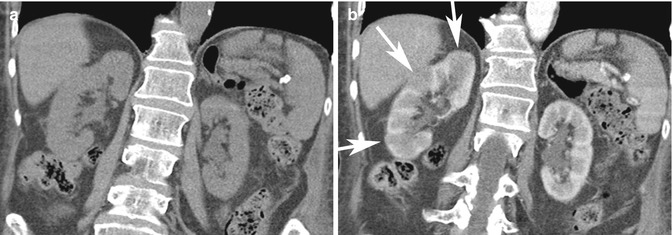
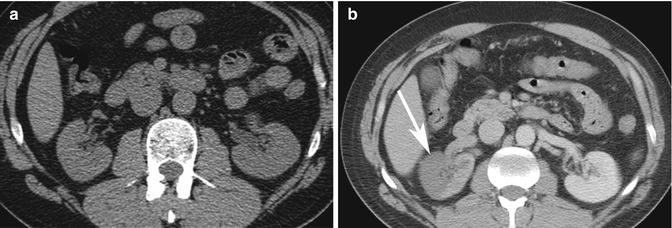
Fig. 17.5
Forty-four-year-old patient with right flank pain. (a) Coronal NECT image does not show any hydronephrosis or calculus on the right. Due to severity of symptoms, a CECT was performed. (b) Coronal CECT image shows focal areas of reduced cortical enhancement (white arrows) in keeping with acute pyelonephritis. The patient had positive urine cultures and recovered after antibiotic therapy
Fig. 17.6
Thirty-seven-year-old IV drug user with sudden onset of severe right flank pain. (a) Axial NECT image does not show any hydronephrosis on the right side or other causes of pain. Due to a new cardiac murmur and concern for endocarditis, a CECT was performed on the same day. (b) Axial CECT image shows a geographic area of non-enhancement in the right kidney consistent with an infarct (arrow). A subsequent echocardiogram revealed vegetation in the left ventricle, consistent with endocarditis. This was the source of emboli to the kidney
17.3.3 CT of Flank Pain
When choosing CT to investigate flank pain, patient radiation exposure, slice thickness, and image noise can affect detection of small calculi. Though NECT is the gold standard in urolithiasis imaging, with a reported sensitivity greater than 93 % and specificity of 100 %, attention to technical parameters is advised (Kim et al. 2005). Jin et al. (2009) reported a low sensitivity (80 %) for small stones (2–4 mm) when using 5 mm slices; thinner sections are therefore necessary for the best diagnostic accuracy.
Pitfall: In patients with flank pain but no renal calculus identified, false–negative or satisfaction-of-search errors can occur unless alternative diagnoses are actively sought. Ahmad et al. demonstrated that 68 % of patients presenting to the ED with flank pain were found to have calculi or recently passed calculi on NECT (Ahmad et al. 2003). In their population, 12 % had other diagnoses identified on NECT, including appendicitis, diverticulitis, pancreatitis, and ovarian pathology (Ahmad et al. 2003). Other studies have shown that up to a third of patients will have other diagnoses detected on NECT (Colistro et al. 2002).
Pitfall: In patients with flank pain but no renal calculus on NECT, renal parenchymal abnormalities can be missed. Clinically overlapping etiologies affecting the kidney can be missed if intravenous contrast agent is not administered. If no diagnosis is identified in the kidney or elsewhere in the abdomen on NECT and symptoms are concerning (e.g., fever, pain out of proportion to findings, underlying risk factors for a hypercoagulable state), CECT should be considered to exclude renal infarcts and infiltrating renal masses such as lymphoma and leukemia. Pyelonephritis is usually diagnosed clinically; however, within the imaging spectrum of patients with possible pyelonephritis (Fig. 17.5a, b), lymphoma can have overlapping CT appearances. Both pathologies can present with fever and leukocytosis, and in immunocompromised patients, typical symptoms of pyelonephritis, including flank pain, can be diminished or absent. Patients with renal infarction can have a high white cell count, high creatinine, and gross or microscopic hematuria which overlaps clinically with renal calculi (Chu et al. 2006) (Fig. 17.6a, b).
17.3.4 Hydronephrosis Mimics
Pitfall: Parapelvic cysts and peripelvic cysts can mimic the appearance of hydronephrosis. There are imaging tips which can help differentiate these etiologies. Parapelvic cysts, which arise from the renal parenchyma and protrude into the collecting system, are often round or oval and do not communicate with one another (Zinn and Becker 1997). Peripelvic cysts can arise from ectasia of renal sinus lymphatics and can also simulate hydronephrosis, but these often also have convex walls and oval shapes. Peripelvic cysts are often bilateral and patients do not have symptoms of obstruction. In hydronephrosis, there is communication of the renal pelvis with the dilated collecting system. The dilated calyces follow their expected shape, except that they have a more blunted appearance (Zinn and Becker 1997). CT urography can reliably differentiate hydronephrosis from parapelvic and peripelvic cysts by demonstrating the presence of excreted contrast material passing between cystic spaces into a non-dilated renal pelvis in the case of parapelvic and peripelvic cysts; however, CT urography is seldom required for this purpose.
A rare consideration in the differential diagnosis of hydronephrosis includes renal arteriovenous malformation (AVM). Doppler interrogation is key, as it demonstrates vascular, arterial, and mosaic vascular flow within the anechoic areas (Muraoka et al. 2008). On CECT, arterial imaging demonstrates brisk enhancement, but if only delayed imaging is obtained. This diagnosis could be misinterpreted as slow excretion of contrast material in moderate hydronephrosis, since the AVM would have the same density as the inferior vena cava (IVC). Finally, if a patient presents with new hydronephrosis, the cause should be identified. Particularly in older patients with new “ureteropelvic junction (UPJ) obstruction,” images should be carefully scrutinized since malignant causes such as transitional cell carcinoma (TCC) or metastases from other primaries need to be excluded (Kane et al. 2012).
17.3.5 Angiomyolipoma and Mimics
Angiomyolipoma (AML) is a benign renal neoplasm which is composed of variable amounts of fat, smooth muscle, and blood vessels. Differentiation of AML from other solid renal masses is important because unnecessary surgery can be prevented. The imaging diagnosis of AML hinges on the detection of gross fat (often referred to as “macroscopic fat”) within the lesion. This can be readily diagnosed with CT by detection of areas within the lesion that measure less than −20 HU which is diagnostic of gross or “macroscopic” fat content (Sasiwimonphan et al. 2012). On MRI, gross fat can be detected as a loss of signal intensity on gradient-echo or spin-echo pulse sequences performed with chemically selective or spectral fat suppression. As opposed to the intracytoplasmic fat within adrenal adenomas (discussed earlier), gross or “macroscopic” fat does not lose signal intensity with CSI because imaging voxels contain only fat protons and there is no phase cancellation. A renal AML can however be diagnosed on opposed-phase gradient-echo MRI by observing the India ink artifact at the fat-water interfaces between the lesion and adjacent kidney parenchyma, or lack of such an artifact at interfaces between the lesion and retroperitoneal fat. AML is often incidentally identified on ultrasound imaging, appearing echogenic due to their fat content, although the ultrasonographic appearance is not pathognomonic.
Pitfall: Not all echogenic renal nodules on ultrasound imaging are AMLs. Occasionally, renal cell carcinoma can present as an echogenic nodule. Therefore, echogenic renal nodules often require further evaluation with CT or MRI to evaluate for the presence of gross fat (Farrelly et al. 2008; Marhuenda et al. 2008). In younger patients with a low risk of malignancy, follow-up ultrasound imaging to confirm stability may also be considered (Fig. 17.7a–d).
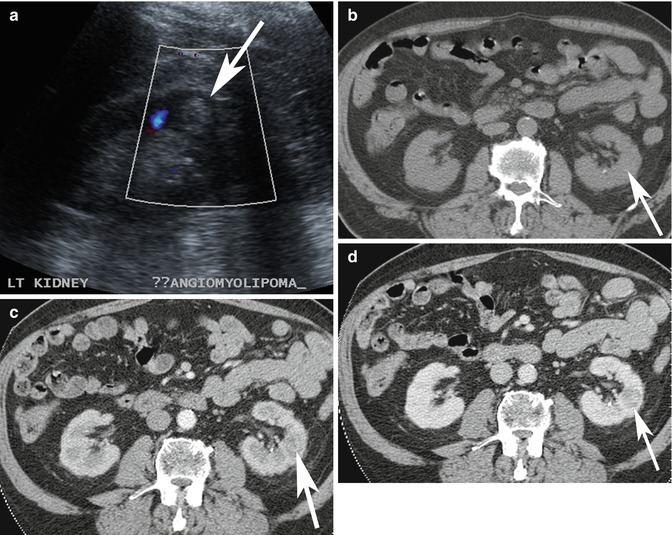
Fig. 17.7
(a) Ultrasound image of a 65-year-old patient shows incidental finding of an echogenic lesion in the cortex of the left kidney which was originally considered to represent an AML (arrow). (b–d) Axial multiphase (b) non-enhanced, and contrast-enhanced (c) arterial and (d) nephrographic phase CT images show that there is no macroscopic fat in the lesion and there is washout in the nephrographic phase. This lesion was resected and confirmed to be a renal cell carcinoma
Pitfall: Malignant renal neoplasms, including clear cell and papillary carcinoma, have been noted to rarely contain gross or “macroscopic” fat (D’Angelo et al. 2002; Garin et al. 2007). In these instances, although exceedingly rare, imaging differentiation from AML is very challenging. The presence of intralesional calcification favors renal cell carcinoma since calcification is exceedingly rare in AML (but has also been reported) (Merran et al. 2004). Thus, in an unusual or aggressive-appearing renal mass which contains macroscopic fat, consider the rare possibility of fat within a malignant renal neoplasm (Fig. 17.8).
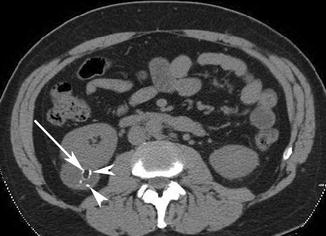
Fig. 17.8
Axial NECT image of a patient with an exophytic lesion in the right kidney (arrow) which has macroscopic fat but also contains calcifications (arrowheads). CECT (not shown) showed significant enhancement and washout. Surgical resection revealed a renal cell carcinoma with macroscopic fat and calcifications, which is a rare finding
Pitfall: In approximately 5 % of AMLs, there is insufficient fat to be detected by the CT and MRI methods described above (Sasiwimonphan et al. 2012). These lesions are often referred to as “minimal fat” AML. Various imaging findings have been studied for the preoperative diagnosis of these lesions, such as a loss of signal intensity with CSI, homogeneously low T2 signal intensity, and enhancement characteristics with mixed results (Hindman et al. 2012). In one study, use of CSI was able to reliably diagnose “minimal fat” AML from other lesions by detecting a larger drop of signal intensity on opposed-phase gradient-echo MRI when compared to other renal masses (Kim et al. 2006). Subsequent studies have been unable to reproduce these findings due to overlap with some clear cell renal cell carcinomas (Hindman et al. 2012).
Pitfall: Some clear cell renal cell carcinomas will demonstrate loss of signal intensity with CSI due to intracytoplasmic fat. Potential overlap between ccRCC with intracytoplasmic fat and minimal fat AML can result in the erroneous diagnosis of a benign entity in the setting of primary renal malignancy (Yoshimitsu et al. 1999). Homogeneously low intensity on T2-weighted MR images in the setting of a renal lesion with loss of signal on CSI would favor “minimal fat” AML, although this finding has yet to be validated on a large scale (Hindman et al. 2012). A renal neoplasm without gross or “macroscopic” fat and with loss of signal intensity on CSI can be either a “minimal fat” AML or ccRCC and should be considered potentially malignant until proven otherwise (Fig. 17.9).
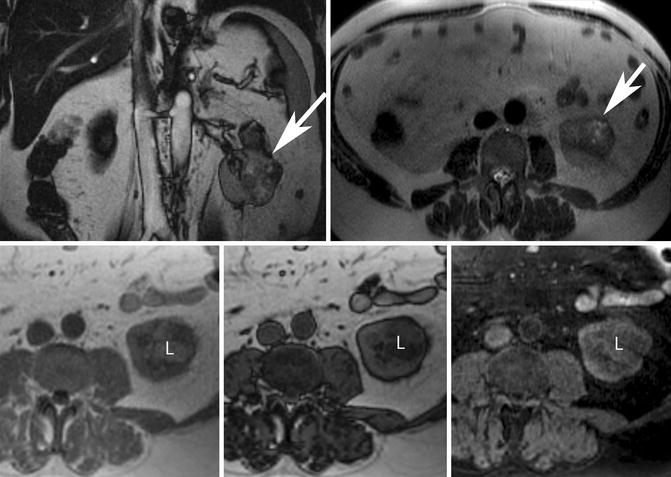
Fig. 17.9
Fifty-four-year-old man with proven clear cell renal cell carcinoma following resection. (Top row) Coronal balanced steady-state free precession (bSSFP) (left) and axial T2-W single-shot fast spin-echo (ssFSE) (right) MR images show an exophytic left renal mass with heterogeneously increased T2 signal intensity (white arrows). (Bottom row) Axial in- and opposed-phase GRE and T1-W spectral fat-saturated 3-D GRE MR images show the presence of intracytoplasmic lipid (L) within the mass revealed by signal loss on the opposed-phase image (middle) but not on the spectral fat-saturated sequence (right). Note that macroscopic or gross fat demonstrates loss of signal with spectral fat suppression but remains bright on opposed-phase images. Some clear cell renal cell carcinomas may contain intracytoplasmic lipid and cannot be reliably differentiated from “minimal fat” AML. The heterogeneous loss of signal intensity on opposed-phase GRE and areas of T2 hyperintensity within the mass favors a diagnosis of carcinoma
17.4 Pitfalls in Imaging of the Ureters
Ureters are conduits for urine between the kidneys and the bladder. They travel in the retroperitoneum next to arteries, veins, muscles, and lymph nodes. They are long and of small caliber, making assessment challenging.
17.4.1 Ureteric Calculus Mimics
Pitfall: Particularly in thin patients with minimal retroperitoneal fat, differentiation between a ureteric calculus and an atherosclerotic plaque or pelvic phlebolith on CT can be challenging. Helpful findings favoring a ureteric calculus include perinephric and periureteric stranding as well as the “rim sign” around the calculus (Heneghan et al. 1997; Arac et al. 2005). The “rim sign” represents the muscular ureteric wall which surrounds a calculus. Phleboliths are calcified concretions within a vein wall as a result of thrombosis. The wall of the vein is thinner than the wall of the ureter and thus a rim is not visible around a phlebolith. A central lucency has been a described in vascular phleboliths on radiographs; however, this appearance is uncommonly seen on CT and cannot be reliably used to differentiate the two (Kim 2001). In cases where the ureter is in close contact with an atherosclerotic vessel, evaluation on coronal images often demonstrates the length of the atherosclerotic plaque along the artery. However, in instances where the plaque is focal, the diagnostic dilemma of a non-obstructive ureteric calculus can persist. In these rare cases, an excretory phase of a CECT can be used to demonstrate flow of urine through the decompressed ureter, next to the atherosclerotic plaque (Fig. 17.10a, b). In the unlikely case of a non-obstructive calculus, the hyperdense urine would flow around the calculus, surrounding it.