Origin (subcutaneous, fascial, intramuscular, mixed)
Location
Distribution
Intracompartmental
Extracompartmental
Size
Shape
Margins
Relationship with superficial fasciae
Neurovascular bundle displacement/encasement
Bone involvement
Signal intensity on different pulse sequences
Signal homogeneity
Changing pattern of homogeneity
Low-signal-intensity septations
Peritumoral edema
Hemorrhage
Contrast enhancement
Static studies (type, intensity)
Dynamic studies (ratio, slope)
Diffusion-weighted MRI
9.2.1 Individual Parameters
Examples of commonly used individual parameters for predicting malignancy are intensity and homogeneity of the MR signal with different pulse sequences. Signal characteristics of both benign and malignant tumors overlap frequently. High signal intensity (SI) on T2-WI and inhomogeneity on T1-WI are sensitive but unfortunately nonspecific parameters. Although most malignant lesions are inhomogeneous, smaller lesions tend to be more homogeneous, irrespective whether they are benign or malignant [39]. Concerning signal intensity, high-grade malignant soft tissue tumors may present with low to intermediate signal intensity on T2-WI as a consequence of hypercellularity, increased nucleocytoplasmic index, and an altered ratio between cellular and interstitial components both resulting in a decreased amount of intra- and extracellular water [1, 3, 26]. In this regard, lymphomas and nondifferentiated (high-grade) sarcomas may present with low SI on T2-weighted images and have to be differentiated from tumors showing recurrent intralesional bleeding and hemosiderin loading causing shortening of the T2-relaxation time and consequently lower SI on T2-WI.
Clear cell sarcomas may present with increased SI on T1-weighted images, depending on their content on melanin which shortens the T1-relaxation time [2].
Changing homogeneity (from homogeneous on T1-WI to heterogeneous on T2-WI) and the presence of a lobular morphology with intervening low-signal intratumoral septations were reported by Hermann, respectively, with a sensitivity of 72 and 80 %, respectively, and a specificity of 87 and 91 %, respectively, in predicting malignancy [14].
Galant et al. described a grading system of subcutaneous soft tissue tumors by means of their relationship with the superficial fascia on MRI. Obtuse angles between superficial fascia and a subcutaneous mass crossing the fascia indicate a probability of malignancy six to seven times that for lesions that do not cross the fascia or have contact with acute angles. Exceptions are vascular and neurogenic tumors, which can cross the fascia through preexisting anatomical channels and fibromatosis [11].
Location has a limited value in differentiating benign and malignant soft tissue tumors. In contradistinction to malignant tumors, benign ones frequently have a preferential location (see also 9.3 Tissue-Specific Diagnosis). Typical examples are elastofibroma dorsi which has a predilection for the subscapular region, PVNS for the joints, nodular fasciitis for the forearm, desmoids for the deltoid and gluteal region, glomus tumors for the subungual soft tissues while soft tissue tumors of the hand and wrist are benign in more than 90 % of the cases, and intra-articular tumoral lesions being almost always benign. Generally, soft tissue sarcomas have a predilection for the thigh and in particular synovial cell sarcomas for the foot. Although the size and shape of the lesion at detection seem unlikely to contribute to tumor grading, Tung combined the data from three investigations and postulated that a diameter of less than 3 cm is a reasonable indicator that a lesion is benign, as this threshold is associated with a positive predictive value of 88 %. Conversely, a diameter of 5 cm predicts malignancy with a sensitivity of 74 %, specificity of 59 %, and an accuracy of 66 % [6, 32].
Although benign tumors tend to be well delineated and, conversely, malignant tumors have rather ill-defined margins, several studies have concluded that the margin (well defined versus infiltrating) of a soft tissue mass on MRI is of no statistical relevance in predicting of malignancy. Moreover, Bongartz reported that aggressive sarcomas may have a pseudocapsule, while benign lesions such as desmoid tumors may invade neighboring tissues [3, 34, 39].
Peritumoral edema, shown on T2-weighted images as an ill-defined area of high signal intensity, can indicate infiltrative tumor [5] but may be seen in reparative inflammation as well [13].
Involvement of adjacent bone, extracompartmental distribution, and encasement of the neurovascular bundle are relatively uncommon findings that are insensitive signs of malignancy. They are also seen in aggressive benign soft tissue lesions including desmoids, hemangiomas, and pigmented villonodular synovitis.
The parameter growth rate is related to the aggressiveness of a soft tissue tumor and not to its malignancy grade [5].
Intratumoral hemorrhage is a rare finding, which can be observed in both benign and malignant lesions, and is difficult to differentiate from nontumoral soft tissue hematoma. Hemorrhage is of high signal on T1-weighted images, coupled with low or high signal on T2-weighted images, provided the tissue was not isointense to fat on all sequences. A low-signal hemosiderin rim is indicative as evidence of prior hemorrhage [20].
Malignant tumors show increased vascularity and have large extracellular spaces and usually reveal greater enhancement and an increased rate of enhancement on dynamic contrast-enhanced imaging [23], although there is a significant overlap in degree and pattern of enhancement and malignancy grade [19, 37, 39].
In a multivariate analysis of 140 soft tissue tumors, Van Rijswijk et al. revealed that combined nonenhanced static and dynamic contrast-enhanced MR imaging parameters were significantly superior to nonenhanced MR imaging parameters alone and to nonenhanced MR imaging parameters combined with static contrast-enhanced MR imaging parameters in prediction of malignancy. The most discriminating parameters were presence of liquefaction, start of dynamic enhancement (time interval between start of arterial and tumor enhancement), and lesion size (diameter) (Fig. 9.1).

Fig. 9.1
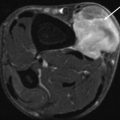
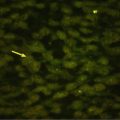
(a–c). High grade pleiomorphic sarcoma of the right adductor compartment in a 54-year-old female: (a) Axial T2-weighted MR image showing a large inhomogeneous intramuscular lesion with myxoid and solid (white arrow) components; (b) Axial dynamic MR sequence after intravenous bolus injection of gadolinium contrast showing very rapid enhancement of the solid part of the lesion (white arrow) following arterial enhancement (white arrowhead); (c) Delayed fatsuppressed T1-weighted MR image shows inhomogeneous enhancement with peripheral enhancing nodule (black arrow). The large size of the lesion, inhomogeneity of the lesion and the rapid and inhomogeneous enhancement are in favor of a malignant lesion
Additional diffusion-weighted imaging (DWI) has proven to be useful in the differential diagnosis of malignant versus benign STT [5, 15, 18, 24]. True diffusion coefficients of malignant STT are significantly lower than those of benign masses, whereas ADC values between both groups are not significantly different.
The value of dynamic contrast-enhanced MRI and DWI in the differentiation of benign versus malignant STT is further discussed in Chap. 5.
9.2.2 Combined Parameters
Although most investigators failed to establish reliable criteria for distinguishing benign from malignant lesions, a combination of individual parameters yields higher sensitivity and specificity [1, 5, 6, 25, 27].
Our research group performed multivariate statistical analysis to determine the accuracy of ten parameters, individually and in combination, for predicting malignancy. When the following signs were observed together, malignancy was predicted with a sensitivity of 81 % and a specificity of 81 %: absence of low signal intensity on T2-weighted images, signal inhomogeneity on T1-weighted images, and mean diameter of the lesion greater than 33 mm (Fig. 9.2). Malignancy was predicted with the highest sensitivity when a lesion had high signal intensity on T2-weighted images, was larger than 33 mm in diameter, and had an inhomogeneous signal intensity on T1-weighted images. Signs that had the greatest specificity for malignancy included the presence of tumor necrosis, bone or neurovascular involvement, and a mean diameter of more than 66 mm. Of the malignant lesions, 80 % had irregular or partially irregular margins, while a similar percentage of benign masses had well-defined or partially irregular margins. The majority of both benign and malignant lesions showed moderate or strong enhancement, no predominant enhancement pattern emerged for either type of mass. In contrast to the study of Berquist et al. [1], margin, signal homogeneity on T2-weighted images, signal intensity on T1-weighted images, shape, and enhancement pattern were statistically nondiscriminatory [27].

Fig. 9.2
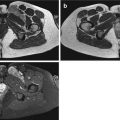
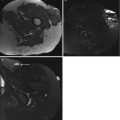
(a–e). Malignant peripheral nerve sheath tumor of the chest wall in a 29-year-old woman: (a) CT scan of the chest after I-contrast injection; (b) axial SE T1-weighted MR image; (c,d) axial SE T2-weighted MR image; (e) axial SE T2-weighted MR image after Gd-contrast injection. On CT scan of the chest, there is a large, rounded, and sharply demarcated mass located in the costovertebral gutter, with the presence of intralesional calcifications and spoke-wheel-like enhancement after contrast injection (a). On T1-WI the lesion is inhomogeneous and of intermediate SI. There is a small area of high SI laterally within the mass (arrow) (b). On T2-WI there is again a spoke-wheel appearance of the lesion; there are multiple fluid-fluid levels and rounded high SI areas (small arrows) on a background of intermediate to high SI (c,d). On T1-WI after contrast injection, there is marked enhancement without enhancement of the rounded high SI areas on T2-WI (compare (d) with (e)). Large size (50 × 80 × 80 mm), extracompartmental extension and bone involvement, inhomogeneous distribution of SI, and the presence of amorphous calcifications within the lesion are parameters, predicting malignancy. Sharp margins and the presence of intralesional hemorrhage are nondiscriminatory parameters. Localization is in favor of a neurogenic tumor. Histologic diagnosis after resection confirmed the diagnosis of a malignant nerve sheath tumor (right 8th intercostal nerve)
Our group also prospectively assessed the value of MRI in grading soft tissue tumors in a series of 548 untreated patients originating from a multi-institutional database, 123 with malignant and 425 with benign tumors. The thresholds to differentiate between malignant and benign STT are interpreted in a nonquantitative way using grading parameters described in literature. We obtained a sensitivity of 93 %, a specificity of 82 %, a negative predictive value of 98 %, and a positive predictive value of 60 % in diagnosing malignancy [12].
More recently, we showed that a second opinion report by a center with large expertise in STT may improve the overall accuracy of grading and characterization from 83 % up to 92 % [35].
MR parameters that suggest malignancy of a soft tissue mass are summarized in Table 9.2.
Table 9.2
Most useful MR parameters that suggest malignancy of a soft tissue lesion
Large size (more than 3 cm) |
Ill-defined margins |
Inhomogeneity on all pulse sequences |
Intralesional hemorrhage or necrosis |
Marked and peripheral enhancement pattern (with papillary projections) on static contrast examination |
Rapid enhancement with steep slope on dynamic contrast examination |
Extracompartmental extension |
Invasion of adjacent bones and neurovascular bundles |
9.3 Tissue-Specific Diagnosis
Benign soft tissue lesions often have a characteristic imaging appearance obviating the need of further histological confirmation. Unfortunately, a tissue-specific diagnosis (characterization) cannot be obtained in all STT, particularly not in malignant STT.
A combination of nonimaging parameters and imaging parameters on different imaging modalities may however be helpful in noninvasive characterization of STT.
9.3.1 Nonimaging Parameters
Relative Prevalence, Location, and Patient’s Age
The overall annual clinical incidence of STT is relatively rare, accounting for 250 per 100,000 for benign STT as compared with 3 per 100,000 for malignant ones. Although some individual entities are rare and therefore difficult to remember for the radiologist, fortunately 70 % of benign and 80 % of malignant tumors can be classified in, respectively, six and seven “diagnostic categories,” which are summarized in Table 9.3 [16, 17].
Table 9.3
Major diagnostic groups of soft tissue tumors
70 % benign | 80 % malignant |
|---|---|
Lipoma and variants | Myxofibrosarcoma |
Fibrous histiocytoma | Liposarcoma |
Nodular fasciitis | Leiomyosarcoma |
Hemangioma | Malignant peripheral nerve sheath tumor |
Fibromatosis | Synovial sarcoma |
Neurofibroma-schwannoma | Fibrosarcoma |
Sarcoma NOS (not otherwise specified) |
In addition, location of the lesion and the age/gender of the patient are very useful nonimaging parameters that may help to suggest a tissue-specific diagnosis on imaging. The usefulness of these nonimaging parameters, including relative prevalence, age at presentation, sex distribution, and zonal distribution, has been well documented by Kransdorf in a large referral population of benign and malignant STT [16, 17].
This study is subject to inherent selection bias (e.g., malignant looking STT are more referred for second opinion than benign ones; small superficial lesions are excised or sampled without imaging). Despite the limitations of the study, the tables from Kransdorf’s paper are highly useful in the evaluation of soft tissue tumor pathology (Tables 9.4 and 9.5) [16, 17].
Table 9.4
Distribution of common benign soft tissue tumors by anatomic location and age
Age (years) | Hand and wrist | % | Upper extremity | % | Axilla and shoulder | % | Foot and ankle | % | Lower extremity | % | Hip, groin, and buttocks | % | Head and neck | % | Trunk | % | Retroperitoneum | % |
|---|---|---|---|---|---|---|---|---|---|---|---|---|---|---|---|---|---|---|
0–5 | Hemangioma | 15 | Fibrous hamartoma of infancy | 16 | Fibrous hamartoma of infancy | 29 | Granuloma annulare | 30 | Granuloma annulare | 23 | Fibrous hamartoma of infancy | 20 | Nodular fasciitis | 20 | Hemangioma | 18 | Lipoblastoma | 37 |
6–15 | Fibrous histiocytoma | 14 | Fibrous histiocytoma | 23 | Fibrous histiocytoma | 34 | Fibromatosis | 23 | Hemangioma | 22 | Nodular fasciitis | 27 | Nodular fasciitis | 33 | Nodular fasciitis | 28 | Lymphangioma | 37 |
16–25 | GCTTS | 20 | Nodular fasciitis | 35 | Fibrous histiocytoma | 36 | Fibromatosis | 22 | Fibrous histiocytoma | 24 | Neurofibroma | 16 | Nodular fasciitis | 21 | Nodular fasciitis | 24 | Fibromatosis | 20 |
26–45 | Fibrous histiocytoma | 18 | Nodular fasciitis | 38 | Lipoma | 28 | Fibromatosis | 21 | Fibrous histiocytoma | 25 | Lipoma | 17 | Lipoma | 29 | Lipoma | 19 | Schwannoma | 23 |
46–65 | GCTTS | 23 | Nodular fasciitis | 20 | Lipoma | 58 | Fibromatosis | 25 | Lipoma | 23 | Lipoma | 35 | Lipoma | 46 | Lipoma | 44 | Schwannoma | 19 |
66 and over | GCTTS | 21 | Lipoma | 22 | Lipoma | 58 | Fibromatosis | 14 | Lipoma | 26 | Lipoma | 21 | Lipoma | 50 | Lipoma | 42 | Schwannoma | 26 |
Table 9.5
Distribution of common malignant soft tissue tumors by anatomic location and age
Age (years) | Hand and wrist | % | Upper extremity | % | Axilla and shoulder | % | Foot and ankle | % | Lower extremity | % | Hip, groin, and buttocks | % | Trunk | % | Retroperitoneum | % |
|---|---|---|---|---|---|---|---|---|---|---|---|---|---|---|---|---|
0–5 | Fibrosarcoma | 45 | Fibrosarcoma | 29 | Fibrosarcoma | 56 | Fibrosarcoma | 45 | Fibrosarcoma | 45 | Fibrosarcoma | 32 | Fibrosarcoma | 26 | Fibrosarcoma | 20 |
6–15 | Epithelioid sarcoma | 21 | Angiomatoid MFH | 33 | Angiomatoid MFH | 21 | Synovial sarcoma | 21 | Synovial sarcoma | 22 | Angiomatoid MFH | 21 | Rhabdomyosarcoma | 15 | Rhabdomyosarcoma | 31 |
16–25 | Epithelioid sarcoma | 29 | Synovial sarcoma | 23 | Synovial sarcoma | 18 | Synovial sarcoma | 30 | Synovial sarcoma | 22 | Synovial sarcoma | 18 | MFH | 23 | Malignant schwannoma | 20 |
26–45 | MFH | 18 | MFH | 28 | DFSP | 33 | Synovial sarcoma | 26 | Liposarcoma | 28 | Liposarcoma | 18 | DFSP | 30 | Leiomyosarcoma | 32 |
46–65 | MFH | 19 | MFH | 46 | MFH | 35 | MFH | 25 | MFH | 43 | Liposarcoma | 24 | MFH | 31 | Liposarcoma | 33 |
66 and over | MFH | 35 | MFH | 60 | MFH | 50 | Kaposi’s sarcoma | 37
Related posts:Stay updated, free articles. Join our Telegram channel
Full access? Get Clinical Tree
 Get Clinical Tree app for offline access

|