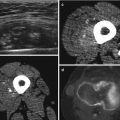
Fig. 4.1
(a–c) Myxoid liposarcoma in the distal thigh. (a) Axial STIR sequence. A sharply margined mass lesion with homogeneous high signal intensity is interposed between the vastus lateralis muscle and the distal femur. (b) Axial unenhanced T1-weighted image. A very low tumor-to-muscle contrast is shown with the lesion’s signal intensity slightly lower than muscle. In combination with the high signal intensity on STIR sequence, this lesion could be mistaken for a cyst based on unenhanced sequences alone. Also note the very high tumor-to-fat contrast, typical for unenhanced T1-weighted images. (c) Axial Gd-enhanced T1-weighted image. The lesion shows a definite and heterogeneous enhancement, inconsistent with a cystic origin of the lesion. Although there is a decreased tumor-to-fat contrast, delineation of the tumor from the adjacent fat still is perfectly possible. In addition, due to a clear increase in tumor-to-muscle contrast, this sequence is very suitable for surgical planning. Beside the adequate delineation of the tumor, this enhanced T1-weighted sequence improves the evaluation of the internal structure of the tumor. It helps to differentiate viable tumor from a cyst, with a totally different surgical approach, and helps to select an appropriate biopsy site. Because it mainly consists of less well-vascularized and myxoid or necrotic tissue, a biopsy in de posterior part of the lesion should be avoided

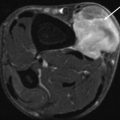
Fig. 4.2
(a, b) Myxoid round cell liposarcoma in the upper arm. (a) Axial unenhanced SE T1-weighted image. Large tumor in the lateral head of the triceps muscle, isointense to muscle, resulting in poor tumor-to-muscle but high tumor-to-fat contrast. In the posterior half of the lesion, a small hyperintense area is visible, consistent with fat or another short-T1 tissue. (b) Axial unenhanced fat-suppressed SE T1-weighted image. Fat suppression clearly decreases the signal intensity of the small area, consistent with fatty tissue, raising the suspicion of a possible liposarcoma

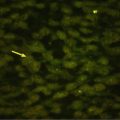
Fig. 4.3
(a, b) B-cell non-Hodgkin lymphoma of the left buttock. (a) Axial unenhanced SE T1-weighted image. Large mass in the left gluteus maximus muscle, slightly hyperintense to muscle. Due to high muscle-to-fat contrast, a fat plane is clearly visible anterior to the mass. In the lateral part, a small hyperintense area is visible, consistent with fat or another short-T1 tissue. (b) Axial unenhanced fat-suppressed SE T1-weighted image. Due to the rescaling effect, the subtle hyperintensity of the mass compared with the surrounding muscle is magnified, hence becoming more obvious. Fat suppression doesn’t decrease the signal intensity of the small lateral area, and rescaling even increases its signal intensity. Hence, it is unlikely that we are dealing with a liposarcoma. Notice fat suppression results in obscuring of anatomical fat planes

Fig. 4.4
(a–c) Malignant peripheral nerve sheath tumor in the distal vastus medialis muscle of the thigh. (a) Axial unenhanced SE T1-weighted image. The signal intensity of the mass is heterogeneous, grossly isointense to muscle with some slightly hyperintense areas. (b) Axial unenhanced fat-suppressed SE T1-weighted image. Fat suppression results in magnification of the signal heterogeneity, increasing the conspicuity of a small hyperintense area in the medial half of the lesion. (c) Axial Gd-enhanced fat-suppressed SE T1-weighted image. After Gd administration two rims of enhancement are visible, one surrounding the lesion and another surrounding a hypointense area in the medial half of the lesion. Since Gd-enhanced blood vessels now are the most hyperintense structures, rescaling occurs resulting in downscaling of the slightly hyperintense area in the medial half of the lesion. Due to the same rescaling, assessment of Gd uptake in the lateral half and posterior part of the lesion is difficult. Most likely the uptake is slight. This would be even more difficult if precontrast fat-suppressed images weren’t available and assessment was based on comparison of a with c. In this case subtraction images, subtracting sequence b from c, and/or nonfat-suppressed Gd-enhanced T1-WI would have been of great value
Because of the low tumor-to-muscle contrast, T1-WI in another than the axial plane usually is not useful. For fatty tumors, with excellent tumor-to-muscle contrast, additional T1-WI in a longitudinal plane might be helpful for local staging.
Tissue Characteristics
Tissue characterization is based on several imaging parameters, some of them related to the signal intensity on T1-WI [4]. Unenhanced T1-WI also is essential as a baseline for contrast-enhanced studies.
4.3.2 Fat-Suppressed T1-Weighted Imaging (FS T1-WI)
Extra information can be derived from the addition of a fat-suppression technique to a T1-weighted sequence. Chemical shift-based, also known as frequency selective, fat suppression should be used in these cases.
Local Staging
Tissue Characteristics
The added value of FS T1-WI for tissue characterization is threefold : a more efficient use of the dynamic range for display of tissue contrast, differentiation between fat and other short-T1 tissues, and a baseline for comparison with FS contrast-enhanced T1-WI.
Suppression of the high signal intensity of fat induces a rescaling, a redistribution of gray levels, leading to a more efficient use of the dynamic range for display of tissue contrast [12]. Minor differences in signal intensity between tissues on non-FS T1-WI get magnified, and signal inhomogeneity, an important parameter in characterization, is better evaluated [10] (Figs. 4.3a, b and 4.4a, b)
A signal hyperintense to muscle is considered to be hyperintense on T1-WI. Hyperintense substances on T1-WI include fat, methemoglobin, melanin, and proteinaceous fluid [30]. Chemical shift-based FS selectively decreases the signal intensity of fat, while other hyperintense tissues remain hyperintense [18, 22] (Figs. 4.2, 4.3, and 4.5b). FS T1-WI is useful if a lesion shows high signal intensity on the T1-WI [24, 30], e.g., to differentiate fatty tissue from a recent hematoma. It is important to perform the sequence with frequency-selective FS. Inversion-recovery FS is nonspecific and can cause loss of signal of not only fat but also of other short-T1 substances [30].

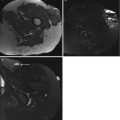
Fig. 4.5
(a–d) Necrotic, hemorrhagic high-grade pleiomorphic sarcoma of the posterior thigh compartment. (a) Sagittal unenhanced T1-weighted image. The large mass lesion is showing an inhomogeneous high signal intensity, possibly of lipomatous origin. (b) Sagittal fat-suppressed-unenhanced T1-weighted image. Persistence of the high signal intensity despite fat suppression is inconsistent with the hypothesis of a fatty tumor and in favor of the presence of methemoglobin in a large hematoma or hemorrhagic tumor. (c) Sagittal fat-suppressed Gd-enhanced T1-weighted image. Differentiation between hematoma and hemorrhagic tumor needs administration of gadolinium (Gd) contrast. Unfortunately, because of the presence of intralesional methemoglobin, the conspicuity of Gd enhancement doesn’t benefit from the fat-suppression technique. Based on this sequence, it is virtually impossible to differentiate enhancement from methemoglobin. (d) Sagittal subtraction image (b subtracted from c). Subtraction of pre- from post-Gd fat-suppressed T1-weighted images permits to isolate the areas of Gd enhancement, showing a thin rim enhancement and only some small foci of mural enhancement in the upper posterior part of the lesion
As explained in the contrast-enhanced section, it is essential to ensure that a precontrast fat-suppressed sequence is available for comparison if the postcontrast image is intended to be a fat-saturated T1-WI [12]. When time constraints are an issue, performing FS T1-WI frequently is not useful when the lesion is isointense or hypointense to muscle on T1-WI.
4.3.3 Fluid-Sensitive Sequences
Local Staging
Fluid-sensitive sequences are important for the detection of a tumor and the differentiation of a hyperintense tumor and its surrounding edema from the hypointense surrounding muscles (Fig. 4.6b). The reactive edema around a tumor often contains satellite tumor micronodules and is considered as an integral part of the lesion and therefore is removed en bloc with the tumor [14, 17, 21, 23]. The conspicuity of this peritumoral edema should be as high as possible. The conspicuity with a classic double-echo T2-weighted sequence is acceptable. Its main disadvantage remains the relatively long acquisition times [19], which can be overcome by the use of a FSE T2-weighted sequence. However, since fat appears bright on FSE sequences [2, 13], with subsequent decrease of conspicuity of tumors or edema juxtaposed to fat [19], FSE T2-weighted sequences without fat suppression should not be used in tumor imaging (Fig. 4.6a). For maximal conspicuity of a tumor and its surrounding edema against the background of muscle and fat, a fat-suppressed fluid-sensitive sequence should be used. Usually a chemical shift-based fat-suppression technique is chosen. Its acquisition time is shorter with a higher signal-to-noise ratio compared to STIR imaging [8]. A disadvantage is its susceptibility to magnetic field inhomogeneities. STIR provides more uniform fat suppression but results in longer scan times or lower signal-to-noise ratio [3].

Fig. 4.6
(a, b) Synovial sarcoma of the proximal thigh. (a) Coronal FSE T2-weighted image. A mass consisting of several intermediate to hypointense nodulus and a strongly hyperintense medial area is shown. No clear perilesional edema is visible, although this assessment is difficult due to the artificially high signal intensity of fat, typical for this FSE T2-weighted sequence. (b) Coronal STIR sequence. Signal intensity of the mass is comparable with the previous sequence. However, due to the decreased signal intensity of fat by this inversion recovery type of fat suppression, resulting in a high fluid-to-fat contrast, a reactive zone of perilesional edema at the distal pole of the lesion becomes unequivocally visible. This case illustrates the ineffectiveness of FSE T2-WI for local staging purpose
Tissue Characteristics
Spin-echo T2-WI is essential for tumor characterization [4]. Since fat appears artificially bright on FSE sequences, FSE T2-WI without fat suppression should not be used in tumor characterization [2, 13]. It is important to realize that the signal intensity of a mass can appear quite different on a FS T2-WI, as compared with the corresponding non-FS T2-WI because of the rescaling effect. FS sequences alone cannot be used to reliably describe the signal characteristics of a mass [30].
As with T1-WI chemical shift-based FS T2-WI can be used to confirm the presence of fat in a lesion. In addition it also increases the conspicuity of non-lipomatous components in lipomatous tumors, the latter helping in distinguishing lipoma from well-differentiated liposarcoma [9].
Since its fat suppression is nonspecific, STIR imaging should not be used for tissue characterization. Nonfatty tissues can be suppressed along with fat, and fatty tissues may not be fully suppressed. Knowledge of this pitfall is necessary for correct image interpretation [1].
4.3.4 T2* Gradient Echo Imaging
Tissue Characteristics
In some selected applications, a T2*-weighted gradient echo sequence can be very useful. In the absence of gas or calcifications on radiographs and computed tomography, a marked signal loss on GRE sequences is almost pathognomonic for hemosiderin (Fig. 4.7) [11]. When present in sufficient quantities, hemosiderin can appear more prominent, the so-called blooming, and therefore useful in the diagnosis of hemangiomas, PVNS, and mature hematomas [16].

Fig. 4.7


(a, b) Giant cell tumor of tendon sheath of the foot. (a) Axial unenhanced SE T1-weighted image. Unsharply demarcated mass along the tibialis posterior insertion, deep to the abductor hallucis muscle, causing an erosion at the medioplantar side of the navicular bone. The lesion shows a heterogeneous signal intensity with strongly hypointense areas, consistent with possible collagen content, calcifications, or hemosiderin. (b) Axial T2*-weighted gradient echo image. On this gradient echo sequence, the whole lesion shows a profound signal loss, the so-called blooming effect, highly suggestive of the presence of hemosiderin, consistent with giant cell tumor of tendon sheath (extra-articular type of PVNS)
Related posts:

Stay updated, free articles. Join our Telegram channel
Full access? Get Clinical Tree
