Fig. 1.1
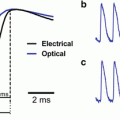
(a) Top. Photographs of Richard Keynes and David Hill. Bottom panel. A Carcinus maenas leg nerve was stimulated 250 times during the bar labeled stimulus. The stimulus resulted in an increase in scattering that lasted about 20 s. This was followed by a scattering decrease which persisted for several minutes. From Hill and Keynes (1949). (b) A photograph of D.N. Nasonov and Dora Rosenthal taken in 1956 together with a recording of the change in Direct Turquoise absorption as a result of stimulating a crab axon 50 times per second for 2 min (6,000 stimuli). The optical recording is from Levin et al. (1968)
Starting at about the same time and continuing into the 1960s, scientists at the Institute of Cytology in Leningrad began measuring changes in the optical properties of dye stained nerves (Nasonov and Suzdal’skaia 1957; Vereninov et al. 1962; Levin et al. 1968). Again they used relatively long stimulus trains and recorded signals with time courses of tens of seconds. The photograph in Fig. 1.1b includes two of the scientists: D. N. Nasonov (standing) and Dora Rosenthal (seated). On the right is a recording from Levin et al. (1968) illustrating the change in absorption of the dye Direct Turquoise from an isolated crab axon.
With the introduction of signal averaging to biological research it became possible to measure signals that were much smaller. One could then look for signals that occurred coincident with the action potential. This led to the discovery of changes in light scattering and birefringence that accompany the action potentials in nerves and single axons (Cohen et al. 1968). Figure 1.2a shows the first measurement of the birefringence signal from a squid giant axon made at the Laboratory of the Marine Biological Association in 1967. The signal was very small; the fractional change, ΔI/I, was only 1 part in 100,000. And, 20,000 trials had to be averaged to achieve the signal-to-noise ratio shown in the figure. Brushing aside the tiny size of the signals, David Gilbert (Fig. 1.2b; personal communication) pointed out that optical signals might be used to follow activity in the nervous system. Soon thereafter Ichiji Tasaki (Fig. 1.2b) and collaborators (Tasaki et al. 1968) discovered fast changes in the fluorescence of axons that were stained with dyes. Several years later changes in dye absorption (Ross et al. 1974) and birefringence (Ross et al. 1977) were also found. Almost all of these dye signals were shown to depend on changes in membrane potential (Davila et al. 1974; Cohen et al. 1974; Salzberg and Bezanilla 1983) a conclusion that is now widely accepted. However, there was early disagreement (Conti et al. 1971) and Ichiji was always unconvinced.
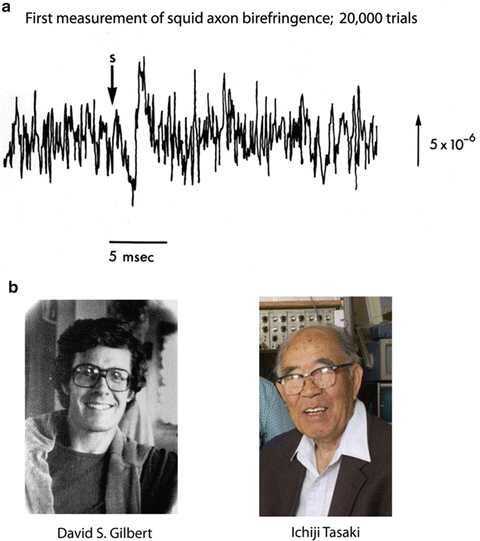

Fig. 1.2
(a) The first recording of an optical signal (birefringence) from an individual axon on a time scale appropriate for measuring the time course of the signal during the action potential. 20,000 trials were averaged. In this and subsequent figures the size of the vertical line represents the stated value of the fractional change in intensity (ΔI/I or ΔF/F). (L.B. Cohen and R.D. Keynes, unpublished result). (b) Photographs of David Gilbert and Ichiji Tasaki
In 1971 we began a deliberate search for larger optical signals by screening many dyes. After a few years of testing and ~1,000 dyes we had obtained signals that were about 100 times larger than the intrinsic signals described above. One hundred times larger doesn’t mean that the signals are now large. Care is still needed to optimize the measurement signal-to-noise ratio. The second section of this chapter together with other chapters provide information about the needed optimization. Because of this improvement in signal size, we were able to record optical signals from a smaller membrane area and with higher time resolution. The top panel of Fig. 1.3 illustrates a single trial absorption signal from a single action potential in a 50 μm diameter barnacle neuron made with the merocyanine dye whose structure is illustrated. The five adults on the right hand side of the photograph at the bottom were in large part responsible for the dye screening. Other important contributors during those early years (not shown) were Vicencio Davila, Jeff Wang, Ravinder Gupta and Alan Waggoner.
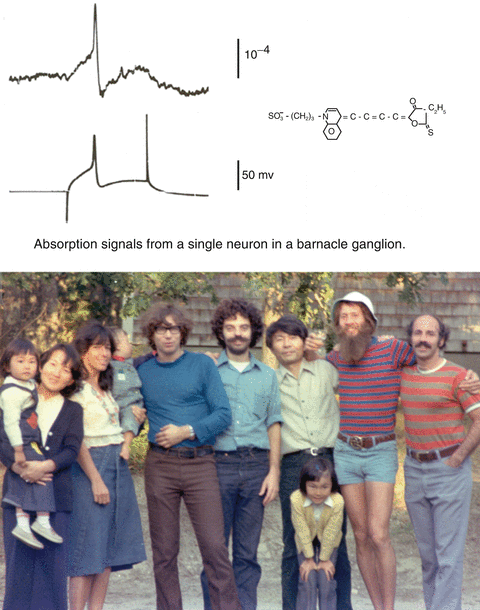

Fig. 1.3
On the top is an absorption change measured during a single action potential from a cell body in a barnacle supraesophageal ganglion. The structure of the absorption dye, synthesized by Jeff Wang and Alan Waggoner, is illustrated at the top. In the photograph are, from the left, Naoko Kamino, Kyoko Kamino, Irit Grinvald, Eran Grinvald, Amiram Grinvald, Larry Cohen, Kohtaro Kamino, Kaeko Kamino, Brian Salzberg and Bill Ross. The photograph, made by Sarah Lesher, is from 1976. The optical recording is from Salzberg et al. (1977)
2.2 Ion Sensitive Dyes and Their Comparison with Voltage Sensitive Dyes
The first attempt to use organic optical indicators of intracellular ion concentration were measurements of calcium with the dye murexide (Jobsis and O’Connor 1966). Ironically, those results are now thought to be an artifact (Maylie et al. 1987). Ashley and Ridgway (1970) later introduced the use of the photoprotein aequorin. Following the suggestion of John Cooper (personal communication), the Arsenazo class of calcium dyes was introduced (Brown et al. 1975). More recently, Roger Tsien and collaborators have developed a large number of widely used ion indicator dyes based on the chemical structure of the chelator EGTA (e.g. Tsien 1989).
Figure 1.4 illustrates two time course comparisons between voltage, calcium, and intrinsic signals. The top pair compares voltage and calcium signals from the same location on a turtle olfactory bulb. The signals are in response to a shock to the olfactory nerve. The voltage sensitive dye signal rises faster and falls faster than the calcium signal. Some of the slowness of the calcium signal is thought to result from the dye response itself and some from the time taken by the cells to bring their calcium concentration back to its original level. The bottom pair of traces compares a calcium signal and an intrinsic signal (Blasdel and Salama 1986; Grinvald et al. 1986) from the same glomerulus in a mouse olfactory bulb. Here the stimulus was an odorant presented to the nose. The calcium signal reaches a peak in less than 0.5 s while the intrinsic signal doesn’t reach its peak until about 5 s after the stimulus onset.
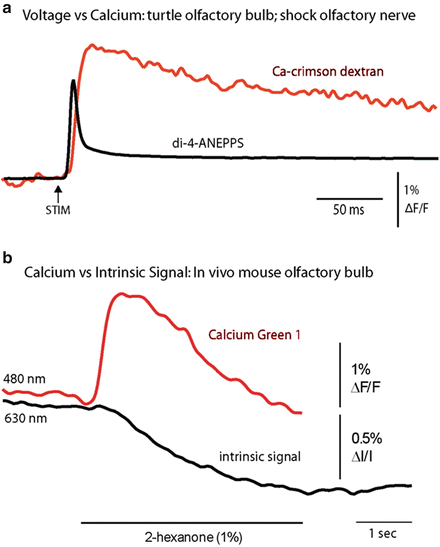

Fig. 1.4
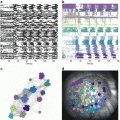
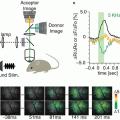
Comparisons of voltage, calcium, and intrinsic imaging signals. (a) A comparison of the time course of a voltage and a calcium dye signal from the same location near the merger of the olfactory nerve and the olfactory bulb in an in vitro turtle preparation. The voltage signal is faster (M. Wachowiak and L. B. Cohen, unpublished). (b) A comparison of the time course of the calcium signal and the intrinsic imaging signal in a mouse olfactory bulb glomerulus in response to the odorant, 2-hexanone. The intrinsic imaging signal is substantially slower than the calcium signal. (Modified from Wachowiak and Cohen 2003)
2.3 Multi-site Measurements of Brain Activity
The first multi-site measurements of brain activity were made by Schuette et al. (1974) who used an image intensifier and camera tube to monitor changes in NADH fluorescence from cortex during epileptic seizures. This was followed by methods using several individual silicon photodiodes (Salzberg et al. 1977), and later by a variety of photodiode arrays, camera tubes, CCD and CMOS cameras.
3 Measurement Principles
Even though the changes in membrane potential during action potentials and synaptic activity are small in mV, they are giant in volts/cm because the membrane is very thin. Thus, 100 mV across 3 nm is 300,000 V/cm, a voltage gradient long known to be able to alter the spectral properties of merocyanine dyes (Labhart 1963; Bucher et al. 1969). This direct effect of voltage on dye spectra, called electrochromism, is one mechanism thought to give rise to signals from organic voltage sensitive dyes (Loew et al. 1985). Other mechanisms with spectral supporting evidence are voltage sensitive shifts in monomer-dimer equilibria (Waggoner and Grinvald 1977) and dye rotation in the electric field (Conti 1975; Fromherz et al. 1991). Because the electric field change is so large, it is perhaps not surprising that we were able to measure signals in ~500 of the ~2,000 dyes that were tested on squid giant axons.
Action potential propagation and synaptic currents also give rise to extracellular and intracellular currents which means that there will also be voltage gradients in these locations. However these extracellular currents flow over distances of mm (rather than nm) and thus the voltage gradients are smaller by six orders of magnitude. It is for this reason that the voltage sensitive dye signals are presumed to arise solely from changes in dye molecules embedded in or directly adjacent to the membrane.
4 The Definition of a Voltage Sensitive Dye
The voltage-sensitive dye signals described in this book are “fast” signals (Cohen and Salzberg 1978) that are presumed to arise from membrane-bound dye. Figure 1.5, top, illustrates the kind of result that is used to define a voltage sensitive dye. In a giant axon from a squid, these optical signals are fast, following membrane potential with a time constant of <10 μs (Loew et al. 1985). The dye signals have a time course that is qualitatively different from the time course of the ionic currents or the membrane permeability changes. With almost all of the tested dyes the signal size is linearly related to the size of the change in potential (e.g. Gupta et al. 1981). Thus, these dyes provide a direct, fast, and linear measure of the change in membrane potential of the stained membranes.
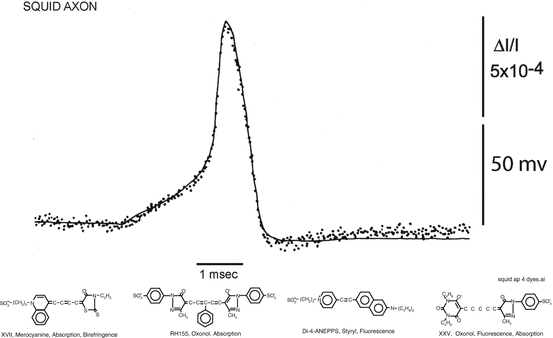

Fig. 1.5
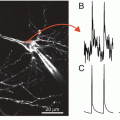
Top. Changes in absorption (dots) of a giant axon stained with a merocyanine dye, XVII, (bottom left dye) during a membrane action potential (smooth trace) recorded simultaneously. The change in absorption and the action potential had the same time course. The response time constant of the light measuring system was 35 μs; 32 sweeps were averaged. Bottom. Examples of four different chromophores that have been used to monitor membrane potential. The merocyanine dye, XVII (WW375), and the oxonol dye, RH155, were commercially available as NK2495 and NK3041 from Nippon Kankoh-Shikiso Kenkyusho Co. Ltd., Okayama, Japan. The oxonol, XXV (WW781) and styryl, di-4-ANEPPS, are available commercially as dye R-1114 and D-1199 from Invitrogen (Molecular Probes), Junction City, OR
A direct comparison of membrane potential and voltage-sensitive dye signal like that illustrated in Fig. 1.5 cannot often be made. Several of the following chapters discuss the important issues involved in interpreting less direct comparisons.
Several organic voltage-sensitive dyes have been used to monitor changes in membrane potential in a variety of preparations. Figure 1.5, bottom, illustrates four different chromophores (the merocyanine dye, XVII, was used for the measurement illustrated in Fig. 1.5, top). The merocyanine dye, XVII (WW375), and the oxonol dye, RH155 were commercially available as NK2495 and NK3041 from Nippon Kankoh-Shikiso Kenkyusho Co. Ltd., Okayama, Japan. The oxonol, XXV (WW781) and styryl, di-4-ANEPPS, are commercially available as dye R-1114 and D-1199 from Invitrogen (Molecular Probes), Junction City, OR. For each of the four chromophores approximately 100 analogues have been synthesized in an attempt to optimize the signal-to-noise ratio. (This screening was made possible by synthetic efforts of three laboratories: Jeff Wang, Ravender Gupta and Alan Waggoner then at Amherst College; Rina Hildesheim and Amiram Grinvald at the Weizmann Institute; and Joe Wuskell and Leslie Loew at the University of Connecticut Health Center.) For each of the chromophores, there were 10 or 20 dyes that gave approximately the same signal size on squid axons (Gupta et al. 1981). However, dyes that had nearly identical signal size on squid axons often had very different responses on other preparations, and thus tens of dyes usually have to be tested to obtain the largest possible signal. A common failure was that the dye did not penetrate through connective tissue or along intercellular spaces to the membrane of interest.
The following rules-of-thumb seem to be useful. First, each of the chromophores is available with a fixed charge, which is either a quaternary nitrogen (positive) or a sulfonate (negative). Generally the positive dyes have given larger signals when dye is applied either extracellularly or intracellularly in vertebrate preparations. Second, each chromophore is available with carbon chains of several lengths. The more hydrophilic dyes (methyl or ethyl) work best if the dye has to penetrate through a compact tissue (vertebrate brain) or be transported to distant branches of a dendritic tree. More hydrophobic dyes (hexyl or octyl) work best in tissue culture; in tissue culture the less hydrophobic dyes unbind rapidly.
5 Preliminary Considerations
The optical signals are small in many of the examples of voltage sensitive dye measurements given in the chapters in this book. Some examples involve fractional intensity changes, ΔI/I, that are as low as 10−4. In order to measure these signals, the noise in the measurements had to be an even smaller fraction of the resting intensity. In the sections that follow, some of the considerations necessary to achieve such a low noise are outlined.
5.1 Signal Type
Sometimes it is possible to decide in advance which kind of optical signal will give the best signal-to-noise ratio but, in other situations, an experimental comparison is necessary. The choice of signal type often depends on the optical characteristics of the preparation. Extrinsic birefringence signals are relatively large in preparations that, like axons, have a cylindrical shape and radial optic axis (Ross et al. 1977). However, in preparations with spherical symmetry (e.g., cell soma), the birefringence signals in adjacent quadrants will cancel (Boyle and Cohen 1980).
Thick preparations (e.g. mammalian cortex) also dictate the choice of signal. In this circumstance transmitted light measurements are not easy (a subcortical implantation of a light guide would be necessary), and the small size of the absorption signals that are detected in reflected light (Ross et al. 1977; Orbach and Cohen 1983) meant that fluorescence would be optimal (Orbach et al. 1985). Another factor that affects the choice of absorption or fluorescence is that the signal-to-noise ratio in fluorescence is more strongly degraded by dye bound to extraneous material.
Fluorescence signals have most often been used in monitoring activity from tissue-cultured neurons. Both kinds of signals have been used in measurements from ganglia and brain slices. Fluorescence has always been used in measurements from intact vertebrate brains.
5.2 Amplitude of the Voltage Change
Activity signals are often presented as a fractional intensity change, ΔI/I. The signals give information about the time course of the potential change but no direct information about the absolute magnitude. However, in some instances, approximate estimations can be obtained. For example, the size of the optical signal in response to a sensory stimulus can be compared to the size of the signal in response to an epileptic event (Orbach et al. 1985). Or in single neuron experiments long lasting hyperpolarizing steps can be induced in the soma after blocking ionic currents and this signal can be used for calibration. Another approach is the use of ratiometric measurements at two independent wavelengths (Gross et al. 1994). However, one must know the fraction of the fluorescence that results from dye bound to active membranes versus dye bound to non-active membranes. This requirement is almost never met.
6 Noise
6.1 Shot Noise
The limit of accuracy with which light can be measured is set by the shot noise arising from the statistical nature of photon emission and detection. Fluctuations in the number of photons emitted per unit time occur, and if an ideal light source (e.g. a tungsten filament) emits an average of 1016 photons/ms, the root-mean-square (RMS) deviation in the number emitted is the square root of this number or 108 photons/ms. Because of shot noise, the signal-to-noise ratio is directly proportional to the square root of the number of measured photons and inversely proportional to the square root of the bandwidth of the photodetection system (Braddick 1960; Malmstadt et al. 1974). The basis for the square root dependence on intensity is illustrated in Fig. 1.6. In the top plot, the result of using a random number table to distribute 20 photons into 20 time windows is shown. In the bottom plot the same procedure was used to distribute 200 photons into the same 20 bins. Relative to the average light level there is more noise in the top trace (20 photons) than in the bottom trace (200 photons). The improvement from A to B is similar to that expected from the square-root relationship. This square-root relationship is indicated by the straight red line in Fig. 1.7 which plots the light intensity divided by the noise in the measurement versus the light intensity. In a shot-noise limited measurement, improvement in the signal-to-noise ratio can only be obtained by (1) increasing the illumination intensity, (2) improving the light-gathering efficiency of the measuring system, or (3) reducing the bandwidth.
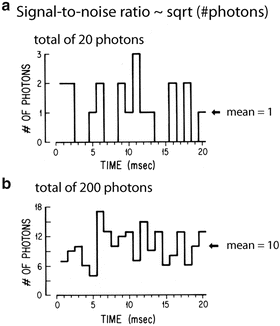
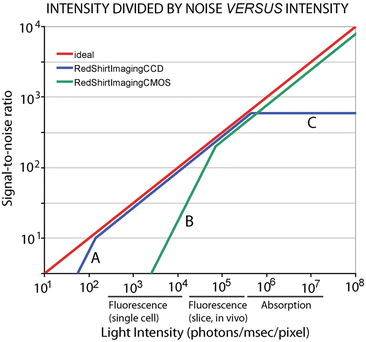

Fig. 1.6
Plots of the results of using a table of random numbers to distribute 20 photons (top, a) or 200 photons (bottom, b) into 20 time bins. The result illustrates the fact that when more photons are measured the signal-to-noise ratio is improved. The improvement is close to that expected from the known square root relationship between the signal-to-noise ratio and the measured intensity. Redrawn from Wu and Cohen (1993)

Fig. 1.7
The ratio of light intensity divided by the noise in the measurement as a function of light intensity in photons/ms/pixel. The theoretical optimum signal-to-noise ratio (red line) is the shot-noise limit. Two camera systems are shown, a cooled, back-illuminated, 2 kHz frame rate, 80 × 80 pixel CCD camera (blue lines) and a CMOS camera (green lines). The CMOS camera provides an optimal signal-to-noise ratio at higher intensities while the CCD camera is better at lower intensities. The approximate light intensity per detector in fluorescence measurements from a single neuron, fluorescence measurements from bath application of dye to a slice or in vivo preparation, and in absorption measurements from a ganglion or a slice is indicated along the x axis. The signal-to-noise ratio for the CMOS camera falls away at low intensities because of dark noise (B). The lower dark noise of the cooled CCD allows it to function at the shot-noise limit at lower intensities until read noise dominates (A). The CCD camera saturates at intensities above 5 × 10⁶ photons/ms/0.2 % of the object plane (C)
6.2 The Optimum Signal to Noise Ratio
Because only a small fraction of the 1016 photons/ms emitted by a tungsten filament source will be measured, a signal to noise ratio of 108 (see above) cannot be achieved. A partial listing of the light losses follows. A 0.9 NA lamp collector lens would collect 10 % of the light emitted by a point source. Only 20 % of that light is in the visible wavelength range; the remainder is infrared (heat). Limiting the incident wavelengths to those which elicit a signal means that only 10 % of the visible light is used. Thus, the light reaching the preparation might typically be reduced to 1013 photons/ms. If the light-collecting system that forms the image has high efficiency e.g., in an absorption measurement, about 1013 photons/ms will reach the image plane. (In a fluorescence measurement there will be much less light measured because (1) only a fraction of the incident photons are absorbed by the fluorophores, (2) only a fraction of the absorbed photons reappear as emitted photons, and (3) only a fraction of the emitted photons are collected by the objective.) If the camera has a quantum efficiency of 1.0, then, in absorption, a total of 1013 photoelectrons/ms will be measured. With a camera of 10,000 pixels, there will be 109 photoelectrons/ms/pixel. The r.m.s. shot noise will be 104.5 photoelectrons/ms/pixel; thus the very best that can be expected is a noise that is 10−4.5 of the resting light (a signal-to-noise ratio of 90 dB). The extra light losses in a fluorescence measurement will further reduce the maximum obtainable signal-to-noise ratio.
Stay updated, free articles. Join our Telegram channel

Full access? Get Clinical Tree


