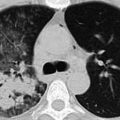
Fig. 3.1
Degeneration and necrosis of lung tissues and light lymphocyte infiltration HE staining
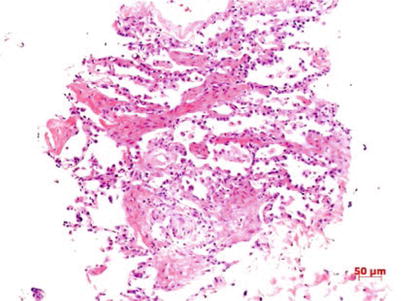
Fig. 3.2
Reactive proliferation of alveolar epithelium and fibrosis of pulmonary interstitium HE staining
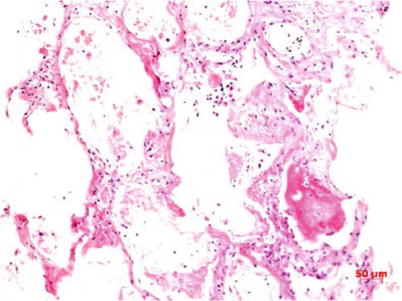
Fig. 3.3
Exfoliation of alveolar epithelia, and presence of reddish liquid, fibrin and slight amount of lymphocytes in pulmonary alveolar spaces. HE staining
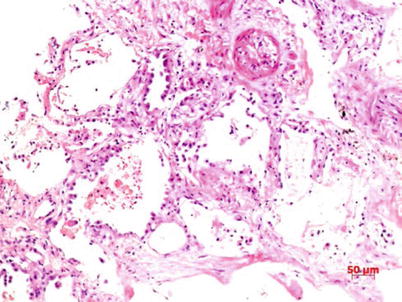
Fig. 3.4
Proliferation of lung epithelial cells, with partial exfoliations, and vascular occlusion HE staining
3.4.2.2 Immune Organs
Lymph Nodes
Lymphocytes decrease and scatters and lymph sinus is found dilated and with focal necrosis. Histiocytes proliferate accompanied by phenomenon of phagocytosis of the hemophagocytes and lymphocytes.
Spleen
The spleen presents with mild enlargement, smooth surface, and dark red color. Microscopy suggests extravasated blood, edema, atrophy of white marrow, and enlargement of red marrow. Peripheral to the white marrow is atypical lymphocytes. Part spleen sinuses are seen with slight inflammatory cell infiltration and histiocytosis accompanied by hemophagocytosis.
Bone Marrow
Bone marrow tissues are revealed with reactive histiocytosis and hemophagocytosis.
3.4.2.3 Other Main Organs
Cerebrum, Cerebellum, and Spinal Cord
The brain is unveiled with extravasated blood at the surface blood vessels and slight widening of gyrus. Microscopy visualizes wider spaces between the cerebrum, cerebellum, and spinal nerve cells and small blood vessels, as well as extravagated blood in blood vessels.
Heart
Cardiac chambers are found with dark-brown blood clots. Microscopy indicates degeneration of cardiocyte vacuole and cardiocytes with swelling and loss of striated patterns as well as partial pyknosis. Interstitium manifests light edema and extravagated blood in blood vessels.
Liver
The surface of the liver is smooth, grayish red, and with homogeneous section. The liver lobule presents normal structure, with slight hydropic degeneration and fat degeneration (Fig. 3.5) at liver cells and central necrosis. Interstitium is unveiled with light extravagated blood and part portal area with light lymphocyte infiltration.
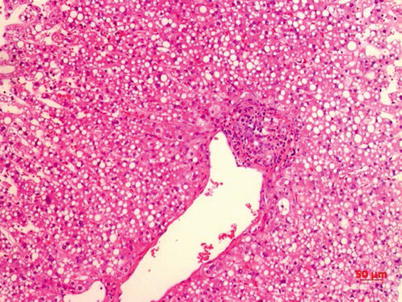

Fig. 3.5
Presence of lipid droplets at liver cellular plasma and slight lymphocyte infiltration at the portal area HE staining
Kidney
The kidney becomes swollen and the renal capsule is easily to be separated. The cortex and medulla are well demarcated with slight blood stasis at the latter. Under the microscope, multiple glomerular capillaries are seen with dilatation and blood stasis, and the renal tubules with necrosis. The blood vessels of renal interstitium are revealed with extravagated blood and thrombosis.
3.5 Laboratory Examination
Yuan Jing14
(14)
Organisation Name, City, Country
3.5.1 Blood Routine Examination
Patients with human avian influenza are characterized by decrease of the peripheral blood WBC count, particularly decrease of lymphocytes, which meanwhile is closely related with the occurrence of ARDS and mortality rate.
3.5.2 Blood Biochemical Examination
Creatine kinase, lactate dehydrogenase, aspartate aminotransferase, and alanine aminotransferase are mostly found elevated and so are C-reactive protein and myoglobin.
3.5.3 Virus Antibody and Virus Nucleic Acid Test
3.5.3.1 Immunofluorescence Test
Influenza viruses infect mainly the epithelial cells of respiratory tract. Positive experiment suggests that this patient or cultured subject has influenza virus and could directly conclude infection of the corresponding type or subtype of influenza virus. This experiment is superior in specificity and sensitivity, which are 5–10 times higher than direct immunofluorescence assay.
3.5.3.2 Colloidal Gold Test
The sample extract from the test kit is mixed with any clinical specimen to separate virus antigens, which are then dropped on the test membrane already adsorbed with alkaline phosphatase-labeled anti-influenza virus A nucleoprotein monoclonal antibody and substrate liquid. The thorough reaction between the antigen and antibody could develop color under the catalysis of enzymes.
This method is applicable to quantitative measurement of influenza virus A and B in nasal suction liquid, nasal scrubbing liquid, and laryngopharyngeal scrubbing liquid specimens.
3.5.3.3 Enzyme-Linked Immunosorbent Assay (ELISA)
Competitive block method is adopted to test H5 antibodies in the serum specimen. The coating monoclonal antibodies on the microwell plate of the agent kit are added with serum specimen and antigen reaction liquid, which forms “coating monoclonal antibody-antigen specimen antibody” complex. Then enzyme-marked antibodies are added. If the serum specimen could distinctly inhibit the combination of enzyme-marked antibodies with antigens, it suggests the presence of avian influenza H5 antibodies.
1.
Cutoff value: The Cutoff value = average negative control OD × 0.5
2.
Positive judgment: Sample OD value <Cutoff value indicates positive, and otherwise negative. Rise of serum H5 antibodies by four or above times in the early stage of onset and stage of recovery could serve as evidence for definitive diagnosis.
3.5.3.4 Nucleic Acid Test
Polymerase chain reaction (PCR), as a molecular biological assay, could test avian influenza virus nucleic acid in various specimens (blood, feces and excretion, respiratory secretions, and tissue secretions).
3.5.3.5 Virus Isolation
Chicken-embryo culture is a common method of viral culture which is simple to operate and easy to manage. It is very sensitive to orthomyxovirus, paramyxovirus, Poxvirus, and herpes virus and could be used to separate afore viruses from patient samples. The frequently used method for influenza virus is double chicken embryo allantoic cavity and amniotic cavity inoculation. If the chicken embryo dies after 24 h or HA test is positive, it indicates presence of viral infection and CF, IF, EIA, HI, and NT shall be conducted further for differentiation.
In case of diagnosis of suspected cases, both the titer of serum-neutralizing antibody in the acute and recovery periods shall be tested, which could establish diagnosis if the serum antibody level in latter is higher than that the former (≥4). In children, particularly those below 3 years old, the titer of serum influenza virus antibody increasing by two times holds diagnostic value.
3.6 Clinical Diagnosis
Yuan Jing15
(15)
Organisation Name, City, Country
3.6.1 Diagnostic Criteria
The diagnosis of human avian influenza could be derived based on epidemiological history, clinical manifestation, and laboratory examination results. If the epidemiological history is not clear, diagnosis of human avian influenza H5N1, H7N9, H10N8, and H5N6 could be reached according to clinical manifestations, supplementary examinations, and laboratory test results, particularly separation of avian influenza H5N1, H7N9, H10N8, and H5N6 from patient respiratory tract secretions; avian influenza virus H5N1, H7N9, H10N8, and H5N6 nucleic acid test positive; or avian influenza virus H5N1, H7N9, H10N8, and H5N6 specific antibody level in double serum samples 4 times or above higher by dynamic test.
3.6.2 Severe Human Influenza Diagnostic Criteria
The presence of any of the following five items could conclude diagnosis of severe human avian influenza:
1.
Dyspnea: The adult respiratory rate under resting state is ≥30 times/min concurrently with either following circumstance: (i) chest imaging suggests that multilobar lesions or foci occupy over 1/3 of the total area of both lungs on orthotopic film and (ii) conditions progress with lesions increasing by over 50 % and accounting for over 1/4 of total area of both lungs on orthotopic film within 40 h.
2.
Distinct hypoxemia: Oxygen inhalation at 3–5 L/min, arterial partial pressure of oxygen (PaO2) <70 mmHg (1 mmHg = 0.133 kPa), or pulse blood oxygen saturation (SpO2) <93 %, or already diagnosed as acute lung injury (ALI) or acute respiratory distress syndrome (ARDS). If the oxygenation index is below 300 mmHg (1 mmHg = 0.133 kPa), it could be diagnosed as ALI; and if the oxygenation index is below 200 mmHg, it could be diagnosed as ARDS.
3.
Occurrence of shock or multiple organ dysfunction syndrome (MODS).
4.
Occurrence of viral encephalitis.
5.
Infected children manifest Reye syndrome.
3.7 Chest Imaging Diagnosis
For imaging examination of human avian influenza virus pneumonia, CT possesses distinct advantages, which could contribute to accurate determination of the degree, extent, and site of lung injury and identify the meticulous dynamic changes of lesions via the high resolution of tissue density and adjustment of window breath and position to obtain more information about lesions than chest X-ray, therefore offering evidence for clinical diagnosis and treatment. Lung interstitial fibrosis is an important complication of this disease, and high-recognition CT (HRCT) can better visualize the subtle changes of pulmonary interstitial fibrosis, such as pulmonary lobular septum thickening, and subpleural curvature shadow, which could aid efficacy evaluation and prognosis estimation.
3.7.1 Chest Manifestations of Human Avian Influenza Virus Pneumonia
3.7.1.1 Early Phase of Onset
The incubation phase of patients with human avian influenza H5N1, H7N9, H10N8, and H5N6 is commonly 1–7 days, mostly 2–4 days, but may last 8 days in a few patients. After the incubation ensues, the early phase of the onset which generally prolongs 1–4 days. The initial symptom is fever with body temperature >38°C, and over half of the patients are accompanied with influenza-like symptoms such as chilliness, headache, soreness of joints and muscles, fatigue, dry and nonproductive cough, as well as chest pain. Chest X-ray or CT inspections may be manifested as (1) lobular septum thickening and acinar nodular shadows; (2) solitary or multiple patchy ground-glass shadows in the lungs and lesions mostly located at unilateral inferior lung lobe; and (3) patchy pulmonary consolidation shadows with air bronchogram in between or ground-glass shadows at the periphery or other long lobes (Figs. 3.3, 3.4, 3.5, and 3.6).
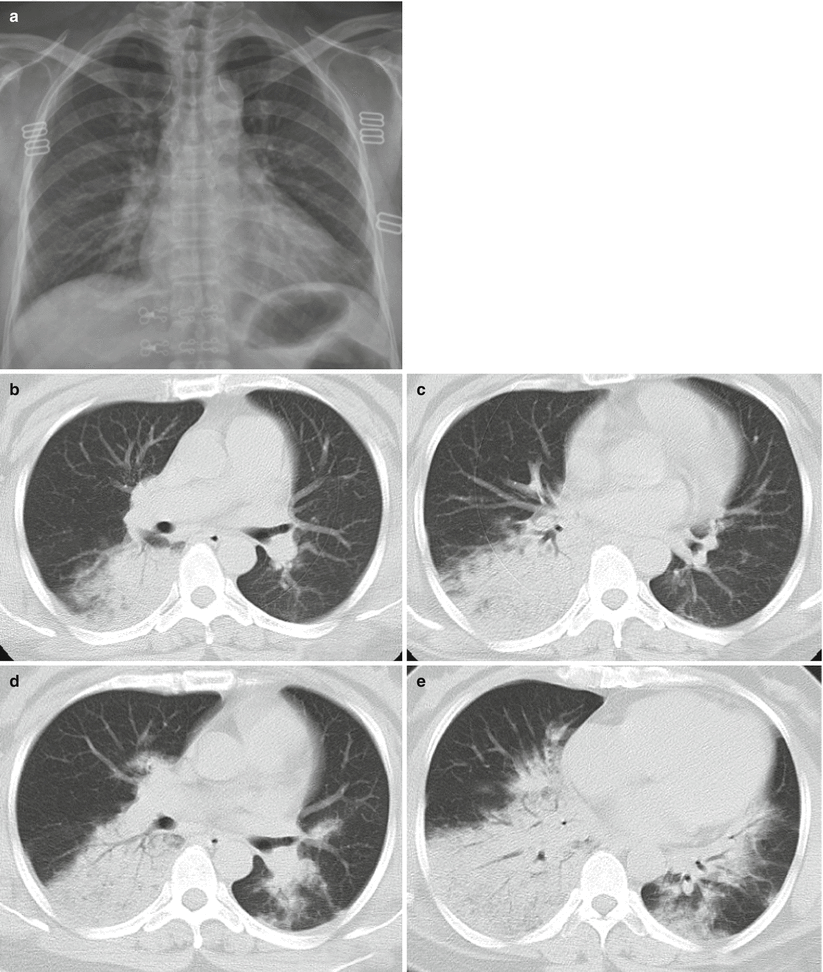

Fig. 3.6
(a–e) The female patient aged 39 years old is infected with avian influenza virus H7N9 pneumonia. (a) On 2nd day after onset, chest X-ray plain films of both lungs did not detect distinct abnormalities. (b, c) On 4th day after onset, chest CT scan visualized large patchy consolidation shadow at posterior basal segment of right lung inferior lobe, with air bronchogram in between. (d, e) On 6th day after onset, chest CT scanning revealed that the large patchy consolidation shadow at the right lung inferior lobe progressed notably and the basal segments of right lung middle lobe and left lung inferior lobe were observed with scattering plaque or large patchy consolidation shadows and ground-glass shadows at the periphery
3.7.1.2 Progression Phase
The lesions aggravate within 14 days after the onset in most patients. The patchy shadows of the early phase progress into large patchy, multiple, or diffusive lesions in 3–7 days. The lesions may extend from unilateral to bilateral lungs and from single lung lobe to multiple lobes. In progression phase, severe patients manifest multilobar lesions or lesions advancing by over 50 % within 48 h (Fig. 3.7).
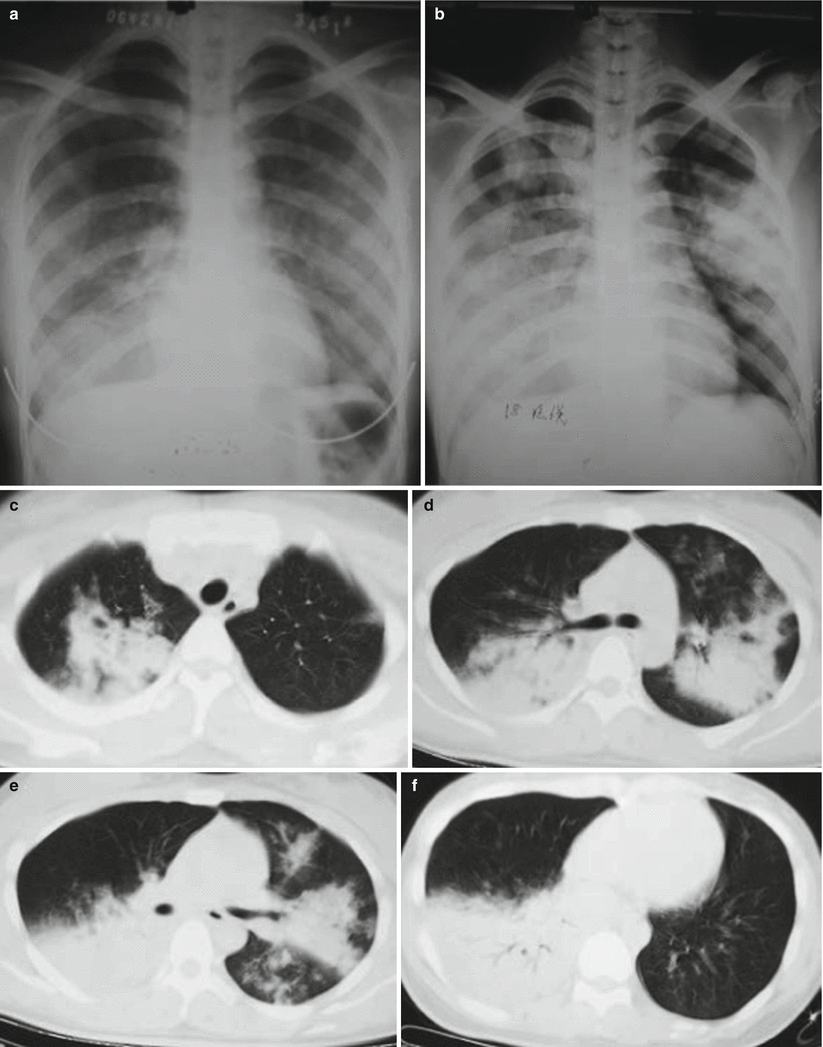

Fig. 3.7
(a–f) The female patient aged 26 years old was infected with avian influenza H5N1. (a) On the 6th day of the onset of the disease. Chest X-ray revealed large patchy ground-glass shadows at both middle and inferior lung fields and consolidation shadows at the right inferior lung. (b) On the 7th day of the onset of the disease. Chest X-ray unveiled rapid development of lesions, with the foci at both lungs enlarging distinctly. Extensive consolidation shadows were seen in both lung fields. (c–f) On the 7th day after onset of the disease. The CT lung window showed: The middle and inferior right lung lobe manifested large patchy consolidation shadows, with air bronchogram inside. The left lung was visualized with large patchy consolidation shadows and patchy ground-glass shadows
Chest Imaging Presentations
1.
Most frequently seen is large patchy consolidation shadows at the lungs, with air bronchogram inside; plaque-shaped consolidation shadows could also be seen, with foci distributed at lung lobes or lung segments or quasi-circular consolidation shadows of varying sizes observable (Figs. 3.3, 3.4, 3.5, 3.6, 3.7, and 3.8).
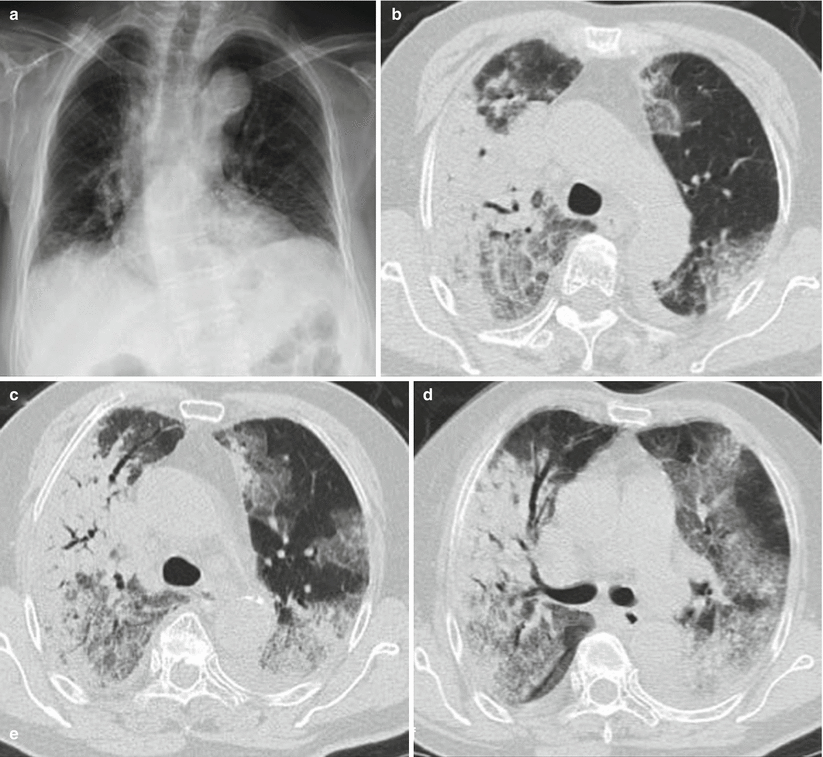
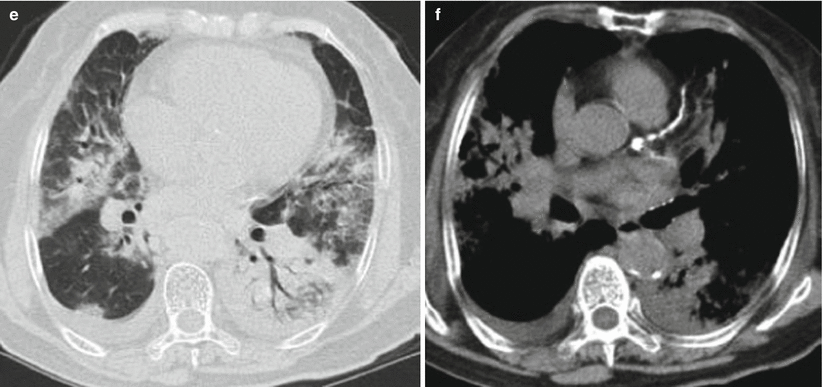


Fig. 3.8
(a–e) The female patient aged 82 years old was infected with avian influenza H7N9 pneumonia. (a) On the 4th day of the onset of the disease, chest X-ray visualized thickening of lung textures at both inferior lungs, but no distinct consolidation shadows inside the lungs. (b–e) On the 6th day of the onset of the disease, chest CT lung window viewed extensive ground-glass shadows and consolidation shadows at both lungs, with mainly consolidation shadows at the right lung lobes and air bronchogram observable. The left inferior lung was found with consolidation and left superior lung with mainly ground-glass shadows. (f) On the 6th day of the onset of the disease, chest CT longitudinal window indicated consolidation shadows at both lungs accompanied by slight effusions in the right thoracic cavity
2.
Lung consolidation shadows and ground-glass dense shadows appear concurrently, predominantly consolidation (Figs. 3.3, 3.4, 3.5, 3.6, 3.7, 3.8, and 3.9).
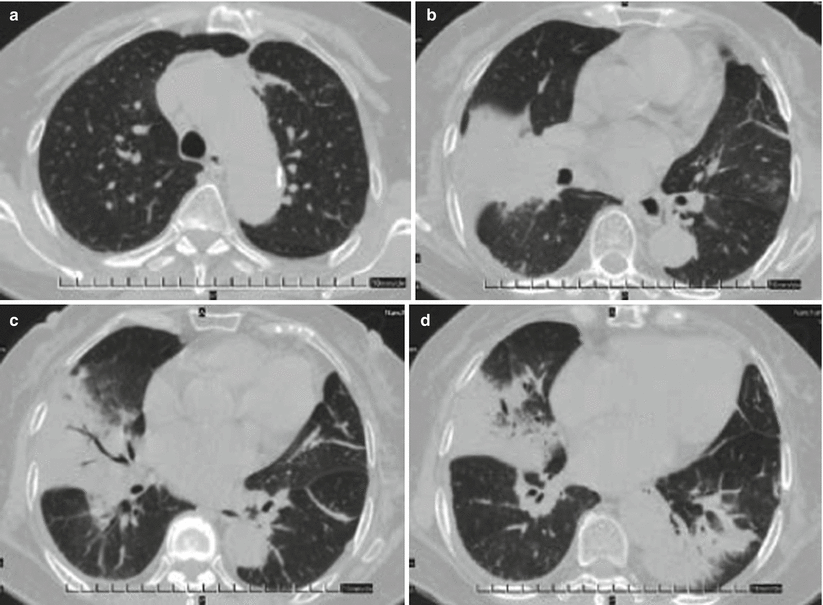

Fig. 3.9
(a–d) The female patient aged 73 years old was diagnosed with avian influenza H10N8 pneumonia and underwent chest CT on December 1, 2013 (on the 4th day of onset of the disease). (a) Beside the left superior lung aortic arc, patchy shadows of increased density were observed. (b) Right middle lung lobe was seen with large patchy consolidation shadows and left superior lung with patchy ground-glass-density shadows. (c) Right middle lung lobe was found with large patchy consolidation shadows, with air bronchogram in between, and left inferior lung with cord-shaped high-dense shadows. (d) Large patchy consolidation shadows were detected beside the right middle lung lobe and left lung lobe thoracic aortic arc
3.
Get Clinical Tree app for offline access

In severe cases, both lungs develop disseminated infiltration foci and ground-glass shadows observable at the anterolateral large patchy lung consolidation shadows, presenting ARDS changes (Figs. 3.3, 3.4, 3.5, 3.6, 3.7, 3.8, 3.9, and 3.10).
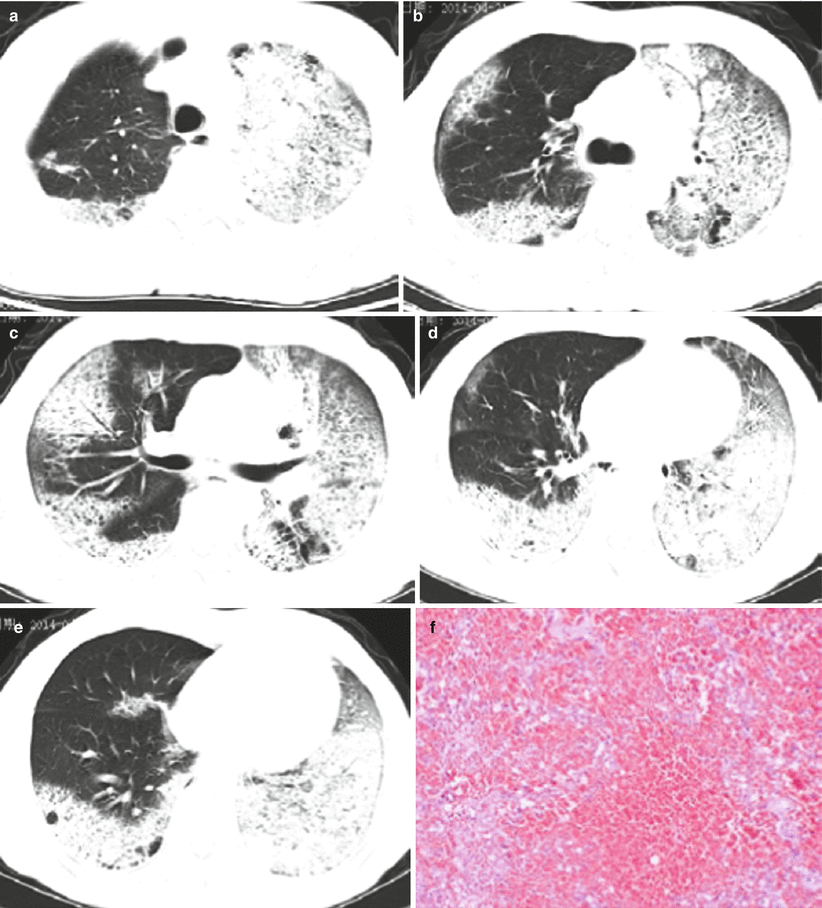
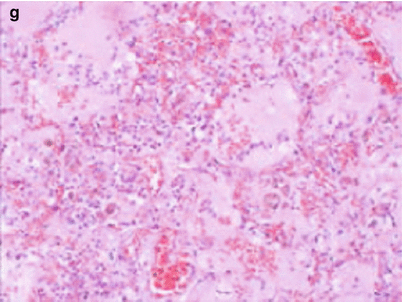


Fig. 3.10


(a–g) The 50-year-old male patient was confirmed with avian influenza H5N6 pneumonia and received chest CT on April 21, 2014 (the 8th day of onset). (a) The left superior lung was detected with large patchy high-density consolidation shadows and apicoposterior segment of right superior lung with patchy shadows at subpleural area. (b) The left superior lung was seen with large patchy high-density shadows with air bronchogram in between. The posterior basal segment of right inferior lung lobe and subpleural area of right superior lobe with high-density shadows. (c) The inferior layer of the protuberance was revealed with left lung consolidation shadows and right lung superior and middle lobes and the middle and lateral band of the posterior basal segment of right inferior lobe with patchy consolidation shadows. (d) For the venous layer of right inferior lung, left lung and right inferior lung were observable with large patchy consolidation shadows, and the subpleura of the right middle lung and right lingula with ground-glass shadows. (e) For the diaphragmatic layer, the subpleural area of posterior basal segment of right inferior lobe and left inferior lobe were seen with consolidation shadows, and the subpleural area of the posterior segment of right lung inferior lobe with multiple pulmonary bulla shadows. (f) Pulmonary interstitium and alveolar wall capillaries were unveiled with diffusive dilation and congestion accompanied with focal hemorrhage and part of the lung areas with obvious hemorrhage. (g) The alveolar cavities were filled with pinkish homogenous effusions, inflammatory cells, and fibrin
Stay updated, free articles. Join our Telegram channel

Full access? Get Clinical Tree


