; frame rate: 25 per cardiac cycle. Phase contrast imaging was also performed to measure the flow rate across the aortic valve.
Ventricular wall boundaries were extracted at early diastole when the LV pressure is lowest. Seven slices of short-axis views from base to apex were used for the LV chamber reconstruction, long-axis slices were selected for reconstructing the inflow (left atrium) and outflow (aorta) tracts. Following a manual segmentation, the wall boundaries were imported into SolidWorks (SolidWorks Corp., Waltham, MA USA) to generate the three dimensional geometry via B-spline surface fitting.
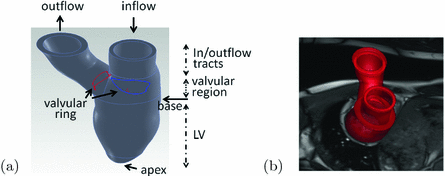
The rebuilt LV geometry is shown in Fig. 1. Notice that the geometries above the two valvular rings are not derived from the CMR images; they are the artificial extensions for applying flow boundary conditions. Since there is limited information on the organization of myocytes in the regions between the base and the two valvular rings (denoted as valvular region), only the region bellow the basal plane (referred to as the LV region) is modelled to have the active contractility. The valvular region, the inflow and outflow tracts, are assumed to only passively bear the load. A rule-based myocardial fibre generation method [13] was employed to model the fibre and sheet architecture of the myocardium inside the LV region. The fibre angle rotates from  to
to  from endocardium to epicardium, and the sheet angle rotates from
  to
to  .
.
 to
to  from endocardium to epicardium, and the sheet angle rotates from
  to
to  .
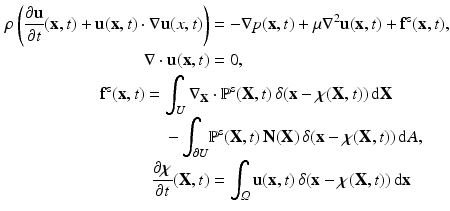
.IB/FE Formulation. The IB/FE description of the fluid-structure coupled system is given by the following equations [5].
 where
where  denotes the Eulerian coordinates,
  denotes the Lagrangian coordinates attached to the immersed solid.
  is the fluid density,
  is the fluid viscosity,
  represents the Eulerian velocity, and
  is the Eulerian pressure field.
  is a smoothed three-dimensional Dirac delta function,
  represents the Eulerian force density derived from the first Piola-Kirchoff stress tensor
  of the immersed structure. These equations express the conservation of the momentum and mass in the Eulerian form while using a Lagrangian description for the structural deformation and stress tensor.


 denotes the Eulerian coordinates,
  denotes the Lagrangian coordinates attached to the immersed solid.
  is the fluid density,
  is the fluid viscosity,
  represents the Eulerian velocity, and
  is the Eulerian pressure field.
  is a smoothed three-dimensional Dirac delta function,
  represents the Eulerian force density derived from the first Piola-Kirchoff stress tensor
  of the immersed structure. These equations express the conservation of the momentum and mass in the Eulerian form while using a Lagrangian description for the structural deformation and stress tensor.
Fig. 1.
Reconstructed LV model with inflow and outflow tracts (a) and superimposed with one short-axis CMR image (b). The geometry is divided into three parts: the LV region, the valvular region, and the inflow and outflow tracts.
The total Cauchy stress for the fluid-structure coupled system is
![$$\begin{aligned} \varvec{\sigma }(\mathbf{x},t) = -p \, \mathbb {I}+ \mu \left[ \nabla \mathbf{u} + \left( \nabla \mathbf{u}\right) ^{T} \right] + {\left\{ \begin{array}{ll} \varvec{\sigma }^{\text {s}}(\mathbf{x},t) &{} \text{ for } \mathbf{x}\in \text{ immersed } \text{ solid }, \\ \mathbf{0} &{} \text{ for } \mathbf{x}\in \text{ otherwise }, \end{array}\right. } \end{aligned}$$](/wp-content/uploads/2016/09/A339585_1_En_37_Chapter_Equ1.gif)
in which  is the structure-like Cauchy stress, and
  is the deformation gradient associated with the immersed structure and
  . To use standard
  FE methods for nonlinear elasticity, a weak formulation for the structure domain is employed [5].
![$$\begin{aligned} \varvec{\sigma }(\mathbf{x},t) = -p \, \mathbb {I}+ \mu \left[ \nabla \mathbf{u} + \left( \nabla \mathbf{u}\right) ^{T} \right] + {\left\{ \begin{array}{ll} \varvec{\sigma }^{\text {s}}(\mathbf{x},t) &{} \text{ for } \mathbf{x}\in \text{ immersed } \text{ solid }, \\ \mathbf{0} &{} \text{ for } \mathbf{x}\in \text{ otherwise }, \end{array}\right. } \end{aligned}$$](/wp-content/uploads/2016/09/A339585_1_En_37_Chapter_Equ1.gif)
(1)
 is the structure-like Cauchy stress, and
  is the deformation gradient associated with the immersed structure and
  . To use standard
  FE methods for nonlinear elasticity, a weak formulation for the structure domain is employed [5].
Myocardial Mechanics. We model the myocardial stress tensor as the summation of the active and the passive stress tensors, i.e.  . The myocardial passive response is described using an invariant-based strain energy function
![$$\begin{aligned} W = \frac{a}{2b} e^{[b(I_1-3-2\mathrm{log}(J))]} + \sum _{i=\mathrm{f},\mathrm{s}} \frac{a_i}{2b_i} \{e^{[b_i(I_{4i}^{\star }-1)^2]}-1\} + \frac{a_{\mathrm{fs}}}{2b_{\mathrm{fs}}}\{e^{[b_{\mathrm{fs}}(I_{8\mathrm{fs}})^2]}-1\}, \end{aligned}$$](/wp-content/uploads/2016/09/A339585_1_En_37_Chapter_Equ2.gif)
in which the invariants are  and
and  . Here
  and
and  are the initial fibre and sheet directions, and
  is the right Cauchy-Green deformation tensor. From which we derive
  , where
  is a constant to reinforce the incompressibility.
 . The myocardial passive response is described using an invariant-based strain energy function
![$$\begin{aligned} W = \frac{a}{2b} e^{[b(I_1-3-2\mathrm{log}(J))]} + \sum _{i=\mathrm{f},\mathrm{s}} \frac{a_i}{2b_i} \{e^{[b_i(I_{4i}^{\star }-1)^2]}-1\} + \frac{a_{\mathrm{fs}}}{2b_{\mathrm{fs}}}\{e^{[b_{\mathrm{fs}}(I_{8\mathrm{fs}})^2]}-1\}, \end{aligned}$$](/wp-content/uploads/2016/09/A339585_1_En_37_Chapter_Equ2.gif)
(2)
 and
and  . Here
  and
and  are the initial fibre and sheet directions, and
  is the right Cauchy-Green deformation tensor. From which we derive
  , where
  is a constant to reinforce the incompressibility.
The active tension is computed as  , in which T is determined from the active contraction model of Niederer et al. [10], and is a function of the fibre stretch
  , stretch rate
  , intracellular calcium transient, and contractility
  . The active stress is scaled using a constant
  , which enables the model to produce the realistic systolic dynamics. A simple model of intracellular calcium dynamics [8] is used to trigger the myocardial contraction uniformly and simultaneously inside the LV region.
 , in which T is determined from the active contraction model of Niederer et al. [10], and is a function of the fibre stretch
  , stretch rate
  , intracellular calcium transient, and contractility
  . The active stress is scaled using a constant
  , which enables the model to produce the realistic systolic dynamics. A simple model of intracellular calcium dynamics [8] is used to trigger the myocardial contraction uniformly and simultaneously inside the LV region.
Boundary Conditions and Implementation. The LV model is immersed in a  fluid box, with the inflow and outflow tracts attached to the top plane as shown in Fig. 2(a). The inflow and outflow tracts are fixed during the simulations using a tethering force, defined as
  , where k is the penalty parameter (taken to be 1.0e7 dyne/cm),
  and
and  are the desired and boundary positions, respectively. Since only the LV region can actively contracts, the longitudinal and circumferential displacements of the LV base are set to be zero, with the radial motion allowed. The reminder of the LV region is left free.
 fluid box, with the inflow and outflow tracts attached to the top plane as shown in Fig. 2(a). The inflow and outflow tracts are fixed during the simulations using a tethering force, defined as
  , where k is the penalty parameter (taken to be 1.0e7 dyne/cm),
  and
and  are the desired and boundary positions, respectively. Since only the LV region can actively contracts, the longitudinal and circumferential displacements of the LV base are set to be zero, with the radial motion allowed. The reminder of the LV region is left free.
An isotropic hyperelastic material model is used to describe the valvular region, with much lower stiffness than that of the LV region. The valvular and the LV regions overlap slightly ( 1 mm), which allows the valvular region to follow the LV basal motion. During the diastolic filling, we also impose a constrain so that the valvular region does not deform more than 6 mm, using a tethering force. When the LV starts to generate active tension (beginning of the isovolumetric contraction), the valvular region above the LV base is gradually pulled back to the original position within 40 ms using a tethering force, this will keep the valvular region in the place until the end of systole. This is because the valvular region as modelled is unable to generate active force to resist the systolic ventricular pressure.
 1 mm), which allows the valvular region to follow the LV basal motion. During the diastolic filling, we also impose a constrain so that the valvular region does not deform more than 6 mm, using a tethering force. When the LV starts to generate active tension (beginning of the isovolumetric contraction), the valvular region above the LV base is gradually pulled back to the original position within 40 ms using a tethering force, this will keep the valvular region in the place until the end of systole. This is because the valvular region as modelled is unable to generate active force to resist the systolic ventricular pressure.
To simulate the ventricular flow, different boundary conditions are applied in the four different phases of the cardiac cycle: (1) diastolic filling, (2) isovolumetric contraction, (3) systolic ejection and (4) isovolumetric relaxation. During phase 1, we apply the pressure directly to the endocardial surface of the LV region until it reaches the end-diastolic value (8 mmHg: population-based average value), and ensure that volumetric flow rate  in the outflow boundary
  , and zero pressure in the inflow boundary
  (
( ), as shown in Fig. 2(a). These are simplified boundary conditions to mimic the sucking effect of the rapid diastolic filling phase. During phase 2, we let
  . When the LV pressure is greater than the diastolic aortic pressure, phase 3 begins, and we set the diastolic aortic pressure to be the measured diastolic cuff pressure (85 mmHg) (taken from the brachial artery of the volunteer). During the systolic ejection, a three-element Windkessel circulation model [6] is connected to the outflow boundary as shown in Fig. 2(b). When
  approaches zero, indicating the closure of the aortic valve, we set
  , and disconnect the circulation model from the LV model. There is no flow at
  in the systole. During phase 4,
  .
.
 in the outflow boundary
  , and zero pressure in the inflow boundary
  (
( ), as shown in Fig. 2(a). These are simplified boundary conditions to mimic the sucking effect of the rapid diastolic filling phase. During phase 2, we let
  . When the LV pressure is greater than the diastolic aortic pressure, phase 3 begins, and we set the diastolic aortic pressure to be the measured diastolic cuff pressure (85 mmHg) (taken from the brachial artery of the volunteer). During the systolic ejection, a three-element Windkessel circulation model [6] is connected to the outflow boundary as shown in Fig. 2(b). When
  approaches zero, indicating the closure of the aortic valve, we set
  , and disconnect the circulation model from the LV model. There is no flow at
  in the systole. During phase 4,
  .
.Stay updated, free articles. Join our Telegram channel

Full access? Get Clinical Tree


