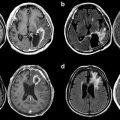
Fig. 5.1
Image registration measuring geometric variation between treatment planning and actual positioning prior to the start of treatment (blended images of planning CT and kV-CBCT images are shown)
Ideally, treatment beams should be directed only to the volume of the tumor without any margins such as setup margin, CTV or PTV margins; however, this is unrealizable, mainly because the patient’s movements, including physiological movements and unexpected movements of the tumor and patient, are unavoidable (Fig. 5.2). In addition, changes in the patient’s body contour could also be expected during the course of treatment, due to body weight loss, etc. Hence, it is necessary to add optimal margins surrounding the target tumor or organs, indicating that the treatment volume becomes larger than the actual tumor volume. The treatment planning can be done precisely to cover the volume of the tumor while keeping the dose to the normal tissues within acceptable level by evaluating the dose-volume histogram. However, the treatment plan is only a snapshot of a moment, no matter how precisely it is prepared. Therefore, it is necessary to keep in mind the discrepancies and limitations of treatment planning and the problems of daily treatment. In other words, the balance between tumor coverage and sparing of normal tissues is a trade-off, and IGRT provides an optimal and effective solution toward realizing ideal radiation therapy.

Fig. 5.2
(a) Differences in irradiated volumes according to the expansion of the rectum in the patients with prostate cancer. (b) Differences in irradiated volumes according to the deformation of the prostate gland and expansion of the rectum
IGRT is an effective tool for direct visual evaluation of the target tumor location in relation to the location of the landmark structures, such as bones, close to the target, which represent the target location or position. In addition, online correction of 3D positional gaps is also possible based on optimal image guidance. Thus, IGRT enables coverage of the treatment volume with less extra margins or volume even after providing for organ motion or patient setup errors, indicating that tumor can be covered by higher dose while allowing the surrounding organs to be spared (Fig. 5.3).

Fig. 5.3
Target coverage according to different width of the PTV margins. Compared to a situation shown in the left, the larger margin can provide safer for tumor coverage (prostate) during the treatment irradiation; however, organ at risk (rectum) receive more dose and it may increase the risk of side effect
The laser-setup technique is still used for non-IGRT. The tattoos and the markers on the patient’s skin as an indication of the isocenter are movable by 3–5 mm; therefore, the markers on the skin are not necessarily an accurate representation of the intended target position. However, the radiation therapists position the patient with the use of the correspondence between the point of the tattoos/markers and the position of the laser indicating the irradiation isocenter. Thus, extra margin for the uncertainties must be added in the treatment planning. This means that the setup margin should be increased for obtaining sufficient coverage of the target volume.
The dose distributions of IMRT with or without image guidance for prostate cancer are demonstrated in Fig. 5.4. The method used for image guidance is kV-cone-beam computed tomography (kV-CBCT). In the treatment plan made without image guidance, an additional 3 mm margin around the PTV is provided for as compared to the PTV margin in the treatment plan made with image guidance. Comparison between the treatment plans made with or without image guidance shows that utilization of image guidance allows the dose to the rectum and urinary bladder to be reduced, especially in terms of the area receiving less than 50 Gy, due to the effect of the reduced margin. Figure 5.5 shows a comparison of the dose volume histogram (DVH) between the treatment plans made with or without image guidance. The volume of the rectum receiving 60 Gy (V60 Gy) in the treatment plan with image guidance was 8 % and that without image guidance was 13 %. Similarly, V60 Gy for the urinary bladder in the plan with image guidance was 25 % and that without image guidance was 35 %. As described above, the utilization of image guidance contributes to reducing the PTV margin, resulting in dose sparing to the organs at risk. On the other hand, complicated dose distribution, such as concave-shaped dose distribution, and the higher-dose gradient of IMRT are susceptible to geometric uncertainties as compared to the case in conventional radiation therapy techniques. We need to pay attention to the balance between the benefit of obtaining a reduced margin and the geometric uncertainties of IMRT.


Fig. 5.4
Dose distributions in IMRT with and without image guidance for localized prostate cancer
Fig. 5.5
Comparison of the DVH between the treatment plans prepared with and without image guidance for localized prostate cancer
Furthermore, the accuracy and effectiveness of image guidance are influenced by the imaging modalities used. The contrast and resolution of images differ according to the imaging modality used, and low contrast or insufficient resolution cause difficulties in the image registration, resulting in discrepancies between the distance in the treatment plan and the actual treatment positions. Therefore, medical physicists must perform quality assurance for the imaging devices, the computer program used for registration, and the accuracy of the couch table movement. It is indispensable for radiation oncologists and radiation technologists to understand the characteristics and limitations of these imaging devices.
Currently, 2D kV imaging and 3D kV-CBCT are commonly available clinically as imaging modalities. 2D kV images are easier to acquire than CBCT with less radiation exposure dose. The main advantages of CBCT are that it enables identification of both bony structures and soft tissues, in contrast to the planer X-ray images in which soft tissues are difficult to visualize [1]. Soft tissue structures, such as tumors in the prostate and lung, not only move away from the intended position relative to the isocenter but also change in shape during the course of treatment because of physical expansion of the intestines or respiratory movements. Therefore, volumetric CBCT registration would be better than 2D bony structure registration [2–5].
5.3 Image Guidance System for IGRT
5.3.1 Megavoltage (MV) Imaging and MV Cone-Beam Computed Tomography (CBCT)
Electronic portal imaging devices (EPIDs) generate 2D images for portal verification of the radiation field as well as verification of the patient positioning [6]. There are a variety of EPID types, including liquid-filled (Li-Fi) EPID, camera-based EPID, and amorphous silicon (a-Si) EPID. Among these, a-Si EPID is the most commonly used in clinical practice [7, 8]. The EPID is equipped with the treatment machine where the therapy beam is along with (Fig. 5.6). In regard to the advantages and disadvantages of using EPIDs for image guidance, the contrast resolution of an EPID is lower than that of kV imaging [9]; however, the accuracy in matching the EPID images is usually excellent, reported to be on the order of 1 mm or 1° from a phantom study performed using (semi-) automated matching software [5, 10, 11]. On the other hand, large intra- and interobserver variations exist in the interpretation of images in image registration using an EPID [12–15]. Usage of an EPID can provide positional information regarding whether the target volume is properly covered or not even during treatment with respiratory or physiological movements of target tumors or organs.


Fig. 5.6
2D MV image (b) and 3D MV-CBCT image (c) using a Linac with an on-board MV imaging system (a)
MV-CBCT imaging can generate 3D images using the EPID. During rotational irradiation of the MV beam using relatively low exposure, projection images can be acquired automatically and the CBCT images subsequently reconstructed. The main disadvantages of using MV beam energy for the acquisition of volumetric images are the degraded quality of the images and increased radiation exposure of the patients due to increased Compton scatters. An important benefit of MV-CBCT is the high resolution of the acquired images despite the presence of dense metal objects such as hip prostheses or high-Z dental enamels [16]. When MV-CBCT was applied clinically, the absorbed dose in the irradiated area was about 5–9 cGy according to the anatomical site, thickness of the patient’s body or the irradiated volume, and the maximum dose was between 9 and 17 cGy [17]. In MV-CBCT images, the bony anatomy and 3D boundaries between the soft tissues and bony structures can be easily identified, and image registration can also be carried out easily with low-dose exposure. However, the dose required for identifying soft tissue boundaries, such as those of the prostate gland, urinary bladder, rectum, etc., would increase [17].
5.3.2 kV Imaging and kV-CBCT
2D kV imaging using an on-board imager installed in the treatment machine is an effective method to evaluate setup errors precisely and adjust the patient’s position properly. The kV imaging system consists of a conventional X-ray tube and amorphous silicon X-ray detectors mounted orthogonally to the treatment beam axis (Fig. 5.7). The X-ray tube and detectors are retractable during treatment. The advantages of kV imaging over MV imaging for the correction of setup errors include not only lower dose exposure but also smaller interobserver variability, which allows improved reproducibility of the patient’s setup [18].


Fig. 5.7
2D kV image (b) and 3D kV-CBCT image (c) using a Linac with an on-board kV imaging system (a)
kV-CBCT imaging is performed during rotational irradiation of a kV beam and simultaneous acquisition of projection images. The kV-CBCT images are reconstructed from the projection images produced by the retractable X-ray tube and the detectors; the image contrast in kV-CBCT is generally superior to that in MV-CBCT [19, 20]. CBCT has the advantage of having the ability to detect soft tissues, which enables improved accuracy of setup of the patients, accompanying rapid 3D image registration, as compared to MV-CBCT. However, streak artifacts caused by high-Z materials are found in kV-CBCT images because of significant photon attenuation as compared to the case in MV-CBCT images.
5.3.3 CT-on-Rails
CT-on-rails is defined as a diagnostic CT scanner installed in the treatment room for the purpose of verification of patient positioning (Fig. 5.8). The gantry of the CT-on-rails scanner can move across the patient, instead of the couch moving. The CT-on-rails scanner moves in line with the couch orientation and yields CT images, while the patient remains in the treatment position before or after the treatment. Diagnostic-quality CT images can be obtained by CT-on-rails, because the CT scanner installed in the CT-on-rails was originally developed for diagnostic radiology. Therefore, usage of CT-on-rails as a tool for image guidance may be expected to improve the accuracy of detection of soft tissue lesions, including the target tumors or organs, and reduce the interobserver variations in image registrations [21, 22]. However, several disadvantages of CT-on-rails have also been pointed out. From the structural basis of CT-on-rails, the CT scanner and the treatment machine need to be operated independently, because the CT-on-rails does not share the same gantry. These systematic limitations may cause the uncertainties in the following: (1) the patient couch position after a rotation, (2) the precision of the CT coordinates, and (3) alignment of contours with structures in the CT images. In addition, there is sometimes a vital time lag between the actual treatment and the image acquisitions for image guidance, resulting in unexpected movement of the patients during the time lag and impairment of the setup accuracy [23].

Fig. 5.8
3D CT image (b) using CT-on-rails system (a)
5.3.4 2D kV Stereoscopic Imaging
2D kV stereoscopic imaging allows measurement of 3D geometric variations with 2 kV X-ray tubes and the corresponding X-ray detectors in which the two X-ray beam axes are crossed at a certain point (Fig. 5.9). Two kV 2D images are acquired from a patient, and subsequently, two sets of 2D coordinates of geometric variations from the two images can be converted to the 3D variation.

Fig. 5.9
2D kV stereoscopic imaging systems. (a) The CyberKnife system. (b) The Novalis Linac system with the ExacTrac imaging system. (c) Real-time tumor-tracking radiotherapy system
Here, we introduce three commercially available systems. The CyberKnife system consists of a compact linear accelerator mounted on a robotic arm. The manipulator arm is controlled to direct the radiation beams to the region of the beam intersection of the two orthogonal X-ray imaging systems integrated to provide image guidance during the treatment. The ExacTrac system uses the optical positioning system and two sets of kV imaging systems to enable patient positioning during the treatment. The optical positioning system is used for the initial patient setup as well as the couch motion control. In addition, the system can manage the patient’s respiration and gated beam irradiation. The X-ray imaging system is used for verification of the patient’s position and readjustment using the internal anatomy or implanted fiducial markers on the images. The accuracy of positioning using the optical guidance is on the order of submillimeters [24]. The real-time tumor-tracking system was designed to track the targets using fiducial markers implanted in or close to the tumors in real time. The system consists of two X-ray cameras mounted in the ceiling and two X-ray tubes on the floor. The system has been used clinically for lung and liver tumors [25–29] and reduced tumor motion to less than 5 mm [26]. The real-time tumor-tracking system has been applied for the treatment of prostate cancer, and it has been shown that hypofractionated IMRT (2.5 Gy × 28 fr = 70 Gy, equivalent to 80 Gy at a daily dose of 2.0 Gy) can be administered safely and provides a reasonable biochemical control rate [30].
5.3.5 Video-Based 3D Optical Surface Imaging
During treatment, the video-based 3D optical surface imaging system can generate 3D models of the patient surface using photogrammetry [31–34], and then the system evaluates and quantitates the difference in the positional gap between the planned 3D models of the patient as the reference and the observed surface models [35] (Fig. 5.10). The major advantages of the video-based 3D optical surface imaging system, as demonstrated in a phantom study, are that it provides accurate and reproducible image guidance on the order of submillimeters [36]. In addition, the optical surface imaging system allows for continual monitoring of the patient surface without any radiation exposure during the actual treatment. In regard to its clinical applicability, the video-based 3D optical surface imaging system is especially useful as an image guidance system for radiation therapy of breast cancer, because the breast surface is nonrigid, and alignment of the 3D breast surface achieved by using this system yields greater breast correspondence than that obtained with laser or portal imaging systems [31].

5.3.6 Ultrasound (US) Imaging
US images of the target tumors or organs are acquired before the start of treatment and the integrated computer software program overlays the planned contours of the target tumors or organs such as the prostate gland, which are delineated at the treatment planning, over the acquired US images (Fig. 5.11). Subsequently, adjustments of the patient’s position are performed to align the contours to the targets while monitoring the actual target position on the US image. The advantages of US imaging as an image guidance system are as follows: (1) no radiation exposure, (2) noninvasive image guidance, (3) excellent visualization of soft tissues, (4) relatively rapid acquisition of images, and (5) low cost, including the entire system. The first commercially available US imaging system was the BAT system (North American Scientific, USA), which can provide 3D information of the target based on two US images. Subsequently, a 3D US imaging system was developed (SonArray, Zmed Inc., USA) so as to overcome the limitations of the former system. Currently, the US imaging system is mostly used for image guidance in radiotherapeutic approaches for localized prostate cancer. The disadvantage of US image guidance is that it is partly dependent on the user’s experience and expertise, resulting in high inter-user variability and reduced accuracy relative to CBCT guidance with or without fiducial markers. The US imaging systems that are currently in use clinically calculate the required shift, but do not allow for automated correction of the treatment couch. This results in a compromise of accuracy and prolongation of the treatment time. Other limitations of the US imaging system are forced movement or deformation of the target tumors or organs by the external pressure of the US probe during the acquisition of images and also non-visualizability of the target tumors or organs located behind bony structures [37].

Fig. 5.11
US imaging system
5.3.7 Electromagnetic Tracking Systems
The Calypso system (Varian Medical Systems, USA) can track the locations of target tumors or organs in real time by using tiny electromagnetic transponders implanted within the tumor before the treatment (Fig. 5.12). Upon excitement of the system, the transponders yield radiofrequency waves, and the detection of radiofrequency waves by the receiver activates analysis of the location of the transponders. The transponders are implanted by an invasive method; however, the system provides real-time tracking of the target during the treatment with no radiation dose delivered for imaging. The system has been demonstrated in some studies to show interfraction localization within 2 mm of the X-ray-based positioning [38, 39].

Fig. 5.12
Electromagnetic tracking system (http://www.varian.com/asjp/oncology/imaging_solutions/calypso/)
5.3.8 Magnetic Resonance Imaging (MRI)
MRI-based radiation therapy systems include MRI imaging and treatment beam delivery in the same room, and both radiation therapy and monitoring of the target location in 2D/3D can be performed in real time using MRI simultaneously (Fig. 5.13). The main advantage of MRI for image guidance is that it provides high contrast of soft tissues, yielding clear detection of the boundary between the target tumor and the surrounding normal tissues, and the modality does not entail radiation exposure. However, the clinical usefulness of a linear accelerator equipped with an MRI imaging system is still under investigation [40–49]. The cobalt irradiation system with MRI (Viewray, USA) is already available commercially.

Fig. 5.13
Radiotherapy machine equipped with an MR imaging system. (a) System from the University Medical Center Utrecht, Netherlands (http://medicalphysicsweb.org/cws/article/research/51279). (b) System from the Cross Cancer Institute, the University of Alberta (http://www.mp.med.ualberta.ca/linac-mr/)
5.4 Concept of Margin in IGRT
The PTV covers the CTV plus a margin, considering geometric uncertainties. Larger margins are associated with unnecessarily higher doses to normal organs surrounding the target; however, an insufficient margin would result in a less-than-optimal dose to the CTV. Thus, an adequate PTV margin setting is essential to obtain satisfactory outcomes of radiation therapy.
Patients’ geometric displacements correspond to the differences between a reference image, such as digital reconstructed radiograph (DRR) or CT simulation images, and a comparative image acquired pretreatment and posttreatment, such as with EPID, CBCT, etc. In the other words, the geometric displacements can be represented as deviations between the intended treatment plan and the geometry of the actually irradiated area. The displacement can be divided into two types of errors: systematic and random errors. Systematic errors, denoted as Σ, refer to differences in the mean irradiation geometry in fractionated treatment from the geometry in the treatment plan. Random errors, represented by σ, may occur by chance and may be due to day-to-day variations, including organ motions and patient movements during the treatment. The margin computation methods have been reported previously [50, 51]. This textbook introduces a margin recipe from J. C. Stroom [51].

The margin computation is retrospectively performed from the results of the patients’ treatments. When planning treatment for a particular patient, the geometrical errors that the patient will experience in future are not known. However, the measured uncertainty data in a group of similar patients who have been treated previously may be available. The systematic error is represented as the patient-to-patient variation in the systematic deviation from the planning situation. The systematic error is the standard deviation of the mean values for the patients in the group. The random error is the mean of the observed random standard deviations for the patients in the group [5]. Table 5.1 shows an example of geometric deviations along the x-axis for the patients in a group.
Table 5.1
Results of margin calculation using geometric deviations in five patients receiving RT with and without image guidance
Patient | IGRT | Day 1 | Day 2 | Day 3 | Day 4 | Day 5 | Mean | SD | ||||||||||
|---|---|---|---|---|---|---|---|---|---|---|---|---|---|---|---|---|---|---|
Pre- | Post- | Total | Pre- | Post- | Total | Pre- | Post- | Total | Pre- | Post- | Total | Pre- | Post- | Total | ||||
No. 1 | w/o | 2.7 | N/A | 2.7 | 3.6 | N/A | 3.6 | −4.2 | N/A | −4.2 | 1.7 | N/A | 1.7 | 2.5 | N/A | 2.5 | 1.3 | 3.1 |
w/z | 0.0 | 0.5 | 0.5 | 0.0 | 1.6 | 1.6 | 0.0 | −0.2 | −0.2 | 0.0 | −1.2 | −1.2 | 0.0 | 1.5 | 1.5 | 0.4 | 1.2 | |
No. 2 | w/o | −2.0 | N/A | −2.0 | 0.6 | N/A | 0.6 | −1.4 | N/A | −1.4 | −2.0 | N/A | −2.0 | −2.6 | N/A | −2.6 | −1.5 | 1.2 |
w/z | 0.0 | −0.5 | −0.5 | 0.0 | 0.7 | 0.7 | 0.0 | 0.2 | 0.2 | 0.0 | 0.2 | 0.2 | 0.0 | 0.5 | 0.5 | 0.2 | 0.5 | |
No. 3 | w/o | −2.7 | N/A | −2.7 | −2.3 | N/A | −2.3 | −3.1 | N/A | −3.1 | −2.0 | N/A | −2.0 | 1.3 | N/A | 1.3 | −1.8 | 1.8 |
w/z | 0.0
Related posts: Principles of IMRT Principles of IMRT
 Sequelae of Therapy of Head and Neck Cancer: Their Prevention and Therapy Sequelae of Therapy of Head and Neck Cancer: Their Prevention and Therapy
 Pediatric Cancers Pediatric Cancers
 Treatment Planning of IMRT for Head and Neck Malignancies Treatment Planning of IMRT for Head and Neck Malignancies
 Brain Tumor: How Should We Manage Glioblastoma in the Era of IMRT? Brain Tumor: How Should We Manage Glioblastoma in the Era of IMRT?
 Postoperative Intensity-Modulated Radiation Therapy for Head and Neck Cancers: A Case-Based Review Postoperative Intensity-Modulated Radiation Therapy for Head and Neck Cancers: A Case-Based Review
Stay updated, free articles. Join our Telegram channel
Full access? Get Clinical Tree
 Get Clinical Tree app for offline access

| |||||||||||||||||