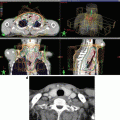
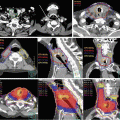
Fig. 4.1
Delineation of the target volumes using FDG-PET/CT and MRI. An advanced nasopharyngeal carcinoma showing extensive infiltrations to the skull base and the clivus. (a) and (b) The FDG-PET/CT fusion images for delineation of CTV/PTV. The physiological uptake in the brain considerably disturbed the determination of the extent of tumor near the skull base region. (c) The T1-weighted MRI well visualized the tumor infiltration to the skull base and even into the right carotid canal as the gadolinium-enhanced areas. In this case, MRI is the most useful for delineation of CTV/PTV in combination with CT in bone window. (d) The dose distributions in an initial plan of two-step IMRT. Because of overlapping of the PTV and the ventral portion of the brainstem, CTV-to-PTV margins at this region were reduced up to 2 mm

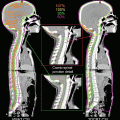
Fig. 4.2
A case of nasopharyngeal carcinoma with lymph node metastasis. (a) The T1-weighted MRI with gadolinium enhancement clearly demonstrated the extensive extracapsular invasions of the bulky nodal metastasis in a case of nasopharyngeal cancer before IMRT. (b) The initial plan to the large field included both the clinically detectable tumors and the elective regions. (c) The boost plan to the high-dose boost volume on the CT at the dose of 36 Gy. Please note the marked volume changes of both the lymph node volumes and the body contours during IMRT with concurrent chemotherapy. Thus, a two-step IMRTplanning is a useful means for an adaptive planning strategy
For prostate IMRT, MRI is superior to CT for defining of the prostate apex for targeting and the erectile tissues for sparing purposes [23–26]. Furthermore, the location of a dominant lesion in the prostate could be well predicted using multiple MRI parameters, including diffusion-weighted, dynamic contrast-enhanced, T2-mapping, and 3D spectroscopic MR images for high-dose intraprostatic boosting using IMRT [27, 28].
4.2.1.2 GTV Delineation Using Functional Imaging
18Fluorodeoxyglucose positron emission tomography (FDG-PET) has been applied increasingly to radiation treatment planning to increase the accuracy of GTV delineation besides the staging work-up. FDG-PET may be expected to visualize the “true” pathological tumor volume or reflect the “actual” tumor burden depending on the levels of glucose metabolism. Interestingly, several studies showed that PET-based GTV (PET-GTV) was often smaller than the CT- or MRI-based GTVs [29–31]. Daisne et al. showed that the macroscopic GTVs in surgical specimens were even smaller than GTVs obtained using FDG-PET, suggesting that all imaging modalities overestimate GTV. However, when examined in detail, all imaging modalities underestimated the actual tumor extent, particularly in terms of the small mucosal and submucosal infiltration of pharyngolaryngeal squamous cell carcinomas in specimens [29]. Therefore, the importance of clinical examinations for determining GTVs should be emphasized.
Unlike CT and MR images, in which the tumor has well-defined margins, it should be noted that the extent and the size of PET-GTV is highly dependent on the display windowing. Different studies have suggested various methods to determine the outline of PET-GTV, such as using the threshold of 2.5–4 of the standardized uptake value (SUV), 20–50 % of the maximal SUV, or the multiple-threshold methods [20, 31–33]. However, a standardized technique for contouring PET-GTV is still not available, and a universal standard may be impossible to establish because FDG uptakes can vary among individual tumors depending on their histological type and differentiation grade and the expression of metabolic enzymes. Moreover, PET-GTV delineation can be challenging because certain areas can be FDG avid, particularly in head and neck regions such as the tonsils and the base of the tongue, skeletal muscles, the thyroid gland, the brain, and parotid glands (Fig. 4.1a). Despite these limitations, some authors have attempted to validate the automatic segmentation of GTVs on FDG-PET using objective and user-independent methods. For example, Gregoire et al. [16] reported the use of automatically delineated PET-GTV in a dose escalation trial. In contrast, Eisbruch et al. proposed using a composite of CT-GTV and PET-GTVs [34, 35]. This proposal has been supported by several studies suggesting that local recurrences are not always detected within PET-GTVs [35, 36]. Therefore, FDG-PET should not be used as the sole modality for GTV definition, and high-risk GTV volumes could be defined based on all available information from the findings of CT, PET/CT, MRI, and physical examination.
Functional imaging using PET with various tracers could be also used to define subvolumes within GTV depending on specific biological factors. A partial dose escalation with IMRT may be attractive if we could consistently define certain subvolumes that are at a high risk of failure due to tumor hypoxia, high clonogen density, or the cell proliferation rate [37]. For example, the use of 18F-fluoromisonidazole (FMISO) PET-guided IMRT dose painting was proposed to potentially overcome the radioresistance of hypoxia in head and neck cancers [38]. However, hypoxia imaging using FMISO-PET showed significant spatial variability when repeated sessions were performed either before or during therapy; this finding suggests that reoxygenation and dynamic changes occur at the locations of tumor hypoxia [39, 40]. Thus, GTV segmentation methods using functional imaging are appealing but are still being investigated.
4.2.2 Clinical Target Volume (CTV)
As described in ICRU 83, CTV is the volume of tissue that contains a demonstrable GTV and/or subclinical malignant disease with a certain probability of occurrence that is considered relevant for therapy. However, there is no general consensus regarding what probability is considered relevant for therapy. Based on clinical judgment, a possibility of microscopic disease typically over 5–10 % would be assumed to require treatment. The concepts of subclinical malignant disease suggest the possibility of both microscopic extension outside GTV and the potential involvement of regional lymph nodes, which are usually undetectable by clinical examinations or using any imaging modalities.
CTV may be created practically by adding margins (5–10 mm) to GTV, although these margins should be tailored based on anatomical and pathological considerations. Particularly, in head and neck tumors, a thorough understanding of the complex regional anatomy is required, including knowledge of the cervical compartments and fasciae that are barriers to tumor extension. Different head and neck primary tumors also exhibit a variety of spread patterns and biological behaviors. Therefore, the delineation of CTV is currently based on clinical experience and oncological considerations. Consensus guidelines and recommendations [12–18] have been proposed to help standardize the target volume selection and delineation of head and neck tumors. A 2013 update by Gregiore et al. [14] clearly illustrated several node groups not considered previously, including the supraclavicular, retroauricular, occipital, buccal, and parotid nodes. They have also shown that translation from the node levels to CTV delineation may need some adjustments. In terms of the risk of extracapsular extensions (ECEs), two previous studies reported that ECEs were limited to within 5 mm of nodes <3 cm at their largest diameter in 96 % of cases and were always within less than 10 mm [41] or that ECEs were always within 8 mm range [42]. In cases with larger lymph nodes, CTV delineation may need to consider that expansion from the nodal GTV may be limited by the surrounding structures, such as the sternocleidomastoid muscle, the paraspinal muscles, or the parotid gland. The proper implementation of these guidelines in daily practice will require common sense and good knowledge of anatomy and oncology, which could result in a reduction in treatment variations.
4.2.3 Planning Target Volume (PTV)
PTV is a geometrical concept that was introduced for treatment planning and evaluation. It is a recommended tool to shape dose distributions to ensure that the prescribed dose will actually be delivered to all parts of CTV at a clinically acceptable probability despite geometrical uncertainties such as organ motion and setup variations. The delineation of GTV and CTV is based on anatomical and oncological considerations and is independent of the irradiation technique used. In contrast, the delineation of PTV is dependent on the technique used and is part of the treatment prescription.
ICRU 83 [11] emphasized that the delineation of the primary PTV margin should not be compromised even in cases when PTV encroaches or overlaps with other PTVs, OARs, or PRVs. Developments in treatment planning software now make it possible to manage dose distributions using priority rules during optimization. Alternatively, PTV could be subdivided into regions with different dose prescriptions. Such methods may be often applicable to IMRT optimization for head and neck cancers. In some cases, PTV extends close to or even outside the patient’s skin because of tumor invasion or added margins. Most dose computation algorithms cannot accurately compute the absorbed dose in buildup regions. To overcome this limitation, ICRU 83 provided possible solutions such as PTV subdivisions and relaxation of the absorbed-dose objectives for planning.
4.2.4 Organs at Risk (OAR)
OAR or critical normal structures are tissues that, if irradiated, could suffer significant morbidity and thus may influence treatment planning and/or the absorbed-dose prescription. In principle, all nontarget tissues could be OARs. However, normal tissues that are considered typically as OARs depend on the location of CTV and/or the prescribed absorbed dose.
From a functional perspective, OARs have been divided conceptually into “serial” and “parallel” organs [43]. In serial OARs such as the spinal cord, the integrity of each functional subunit with a serial architecture is critical to organ function, and the inactivation of any individual subunit results in dysfunction of the whole organ. In parallel OARs such as the parotid gland, independent functional subunits are organized with a parallel architecture, and it is assumed that no complication will occur until a sufficiently large number of functional subunits have been eliminated, in so-called volume effects. This concept of tissue organization is operationally useful for determining dose–volume constraints. In principle, for serial OARs showing a threshold binary response, the maximum dose in a given volume is typically the best predictor of complications. In contrast, for parallel OARs showing graded absorbed-dose responses, the mean dose or the volume that receives excessive doses of a defined value has been used to predict complications [44].
For establishing normal tissue complication probability (NTCP) models, Emami et al. reported the tolerance dose for irradiation of one-third, two-thirds, or the whole of various organs [45]. Burman et al. provided fits to Emami’s consensus dose–volume data using a Lyman model [46]. In addition, Kutcher et al. proposed a dose–volume histogram (DVH) reduction algorithm analysis that enabled the extrapolation of Emami’s constraints to any dose distribution [47]. These mathematical methods amounted to a common formula that introduced the generalized equivalent uniform dose (EUD). The resulting Lyman–Kutcher–Burman model remains the most widely used NTCP model, although it is not always the best model that should be considered [48–50]. Recently, the Qualitative Analyses of Normal Tissue Effects in the Clinic (QUANTEC) has provided a critical overview of current knowledge of the quantitative dose–response and dose–volume relationships for clinically relevant normal tissue endpoints, and QUANTEC provided practical guidelines that enabled radiation oncologists to reasonably categorize toxicity risk based on dose–volume parameters or the results of models for a number of treatment sites [51, 52]. Information provided by QUANTEC is not currently ideal, and continued adjustments and validations should be necessary after the release of further clinical data regarding dose–volume modeling [53–56].
4.2.5 Planning Organ-at-Risk Volume (PRV)
Similar to PTV, uncertainties and variations regarding the position of OAR during treatment must be considered to avoid serious complications. For this reason, margins have to be added to OARs to compensate for these uncertainties and variations using similar principles as those used for PTV, which defines PRV.
A margin for serial OAR is much more critical than that for parallel OAR. It should be noted that the delineation of PTV and PRV often results in one or more overlapping regions. To ensure a sufficient sparing of normal tissue, the use of priority rules in the planning system for PTV or PRV can be subdivided into regions with different dose constraints. Nevertheless, ICRU recommends that the absorbed dose should be reported in the full PRV and PTV [11].
4.2.6 Treated Volume (TV)
As described in ICRU 83 [11], TV is the volume of the tissue enclosed within the specific isodose envelope that receives the absorbed dose specified by the radiation oncology team as being appropriate to achieve tumor eradication or palliation, within the boundaries of acceptable complications. According to ICRU, D 98 % (the absorbed dose for 98 % of PTV) could be selected to determine TV. It is important to identify the shape, size, and position of TV in relation to PTV because it can provide information to evaluate the causes of local recurrences inside or outside the PTV.
4.2.7 Remaining Volume at Risk (RVR)
In ICRU 83, RVR is defined operationally as the difference between the volume enclosed by the external contour of the patient and that of CTVs and OARs on the slices that have been imaged. RVR is important for the treatment optimization process. If RVR is not specifically determined and the dose objectives are not imposed accordingly, the planning systems for IMRT will then extensively seek any possible solutions to achieve the desired dose distribution according to the planning aims. It is possible that this could result in the delivery of unacceptably high doses elsewhere in RVR and that steep dose gradients may not be produced between PTV and RVR. To avoid these difficulties, the planning aims should be applied to RVR. In addition, the absorbed dose in RVR may be useful for estimating the risk of late adverse effects, such as carcinogenesis. Therefore, evaluating the absorbed doses in RVR is particularly important in younger patients who are expected to have a long lifespan.
4.3 IMRT Treatment Planning and Optimization
4.3.1 IMRT Optimization Process
Compared with conventional RT, the main features of IMRT optimization include the use of mathematical objective functions defined by a set of dose constraints and their priorities and the use of a computer-based algorithm to seek the optimal solution in an iterative manner.
IMRT optimization consists of the following processes: (1) defining constraints and establishing an objective function, (2) computing the beamlet weights or the beam segment shapes and weights, (3) computing the absorbed-dose distribution, and then (4) evaluating if the results meet the optimization requirement. If necessary, this then leads to additional rounds of iterative optimization with constraint modifications that define the objective function. Finally, the radiation oncologist makes a decision regarding the acceptability of the plan.
4.3.2 Optimization and Objective Functions
4.3.2.1 Planning Aims and Prescription
In treatment planning for IMRT, the distribution of the absorbed dose to any specified volume including PTVs, PRVs, OARs, and TV could be prioritized and tailored using an iterative process referred to as optimization. In ICRU 83, the “planning aims” are defined as the dosimetric goals when starting the IMRT treatment planning. Parameters such as the desired absorbed doses and planning constraints should be described in planning protocols when initiating the planning process. In contrast, “prescription” represents the finally accepted set of values based on the modified “planning aims” via the optimization process. The use of multiple dose–volume objective functions for each defined volume can lead to increased precision in the planning aims. Analysis of treatment outcome in terms of tumor control and normal tissue toxicity as a function of the absorbed-dose and dose distribution provides important information regarding desirable dose–volume constraints, such as D V (the absorbed dose in fraction V of the volume) and V D (the volume receiving at least the absorbed dose D). During the optimization process, the priority of one constraint over another and/or the priority of one volume over another are specified by parameters that quantitatively weigh the set of priorities. The priority ranking is a clinical decision that may be described in a clinical protocol. The constraints can then be modified iteratively to achieve an acceptable goal with an optimal intensity pattern.
4.3.2.2 Dose and Dose–Volume Objective Functions
To achieve the desired absorbed-dose distribution, a set of constraints is specified for selected target volumes and normal structures. In general, the objective functions for IMRT are established to achieve absorbed-dose homogeneity within PTVs and reduce the absorbed dose in PRVs or OARs according to the dose and dose–volume criteria for each structure and its relative importance. The main reason for the use of such criteria in the IMRT planning is that dose coverage of volumes can be determined explicitly from DVH and could be better controlled via the optimization process.
As shown in Fig. 4.3, the maximum (D max) and the minimum (D min) dose values for PTVs have been generally specified as dose-based objective functions to limit both the hot and cold spots, respectively. In addition, for PRVs of critical OARs, a high priority is that the D max values should not exceed the tolerance limits. The dose–volume metrics D min (=D 100 %) or D max (=D 0 %) values represent those at a single or small number of voxels with the lowest or the highest absorbed doses, respectively. These values may not be accurately computed because they are highly sensitive to the resolution of the calculation and accuracy of PTV. Therefore, ICRU 83 recommends that D 100 % or D 0 % should be replaced by the near-minimum, D 98 %, or the near-maximum, D 2 %, values, respectively, which can be determined more accurately [11]. It is also recommended that other values, such as D 95%, may also be used but should not replace D 98 %. In addition, the median absorbed dose, specified by D 50 %, should be reported because it is considered to correspond best to the previously defined dose at the ICRU reference point. The clinical relevance of the lowest doses can depend on their position within PTV. In cases close to the edge of PTV, a low-dose region may have less clinical relevance than one that is well within PTV. Therefore, it is important to not rely solely on DVH for evaluation but to instead carefully inspect the dose distributions slice by slice to ensure adequate dose coverage for PTV.

Fig. 4.3
Objective functions in dose-based optimization of the IMRT planning. (a) Application of minimal (D min) and maximal dose (D max) constraints to achieve, as much as possible, the dose homogeneity in the PTV. (b) Application of maximal dose (D max) constraints with the high-priority factor in the PRV of the critical structure such as the spinal cord to prevent the dose delivery beyond the threshold. According to the ICRU 83, D 98 % and D 2 % are preferable instead of D min and D max, respectively. D50 % should be reported for evaluation of the PTV dosing
For parallel OARs, mainly dose–volume-based criteria with relative priorities are applied for optimization, as shown in Fig. 4.4. Their dose–volume constraints are specified as V D. If the sole criterion is specified for OAR, any DVH curves that cross through this particular point obviously meet such a criterion (Fig. 4.5). To avoid such limitations, multiple dose–volume criteria with their relative weights for a single structure can be given, or even the entire DVH could be defined, which enables the shape of the cumulative DVH for that structure to be controlled.


Fig. 4.4
Objective functions in dose–volume-based optimization of the IMRT planning. Application of the dose–volume-based constraint at the point (D V, V D) in the structure with a large volume effect such as the parallel-like organs. DVH constraint indicated that no more than V D % of the volume should receive a dose of D V Gy. D median and D mean values should be reported for evaluation
Fig. 4.5
Representation of limitations of the DVH for the structure with a large volume effect such as the parallel-like organs. Three DVH curves producing the different effects will fit for one dose–volume-based constraint (at D V and V D of the volume). Application of multiple constraints may well control the shape of the DVH as desired
Optimization may be performed using physical (or dose- and dose–volume-based) rather than biological (or dose–response-based) criteria, such as tumor control probability (TCP), NTCP, and EUD. Dose–response-based optimization is particularly attractive because IMRT provides a dose-painting strategy for some biological targets according to functional imaging for metabolic status, hypoxia, and cell proliferation.
4.3.2.3 Iterative Optimization Using a Computer-Based Algorithm
A computer-based algorithm for inverse planning can incorporate “hard” constraints that cannot be altered or “soft” constraints that could be changed. Hard constraints restrict the process to only solutions that are feasible; examples include physical constraints such as forbidding negative beam intensities and restrictions on the beam size or direction. Solutions that are based on hard constraints are not the “best,” but can be feasible if they merely satisfy all hard constraints. Instead, “soft” constraints can better help achieve clinical goals. Such constraints can include specifications such as dose–volume uniformity, other dose–volume criteria, or the absorbed-dose limits to various structures. The optimization algorithm searches the parameter space seeking to achieve an objective function for the generation of an optimized solution in combination with soft and hard constraints. It should be noted that hard constraints bind the solution space, whereas soft constraints define a global minimum for a given objective function.
Optimization algorithms used to search for the possible solutions could be classified into the following two broad categories: deterministic and stochastic methods. In deterministic methods, the same solution will always be found when the same setup and initial conditions are used; they do not contain any random elements. Examples of deterministic methods include linear least squares and gradient descents [57]. A commonly used gradient descent in IMRT is nonlinear least-squares minimization [58], which is also called the steepest descent method. This algorithm follows the negative gradient of the objective function, similar to a downhill skier who could always go down the steepest slopes. Therefore, it iteratively finds a value for the objective function that is smaller than the last, getting closer to the minimum using relatively few steps [44, 59–61]. Compared with stochastic methods, the main advantage of the gradient descent and other deterministic methods is speed. However, if multiple minima are expected, the gradient descent searches then cannot escape from a local minimum of the objective function without finding the global minimum [62].
In inverse planning for IMRT, one of the most widely used stochastic algorithms is simulated annealing. Annealing is a physical process involving the heating and controlled cooling of a material being crystallized. This process is simulated during optimization of treatment plans. Higher temperatures indicate larger sizes of the random steps within the search space and even control the probability of “hill climbing.” In other words, many iteration steps may result in the temporal acceptance of a worse treatment plan than the previous one, because of the random principle involved [63, 64]. Generally, stochastic algorithms allow plans to escape from the local minima and continue to explore the solution space to reach the global minimum if there is unlimited time to search the parameter space. Because time is restricted for treatment planning, the iterative search needs to be stopped either manually or automatically if its progress has slowed. The computed value of the objective function is usually displayed graphically to help decide when to stop the search. In practice, stochastic and gradient descent methods could be combined.
If the cost function depends only on the dose-based objectives with the aim of one dose per volume, local minima do not exist. In contrast, dose–volume-based objectives can cause local minima. Multiple local minima can exist when optimizing beam angles and numbers and during optimization using biological models (dose–response-based), in which even different dose distributions can result in the same response probability. If multiple minima exist with a dose–volume-based optimization, it is difficult to know whether a given solution is optimal. In such cases, one must attempt to discover ways to force inverse planning systems into different parts of the solution space by changing the initial conditions.
4.3.2.4 Leaf Segmentation, Forward Dose Calculation, and Plan Evaluation
Dose constraints are assigned to both target volumes and OARs, and inverse optimization is then performed to identify the individual weights of a large number of beamlets. The computer adjusts the fluences of these beamlets according to the required planning dose objectives. After optimization, the intensity profiles need to be converted into delivery instructions for the specific system used. For multileaf collimator (MLC) systems, a leaf-segmentation or leaf-sequencing algorithm determines a series of “deliverable” MLC shapes and/or movements to best replicate the desired dose pattern. It is required that MLC should move at the maximum allowable speed in each segment, thereby minimizing the treatment time. Both transmission through MLCs and the effect of their rounded edges should be considered. Therefore, the original intensity profiles cannot be converted with complete fidelity using these processes, and so the final leaf motion is converted back into a deliverable intensity profile for subsequent forward calculations of absorbed dose and monitor unit (MU).
Once the forward absorbed-dose calculation has been completed using the deliverable profiles, the plan is evaluated using standard methods including planar dose distributions, DVHs, and radiobiological indices such as TCP and NTCP. If the dose distribution does not achieve the planning aims, the optimization parameters, optimization-only structures, or beams are adjusted, and the process is repeated. The choice between plan improvement and plan acceptance is often based on trade-offs among conflicting aims. As such, the prescription could be considered acceptable but be different from the original planning aim.
4.3.2.5 Beamlet Optimization and Aperture-Based Optimization
For both stochastic and deterministic strategies, there are two general frameworks for IMRT optimization: beamlet optimization [64–66] and aperture-based optimization [67]. Both strategies use the same criteria (constraints and objective functions). For beamlet optimization, each field is discretized into a grid of beamlets with modulated intensities. Beamlet-based optimization, which was pioneered for serial TomoTherapy (TomoTherapy Inc., Madison, WI, USA), is used to design dynamic MLC IMRT because it can achieve relatively highly modulated intensity patterns. After the leaf-sequencing step, calculating the final absorbed dose and MU could result in a significantly different absorbed-dose distribution than that suggested by the optimized plan; this discrepancy is called “convergence error” [68]. The cause of the discrepancy is partly because a simpler model of energy deposition is often used for the optimization algorithm than for the final dose calculations to accelerate the process. Because the accuracy of the final dose calculations is most important, it considers the limitations of MLC delivery that are not accounted for by the optimizer, as described above.
Aperture-based optimization takes into account the limitations of MLC during each optimization step, so that the segmentation step is eliminated. Instead, the best set of aperture shapes (and their relative weights) is directly sought to deliver the intensity pattern without explicit discretization of the field into a grid of beamlets. This approach is used for segmental MLC and intensity-modulated arc therapy (IMAT). If the same dose calculation algorithm is used for iterative optimization of apertures as that for the final absorbed-dose calculation, this method will then also avoid convergence errors. The automated aperture-based optimization procedure, in addition to new segments, could modify the boundaries of previous segments to better avoid normal tissue or improve the target dose homogeneity.
4.3.2.6 Methods of Delivery of IMRT
IMRT can be delivered using a conventional linear accelerator (linac) equipped with an MLC system designed to shape field apertures. This type of IMRT is delivered at fixed gantry angles by delivering multiple field segments statically (known as step-and-shoot IMRT) or by having the leaf pairs slide across the field dynamically (called dynamic or sliding window IMRT) [69]. The TomoTherapy HI-ART System [70] is a rotational IMRT approach that uses a binary collimator. Recently, IMAT was developed as a form of rotational IMRT [71, 72].
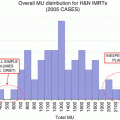
As the complexity of the IMRT plan increases, there is a dramatic increase in the number of MUs required to deliver IMRT [73, 74]. This increase in MU is associated with increased treatment time and a greater leakage of radiation from MLCs, which can increase the total body dose and the risk of secondary cancers [75]. It is also associated with increased dosimetric uncertainty. Therefore, attempts should be taken to reduce such complexity, including setting intensity limits and placing penalties on the cost function [76].
IMAT has greater flexibility in shaping the dose distribution than conventional IMRT. Studies have shown that IMAT could reduce treatment time and provide better plan quality in terms of target dose coverage and the sparing of normal tissue, as it uses fewer MUs per fraction as compared with fixed-field IMRT [77–79].
Related posts:

Stay updated, free articles. Join our Telegram channel

Full access? Get Clinical Tree


