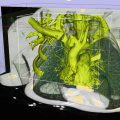
Fig. 57.1
Sagittal and axial view of an ultrasound-guided implant. A three-dimensional image volume is acquired by rotating the transrectal ultrasound probe while acquiring oblique sagittal images. (a) On the left, a sagittal image of the prostate may be seen with a rendering of the contoured prostate (red), urethra (yellow), and rectal wall (brown). The treatment planning system projects the planned location of the transperineal needle (purple) and included radioactive sources (yellow within needle). (b) On the right is a transverse view through the mid-gland. The template configuration and locations of all holes are shown in yellow. All the needles needed to deliver a configuration of sources that will produce the desired dose distribution are shown as green circles. The image artifact of two anchor needles are shown radiating from template positions c2 and E2
While naturally existing isotopes were used to manufacturer the first brachytherapy sources, man-made isotopes are now universally used for brachytherapy. Prostate brachytherapy can be a permanent implant, in which sources are placed in the gland and never removed, or a temporary implant, in which interstitial needles are placed in the gland and the isotope, is temporarily placed in the needles [4, 5]. The permanent implant is appropriate for early-stage disease confined to the gland, whereas the temporary implant is used for more advanced disease, when it is desired to deliver radiation to regions beyond the prostate. This chapter will focus on permanent implants to demonstrate the issues related to image-guided prostate implants.
In permanent prostate implant procedures, a large number of radioactive sources are inserted via needles placed transperineally. Imaging is used to guide the needles, each containing a number of sources, into the gland. The sources are deposited in the gland while the needle is withdrawn. The shape of the cumulative radiation dose distribution is determined by the arrangement of the sources within the gland Fig. 57.2.
Brachytherapy
Sources
Three isotopes are widely used for permanent prostate brachytherapy as shown in Table 57.1. The distinguishing feature is the relatively low energy of the photons released by these sources. The relatively high interaction coefficient of these photons, coupled with the inverse square law, results in the ability to deliver therapeutic levels of radiation to the prostate with little radiation escaping the patient. Patients are generally released the same day as the procedure and present no radiation safety hazard to the general public.
Table 57.1
Physical parameters of radioactive sources used in permanent prostate brachytherapy
Isotope | Half-life (days) | Energy (keV) |
|---|---|---|
125I | 60 | 27 |
103Pd | 17 | 23 |
131Cs | 10 | 29 |
Brachytherapy Implants
The goal of a brachytherapy implant is to deliver a therapeutic radiation dose to the target tissue while respecting the dose limits of normal tissues. In order to conform the radiation dose to the target, on the order of 40–100 sources are placed in the prostate. While the dose distribution around a single source is roughly spherical, a number of sources can be configured to produce a shaped distribution of dose. Due to the localized nature of the individual dose distributions, the shape of the radiation dose distribution delivered by a configuration of brachytherapy sources is highly dependent on the positions of the sources. The radiation dose in the vicinity of a low-energy brachytherapy source typically used for permanent prostate brachytherapy has dose dependence closer to r −3 than the r −2 typical of higher-energy sources used in temporary implants. Thus, regions of high radiation dose will surround each source, and the cumulative dose distribution will be highly nonuniform as shown in Fig. 57.3.
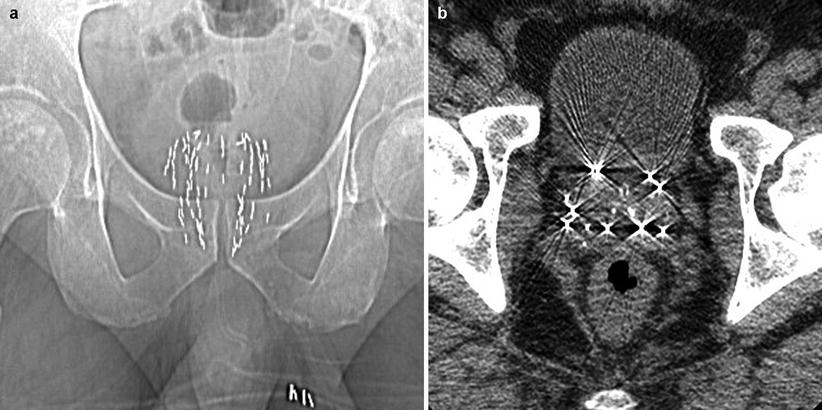
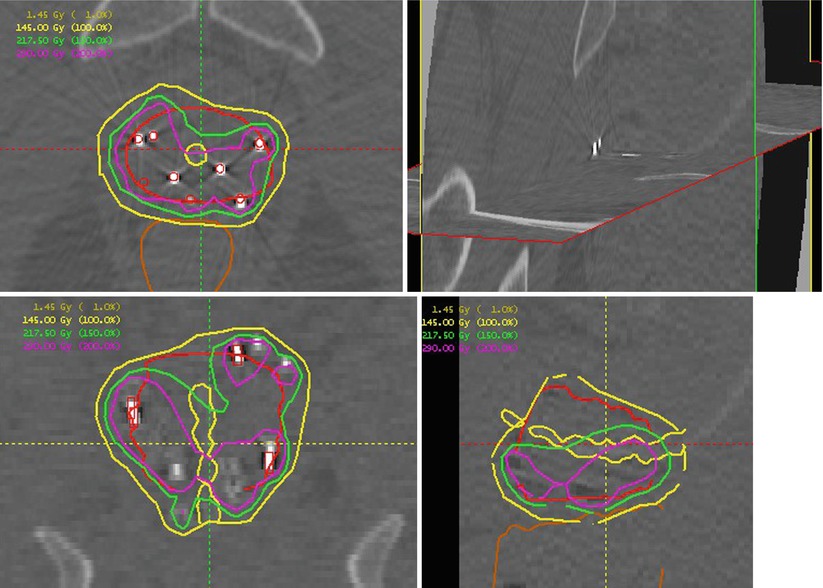
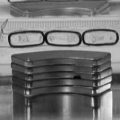
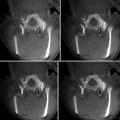
Fig. 57.2
CT views of a prostate implant. (a) A scout view shows a distribution of sources in the gland. (b) An axial mid-gland view showing the sources. The number of sources in an implant varies greatly depending on source activity and gland size. Implants containing 80 sources are not uncommon. While the substrate used to hold the radioactive material is not necessarily radiopaque, the metal of the source housing makes it easily distinguishable to x-ray imaging
Fig. 57.3
Orthogonal CT representations of a prostate implant showing the nonuniform dose arising from an implant. The upper left shows an axial mid-gland plane with the prostate outlined in red and the urethra indicated as a small yellow circle central to the prostate. The bright, relatively high-attenuation regions are the implanted sources. A source-finding algorithm has processed the three-dimensional dataset and located the sources as indicated by red circles overlaying the bright regions. Dose calculations are based on the source locations. Isodose plots indicate the dose distribution. In this case the prescription dose was 145 Gy (yellow). Moving counterclockwise are coronal, sagittal, and orthogonal plane views of the implant
Dose is prescribed in terms of a minimum dose to the target. While a covering dose can always be achieved by adding more radioactivity to the implant, the goal of treatment planning is to develop an implant plan which will provide coverage to the target, avoid excessive volumes of high dose within the target, and respect normal-tissue tolerances. The quality of the implant may be quantified in terms of metrics extracted from dose-volume histograms such as D 90, the dose that 90 % of the target receives; V 100, the volume of the target that receives 100 % of the prescription dose; and V 150, the volume of the target that receives 150 % of the dose. Doses to normal structures are usually reported in terms of the volume of the structure receiving more than a particular dose [6].
The radioactive sources making up a prostate implant are placed in the prostate via transperineal needles. The dose distribution depends on the sources being placed with millimeter accuracy, and the sources are being ejected from the tip of a needle placed at 10–15 cm depth within the patient. Once deposited in the prostate, the sources may not be repositioned. The means of ensuring accurate placement of the sources is to provide imaging verification of the source delivery needle’s position before the sources are released. It is this need for accurate needle placement that has led to the development of image-guided permanent prostate implants.
Implant Process
Image-guided prostate implants are performed using a number of approaches including preplanned, live planned, and adaptive live planned [7]. All processes proceed through the stages indicated in Fig. 57.4, although the timing and location of the preplan, as well as the feedback mechanism, will differ depending on approach.
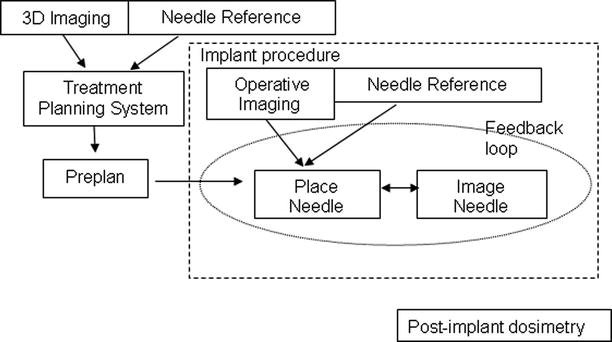
Fig. 57.4
Flow diagram of image-guided implants. Image-guided prostate implants consist of three distinct phases: planning, implant, and post-implant evaluation. Traditionally, the planning phase occurs days or weeks before the implant procedure. Post-implant evaluation is usually performed 30 days after the brachytherapy procedures
In one traditional approach, the patient is brought into the Radiation Oncology clinic days or weeks before the scheduled implant. TRUS is used in conjunction with a stepper mechanism (defined below) (Fig. 57.5) to acquire a volumetric image set of the prostate, by capturing a series of axial images at known locations. Dosimetrists develop a planned configuration of needles that achieves the desired clinical goals. The plan is used as a reference for the implant procedure where the feedback may be visual, geometric, or dosimetric. There are four major components of the process: imaging, needles, a reference coordinate system, and a treatment planning system.
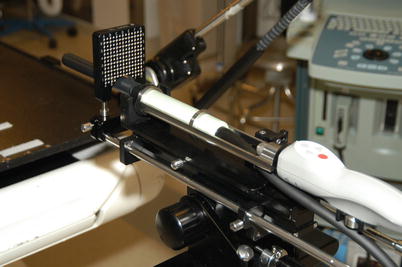
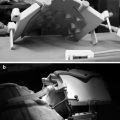
Fig. 57.5
Transrectal ultrasound probe with positioning cradle and mechanical coupling to needle guidance template. The cradle provides control of the probe position with a digital readout of position. The volumetric ultrasound dataset was acquired by computer-controlled rotation of the probe and digital capture of the ultrasound image. The known location of the template position with respect to the ultrasound probe establishes a connection between the imaging coordinate system and the template coordinate system. Manual positioning of the ultrasound probe with video capture may also be used to generate the volumetric ultrasound dataset
Technical Components
Imaging
Ultrasound (US) imaging is almost universally used for planning the implant process. Mechanical probe mounts, or steppers, are used to establish a reference frame for the US images as shown in Fig. 57.5. Volumetric US images may be created from multiple 2D US images acquired at known probe positions [8]. The approach may be manual, done by varying the depth of probe placement and capturing axial US images at known depths, or automated, in which a computer controls rotation of the probe and automatically reads out the probe position while simultaneously capturing sagittal images. An example of a dataset used for treatment planning acquired from a rotating side-firing TRUS device, with a sagittal image and an axial image reconstructed from a 3D dataset, is shown in Fig. 57.1. MR-guided implants have been developed in an effort to utilize the superior soft-tissue resolution [9]. MR-guided implants can take advantage of the 3D imaging, but do not have the imaging frame-refresh rate of US and only offer near real-time verification of the needle placement.
In addition to capturing a 3D dataset for planning, a reference image must be determined. In a preplanned procedure, the reference image is used to reestablish the preplanning coordinate system at the time of the implant. The reference image also provides a depth reference for needle insertion.
Needles and Reference System
The use of a template assists with needle insertion and provides a reference frame for treatment planning. Calibration of the template position with respect to the transducer allows the location of template holes to be projected onto the imaging dataset. With the fixed mechanical mount of TRUS systems, the calibration is not patient specific. In other systems, where the template is not fixed with respect to the imaging device, the registration must occur for each procedure [10].
Treatment Planning
A treatment planning system (TPS) is a computer software system responsible for combining imaging information with the needle reference frame in order to determine the configuration of needle trajectories necessary to achieve the dosimetric goals [11–14]. The TPS allows the clinician to contour the anatomy based on the 3D dataset and generate a model of the anatomic structures. The calibration of the template allows the trajectory of the template holes to be projected through the image dataset. The TPS calculates [15, 16] the dose distribution resulting from a configuration of sources and the dose-volume statistics used to evaluate the quality of the implant.
Related posts:

Stay updated, free articles. Join our Telegram channel

Full access? Get Clinical Tree


