(1)
Neuroradiology, Universityhospital Würzburg, Würzburg, Germany
3.1 Explanatory Note
After termination of this book the new WHO-classification of central nervous system tumors has been published [9]. As a completely new classification system frequently based on genetic definitions and no longer purely on histology has been created some entities in the following chapters have been abolished and do no longer exist like “gliomatosis cerebri”. Others have been refined and are called now differently like “embryonal tumors with multilayered rosettes” (ETMR) for the former PNET.
“CNS embryonal tumor NOS” has to be used in the future for an AT/RT without the confirmation of the characteristic molecular defect.
As the present experience with the imaging characteristics of pediatric brain tumors is based on the last WHO-classification system published in 2007 only rarely experiences with some of the new entities like the genetically defined groups of MB exist. Further knowledge on imaging characteristics of the new entities will be acquired only in the future and has not yet been included in this book.
3.2 Embryonal Tumors
Embryonal tumors primarily affect children and only rarely adults. They are derived from embryonal cells and comprise the most frequent highly malignant tumors in children, like MBs, primitive neuroectodermal tumors of the supratentorial compartment (cPNET), pineoblastomas, and atypical teratoid/rhabdoid tumors (AT/RT). After the general PNET concept coined by the neuropathologist LB Rorke [10] it is now recognized that these tumors former uniformly called PNET are subdivided according to their localization [11]. The reason for this strategy among others is that they show differing results after treatment.
3.2.1 Medulloblastoma
MBs are the most frequent malignant tumors of childhood. They grow in the cerebellum. Meanwhile five different histological and four genetic variants [12] of this tumor are known and characterized by differences in prognosis, morphology and localization (Table 3.1). All MBs are highly cellular tumors. High cell density is translated into a low T2-signal and a restricted diffusion leading to a high signal on diffusion images and a dark presentation on an ADC map (acquired diffusion coefficient) [13]. On CT before contrast enhancement the solid parts of the tumors are mostly hyperdense [14] compared to the cerebellar cortex (Fig. 3.1
). Of course necroses or rare cysts do not show high CT density. In our far more than 100 CTs of MBs we did not encounter a single tumor showing hypodense CT-values in the solid parts of the tumor.
Table 3.1
MB histological variants
Subtype | Age at diagnosis (median/range) | Localization midline/hemisphere (in %) | Contrast enhancement >50 % volume (in %) | Meningeal dissemination at diagnosis (in %) | Tumor size (volume in ml) |
|---|---|---|---|---|---|
CMB n = 356 | 7 (1–21) | 97/3 | 61 | 14 | 32 |
DMB n = 75 | 7 (1–19) | 72/28 | 84 | 8 | 38 |
MBEN n = 15 | 1 (0–3) | 93/7 | 100 | 7 | 60 |
AMB n = 12 | 6 (2–16) | 92/8 | 92 | 8 | 26 |
LCMB n = 7 | 7 (2–14) | 100/0 | 86 | 71 | 15 |
Fig. 3.1
Classic medulloblastoma: a CT before contrast shows a tumor in the fourth ventricle with obstructive hydrocephalus. The solid parts of the tumor are hyperdense compared to the gray matter of the cerebellum signifying high cellularity. Central necrotic parts are hypodense and characteristically no significant edema is surrounding the tumor. The high density excludes a low-grade glioma. However, also an ependymoma could be possible in this case
3.2.1.1 MB with Extensive Nodularity (See Table 3.1)
Young children (all below 3 years of age in our database with a mean age of 1 year) are the typical age group for MBs with extensive nodularity (MBEN). It is a subtype of the desmoplastic nodular variant. MBENs bear a much better prognosis with adequate treatment and can be cured with chemotherapy even if they present with an otherwise bad prognostic sign of a meningeal dissemination [15]. They may show rare recurrences, which usually can be salvaged by additional treatment. Interestingly MBEN are very dark on ADC or T2-weighted images suggesting a high cell density (Fig. 3.2a). They often contain cysts and an intense tubular enhancement (Fig. 3.2b) that was also described as grape-like [15]. In an evaluation of 470 MB in our database all 15 MBEN showed complete and intense enhancement and 11 of the 15 tumors showed the typical enhancement pattern mentioned above. Interestingly MBEN are the MBs with the largest perifocal edema. All other varieties show no or little edema. This result underlines that a larger edema cannot be considered as a general sign of a more malignant tumor.
Fig. 3.2
(a) Sagittal T2-w MRI: In a child aged 18 months a tumor in the cerebellar posterior midline shows very low T2-signal in his solid areas and a large perifocal edema. Age, localization, T2-signal, and amount of perifocal edema are very characteristic of an MBEN. (b) Coronal enhanced T1-w sequence: The solid portion of an MBEN in another young child shows an intense and band-like enhancement
3.2.1.2 Desmoplastic-Nodular MB (See Table 3.1)
The desmoplastic-nodular MBs peak at two different ages [16]. They affect young children and have been shown to have a much better prognosis than all the remaining subtypes in young children with the exception of MBEN. The second age peak lies in the second decade or even older ages. Also these tumors are usually more benign than, e.g., classic MBs. Desmoplastic-nodular MBs enhance intensely and most frequently entirely (Fig. 3.3a, b) and a nodular enhancement pattern resembling the histopathological appearance may be seen. Desmoplastic-nodular MB in our database and all the other subtypes had their typical peak age between 5 and 9 years.
Fig. 3.3
(a) Parasagittal T2-weighted MRI in a young child with a desmoplastic-nodular MB. The nodular aspect of the solid tumor in the cerebellar hemisphere and the vicinity to the superficial structures is characteristic for desmoplastic nodular MBs. (b) In another patient, a young adult, the typical position superficially in the right cerebellar hemisphere is fitting to a desmoplastic nodular subtype of MB
3.2.1.3 Anaplastic and Large Cell MB (See Table 3.1)
These two MB variants have been grouped together before the WHO classification published in 2007 and have been separated thereafter [17]. They are quite rare. Anaplastic MBs do not seem to behave as bad concerning prognosis as their name pretends [18]. In our 470 MB we did not find very specific imaging features that might allow a probable diagnosis by imaging in this variant. However, large-cell MBs are usually prognostically grave [18] and are metastatic in the cerebrospinal fluid (CSF) in up to 70 % already at diagnosis. The tumors are small at diagnosis and contrast enhancement is variable (Fig. 3.4). In large cell MB probably the clinical complaints by the meningeal dissemination lead to the diagnosis and not so frequently the symptoms of the tumor itself.
Fig. 3.4
The sagittal enhanced T1-w sequence shows a small large-cell MB (asterisk) and an impressive laminar and nodular dissemination in the cranial and spinal CSF
3.2.1.4 Classic MB (See Table 3.1)
Classic MBs are the most frequent MB (356 out of 465 MB). They rather frequently show a diminished or no contrast uptake (10 % in our database) (Table 3.2) compared to the regularly and mostly completely enhancing other subtypes (Fig. 3.5a). Only about 40 % are enhancing entirely.
Table 3.2
Decision tree for the probable diagnosis of a suprasellar tumor in a child
Fig. 3.5
(a) On a coronal enhanced T1-weighted MRI, the classic MB does not show any enhancement. Little or no enhancement is most frequent in the classic subtype. (b) A midline position in the cerebellar vermis is characteristic for most MBs and the classic subtype in special (same patient as in Fig. 3.5a)
3.2.1.5 Typical Localization of the MB Variants
The most frequent classic subtype is usually localized within the cerebellar dorsal midline (Fig. 3.5b). Only 3 % of our 356 classic MB were found outside the midline in the hemispheres and possibly could also represent brainstem PNET, because histologically PNET and MB look the same and can only be allocated by their respective localization. This differential diagnosis is important as brainstem PNET are prognostically worse due to the inherent inability to resect them substantially.
In the second most frequent histological subtype the desmoplastic-nodular type the typical localization within the superficial parts of the cerebellar hemisphere (Fig. 3.3a, b) is predominantly found in teenagers and young (or rarely older) adults [19]. An infiltration of dural structures or even a crossing of the tentorium is not unusual [20]. This histological subtype in young children is much more often localized in the vermis alike the classic type [21]. Also MBEN are mainly found a midline position [22].
The anaplastic and large-cell MBs are also frequently found in the midline.
Not yet completely scientifically evaluated also genetic subtypes may have certain predominant localizations. It has recently been found that three out of four of the wingless pathway activated (WNT) MBs were localized in an off-midline position near the lateral brain stem with extension into the cerebellopontine (CP) angle [23] mimicking ependymomas, which are frequent in this area. In our own 290 genetically classified MB this was the case in 50 % of 18 WNT MBs (Fig. 3.6).
Fig. 3.6
T2-weighted axial MRI showing a WNT-type medulloblastoma in a quite typical lateral position in the cerebellopontine angle
3.2.1.6 Differential Diagnosis (See Table 3.3)
Ependymomas in the posterior fossa are highly cellular tumors and cannot be differentiated from MB by T2- and ADC-brightness or CT-density. The internal structure with cyst-like necrotic areas, the localization in the lower fourth ventricle, and near to the ependymal layer in the cerebellopontine angle, and the growth behavior (plastic growth) may be the differentiating clue. For details please see Sect. 3.3.
Table 3.3
Decision tree for the probable diagnosis of tumors in the posterior fossa in a child
Pilocytic astrocytomas are the most frequent low-grade tumors in children at all, and in the posterior fossa they have a predilection site. They histologically show a low cellularity and therefore display a very bright T2-signal. They do not show restricted but increased diffusion and are hypodense in their solid parts on CT. Enhancement is frequent but variable and does not allow a differential diagnosis. See Sect. 3.2.1.
In case of a very young child below 6 or 12 months of age you should also think of an AT/RT. Bleeding residues, an off midline position and peripheral cysts as well as a peculiar enhancement pattern are rather intriguing. See Sect. 3.1.3.
Hemangioblastomas are tumors that usually do not affect very young children. The peak incidence is in the second decade as well as for syndromal hemangioblastomas in von Hippel-Lindau syndrome as also sporadic ones [24]. Details are covered in the Sect. 3.2.1.
Choroid plexus papillomas can arise everywhere where plexus is found. They usually show a high CT-density and low T2-signal. The correct diagnosis can be suspected, if a multinodular smooth surface (cauliflower-like aspect) and a strong enhancement resembling a normal choroid plexus are seen. Many patients do not show specific symptoms, and these tumors can be found incidentally. They tend to bloc the CSF pathways and can lead to clinical symptoms associated to hydrocephalus. More aggressive choroid tumors are atypical plexus papillomas (WHO grade II) and plexus carcinomas (WHO grade III). The morphological differences on neuroimaging may not be obvious between these entities. Of course carcinomas tend to show signs of infiltration into the brain while papillomas are usually sharply margined and confined to the ventricular lumen. Carcinomas are more frequently inhomogenous and large tumors. A leptomeningeal dissemination may be seen in all three variants and does not exclude a grade I papilloma. Plexus carcinomas can very well resemble AT/RTs on imaging. Interestingly common features in immunohistochemistry between these two entities have been described [25].
3.2.2 Central Nervous System Primitive Neuroectodermal Tumors (CNS PNET changed to ETMR in the new WHO classification)
CNS PNETs arise in the cerebral hemispheres, the brain stem, and the spinal cord [26] of children and mainly young adults. A variant of this clinically very aggressive entity according to a specific differentiation are cerebral neuroblastomas or ganglioneuroblastomas, medulloepitheliomas, and ependymoblastomas. On imaging we see highly cellular tumors with a low T2 and restricted diffusion (Fig. 3.7a–c). Contrast enhancement is variable but more frequently sparse than intense or complete (Fig. 3.7d). It is often missing completely. Perifocal edema is mostly minor or absent (Fig. 3.7e), and in contradiction to a fast growth and malignant behavior the tumor seems to be surrounded by a capsule and usually is on imaging well delineated from the surrounding brain [27]. Like MB also CNS PNET are prone to tumor dissemination in the leptomeninges prompting an MRI evaluation of the complete cranial and spinal CSF space.
Fig. 3.7
T2-weighted axial (a) and sagittal (e) MRI, diffusion-weighted MRI (b) and ADC (c) and T1-weighted image after contrast enhancement (d) of different children with a cPNET. It is characteristic that cPNETs are sharply delineated without perifocal edema. The high cell density is reflected by a restricted diffusion and thus a dark ADC. Contrast enhancement is frequently little or missing
3.2.3 Atypical Teratoid/Rhabdoid Tumor (AT/RT)
AT/RTs are highly malignant tumors affecting young children. Meanwhile they are considered the most frequent malignant brain tumors within the first 6 months of age [28, 29]. They are closely linked to rhabdoid tumors of the kidneys as well on histology as also genetic findings and may be found in familial rhabdoid tumor predisposition syndrome [30, 31]. AT/RTs are restricted to the CNS and supra- or infratentorial localization is varying with age. Older children or rarely adults more frequently develop supratentorial tumors [32]. AT/RTs may also arise in the spinal cord [33, 34] and are then not distinguishable from other cord tumors.
In the brain it is rather the combination of multiple features than one single characteristic on imaging that can help to find the likely diagnosis. Like all tumors with increased cell density, the solid parts are very hypointense on T2-weighted MRI and show a severely restricted diffusion on ADC (Fig. 3.8a). Being often hemorrhagic on macroscopic inspection, the deposition of blood products like hemosiderin or methemoglobin is quite characteristic (Fig. 3.8b). Peripheral cysts placed in between the surface of the tumor and the normal brain have been described frequently [32, 35] (Fig. 3.8c). Usually the borders are surrounded by a varying amount of perifocal edema. The amount of the perifocal edema can be used for the differentiation to PNETs. An astonishingly high percentage of bone destruction of the vault or skull base has been found, which is an extremely unusual feature in other primary CNS tumors [36]. In a number of patients, a characteristic band-like wavy pattern of contrast enhancement surrounding a more or less large central necrotic area is visible [32, 35] (Fig. 3.8d). Together with a young age these imaging characteristics can be used in the differential diagnosis of an AT/RT.
Fig. 3.8
Axial diffusion-weighted MRI (a), iron-sensitive T2*-image (b), T2-weighted image (c), and postcontrast T1-weighted MRI (d). Same patient on (b) and (d). AT/RTs are highly cellular tumors with a very dark ADC (a). A midline position (c) in the posterior fossa is less frequent than an off-midline growth. Characteristic features are residues of bleeding (b) and a rather peculiar pattern of a band-like enhancement surrounding a central necrosis and the existence of peripheral cyst-like lesions (c)
3.3 Glial Tumors
3.3.1 Astrocytomas
Low-grade astrocytomas and among those the main representative of circumscribed astrocytomas, the juvenile pilocytic astrocytoma, are the most frequent brain tumors in children and young adults [37]. More often the origin is the cerebellum followed by the supratentorial midline, synonym for the surroundings of the third ventricle, the chiasm and hypothalamus, and other parts of the visual pathway [38]. However, pilocytic astrocytomas may grow anywhere in the CNS and are the most frequent tumors of the spinal cord in children, while in adults ependymomas of the spinal cord are predominant [39]. A typical combination of an enhancing nodule and cystic tumor parts (Fig. 3.9a) has been described as characteristic imaging feature [40]. However, purely solid or regularly enhancing tumors are not rare (Fig. 3.9b, c) and might lead to a misclassification as possible high-grade tumor. This can be avoided easily, if the distinctive low cellularity of the tumor is respected. The low cellular density is correlated to a bright intensity on T2-weighted MRI (Fig. 3.9d) and a high ADC (Fig. 3.9e) value without any suspicion of restricted diffusion in the solid parts of the tumor. The only pitfall may be blood product deposition (Fig. 3.9f) or calcification within the tumor that might render this discriminating feature useless by possibly lowering the T2-signal [41] and the ADC as well. A low density of solid tumor on unenhanced CT is a regular finding in noncalcified low-grade gliomas and can be used as a differential diagnostic tool (Fig. 3.9g). Interestingly we only found hyperdense CT-values in LGGs in patients with NF1 without knowing why they differ from sporadic tumors. Germ cell tumors, e.g., exhibit iso- but mainly hyperdense values.
Fig. 3.9
(a–c) Axial (a, c) and coronal (b) T1-weighted postcontrast MRIs of different patients. The pathognomic pattern of a nidus and a cyst (a) is not unique. Enhancement may be complete with characteristic smooth margins (b) or incomplete and irregular (c) mimicking a high-grade glioma. Axial T2-weighted (d) and ADC (e) images of different children showing the bright signal signifying a low cell density and facilitated diffusion. Pilocytic astrocytomas have pathologic vessels and therefore iron deposition and increased vessel density on SWI (f) (pilocytic astrocytoma in the mediobasal right temporal lobe) must not be considered as a sign of a higher malignancy grade as in adult high-grade gliomas. Low cell density is affecting the density values of unenhanced CT (g) leading to mainly hypodense solid components
In the spinal cord no differentiation between the various histologies is possible and the suspicion of a pilocytic astrocytoma is only based on the age of the affected patient and not on imaging characteristics. In ependymomas, rarely hemosiderin deposits are diagnostic either as leptomeningeal hemosiderosis (Fig. 3.10) or as hemosiderin caps at the upper and lower borders of the tumor [42–44].
Fig. 3.10
Sagittal T2-weighted MRI in a young adult patient with a lumbosacral ependymoma and an extensive leptomeningeal hemosiderin deposition, which is rare but pathognomonic for this histology
3.3.1.1 Visual Pathway Gliomas
About 20 % of children with neurofibromatosis type I (NF1) or von Recklinghausen’s disease develop visual pathway gliomas [45]. NF I is a phacomatosis with various defects in the tumor suppressor gene located on the long arm of chromosome 17 [46]. The incidence of CNS tumors and among those especially tumors of the visual pathway is increased. The visual pathway consists of several segments that have been classified according to Dodge in three parts [47]. Dodge I is tumor in the optic nerve uni- or bilaterally (Fig. 3.11a). The second part is the optic chiasm where sporadic, non-NF1-associated, gliomas are found most frequently. The affection of the chiasm with or without the optic nerves is called Dodge II (Fig. 3.11b). Dodge III is reserved for tumors of the optic tracts or radiation either with or without a participation of the anterior visual pathway [48] (Fig. 3.11c). Visual pathway gliomas in NF1 are predominantly diffuse tumors occupying long distances of the visual pathway and tumors of the posterior pathway. Tumors in the posterior pathway are more frequently associated with severe problems of vision and blindness. This traditional classification is quite approximate and does not allow a detailed anatomically based analysis of the affected parts of the pathway. Oncologists and radiologists from Padua, Leeds, Augsburg and Nottingham (PLAN) have settled out to find a more refined classification, the so-called PLAN system [49], by classifying the tumors of a number of children from these four hospitals. It is a quite detailed system, introduced to allow risk evaluation especially for disturbances of vision. The main problem of the PLAN classification is that size changes of the tumor do necessarily lead to an involvement of a different part of the pathway and are thus not reflected by this system. As a consequence, the tumor might grow considerably and the PLAN stage does not change. However, a more common use of the PLAN classification is needed to decide on the usefulness for the patients and treatment decisions because vision is the main criterion of outcome for children with visual pathway tumors. Nearly all tumors affecting more than one part of the visual pathway in children are low-grade gliomas (LGG) (astrocytomas WHO grade I or II and gangliogliomas WHO grade I). In this context, only one situation might create differential diagnostic problems. A compression of the chiasm by any kind of lesion may lead to an edema in the optic tracts (Fig. 3.12a, b). This phenomenon was first described in craniopharyngiomas [50] but may happen in any kind of tumor like, e.g., in germ cell tumors or even in metastases in adults [51]. The clue to a correct classification is to consider and compare the internal structure of the chiasmatic and tract lesions. If they differ then a reactive edema of the tracts due to some other tumor in the chiasm is very likely.
Fig. 3.11
Visual pathway gliomas in different children. In Dodge I (a, axial T1-weighted MRI after contrast) only one or both optic nerves are affected. In (a) the left optic nerve shows enhancement and slight thickening. The Dodge stage II is characterized by a glioma in the chiasmatic-hypothalamic region as seen on the sagittal T2-weighted MRI (b) with an extension into the subfrontal region. If the tracts and radiation are involved as seen on the T2-weighted MRI of a patient with NF-1 (c) this corresponds to Dodge III. Mark the involvement of the chiasm and hypothalamus and the multiple T2-signal increases in the cerebellar white matter characteristic in middle aged children with NF-1
Fig. 3.12
If more than one segment of the visual pathway are affected by a lesion this is virtually nearly always a glioma. A pitfall, however, is the development of a tract edema in chiasmatic tumors like, e.g., craniopharyngiomas and all kinds of usually larger and compressive other tumors. To avoid this false diagnosis you have to evaluate the internal structure of lesions in the chiasm and the tracts. On the T2-weighted axial MRI there is a clear difference between the lesion in the chiasm, a germ cell tumor, and the hypersignal in the tracts at diagnosis (a). After treatment the mass lesion has diminished and a control MRI after 3 months (b) shows that the edema on the right hand side has vanished and is markedly reduced on the left hand side
3.3.1.2 Differential Diagnosis of Suprasellar and Visual Pathway Lesions
Extremely rare in children are high-grade gliomas (anaplastic astrocytomas or GBM) [52] of the visual pathway. The few cases in our patients were predominant in the chiasm and visually not distinguishable from LGG. Inflammation like sarcoidosis affecting more than one part of the visual pathway [53] has been published in adults and occasionally in adolescents [54] as an accepted differential diagnostic option to diffuse visual pathway gliomas. Sarcoidosis is at least in my experience not found in younger children, who mainly bear gliomas of the visual pathway. Perhaps our patients represent a selection in this respect. If the lesion is confined to only one segment of the pathway like the chiasm, plenty of different tumors might be possible and an accurate differentiation is needed. Here again the high T2- and ADC-signal as a sign of low cellular density in LGG plays an important role. Another crucial sign is the preservation of the normal posterior pituitary lobe (PPL) bright spot (Fig. 3.13a). The bright spot correlates to a collection of vasopressin in the PPL [55]. The loss of the bright PPL signal is frequently accompanied clinically by diabetes insipidus [56]. The bright spot is best seen on T1-weighted sequences before the application of contrast medium and indicates a normal function of the connection between hypothalamus and PPL. T1-weighted sequences with fatsupression technique may be useful for an easier detection of the bright spot because the reliable distinction on a standard T1-image between the normal PPL bright spot and fat in the sella or around the pituitary gland can be hard or impossible. The best way to identify the PPL bright spot is on thin sagittal T1-weighted images (SL, e.g., 2–3 mm). We prefer spin echo (SE) or turbo spin echo (TSE) images by far compared, e.g., to MPR sequences. While the PPL bright spot is practically always present in LGGs affecting the suprasellar region, it is nearly regularly missing in germ cell tumors of the same region [57] (Fig. 3.13b). It may be preserved or missing in craniopharyngiomas depending on their size and individual location (Fig. 3.13c, d). Usually the size of the pituitary gland is diminished in craniopharyngiomas (Fig. 3.13d) and germ cell tumors, which is frequently accompanied by an insufficiency of the pituitary function [58]. Important differential diagnostic signs are the presence of calcifications or colloid in adamantinous craniopharyngiomas of childhood, which are characteristically predominantly cystic tumors. Contrary to adults affected by craniopharyngiomas, the adamantinous type of histology is by far the most frequent type. Adults usually bear papillary craniopharyngiomas that are more solid and homogeneous tumors without calcifications [59]. Larger cysts are missing in germinomas, the most frequent germ cell tumor in adolescents and young adults. If cysts and an inhomogeneous internal structure are seen in a germ cell tumor, this is rather a sign of a mixed or secreting germ cell tumor because the teratoma parts exhibit a more inhomogeneous structure [60, 61].
 Structure of the Pediatric Competence Network of the German GPOH (Society of Pediatric Oncology and Hematology)
The Impact of Staging Examinations in Children and Adolescents with Brain Tumor
Structure of the Pediatric Competence Network of the German GPOH (Society of Pediatric Oncology and Hematology)
The Impact of Staging Examinations in Children and Adolescents with Brain Tumor
 Imaging Guidelines for Pediatric Brain Tumor Patients
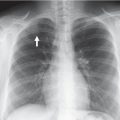
 Large Airways
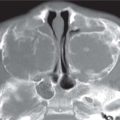 Nasal Cavity: Paranasal Sinuses
 Chest Wall: Clavicle


Related posts:
Structure of the Pediatric Competence Network of the German GPOH (Society of Pediatric Oncology and Hematology)
The Impact of Staging Examinations in Children and Adolescents with Brain Tumor
Imaging Guidelines for Pediatric Brain Tumor Patients
Large Airways
Nasal Cavity: Paranasal Sinuses
Chest Wall: Clavicle
Stay updated, free articles. Join our Telegram channel
Full access? Get Clinical Tree
