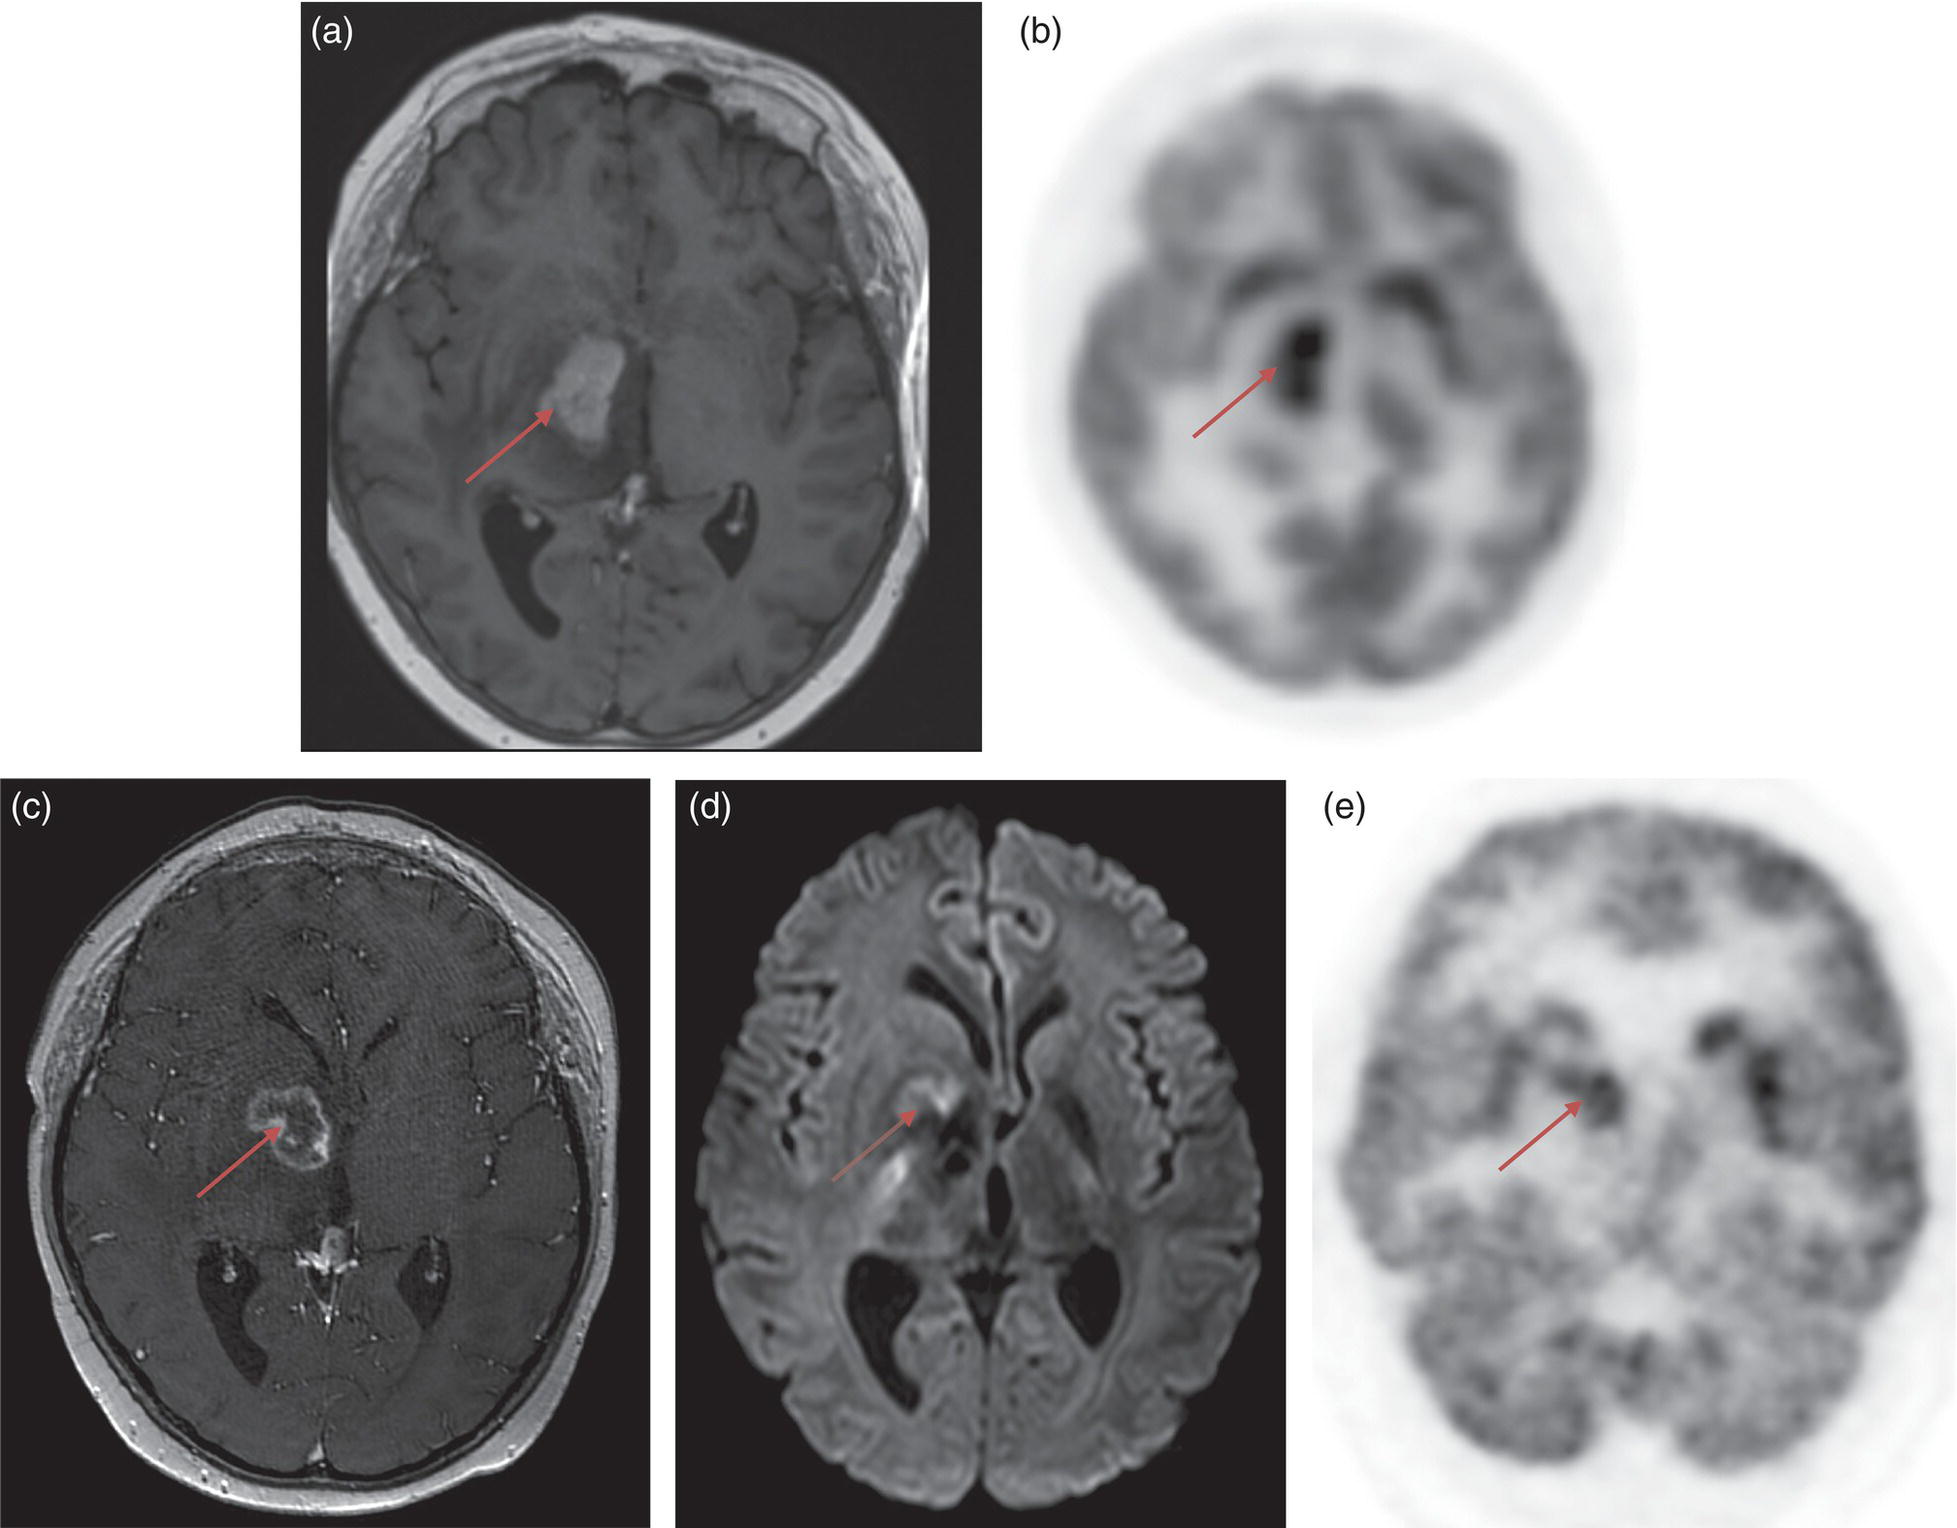
Riccardo Laudicella1, C. Mantarro1, B. Catalfamo1, P. Alongi2, M. Gaeta3, F. Minutoli1, S. Baldari1, and Sotirios Bisdas4,5 1 Department of Biomedical Sciences and Morphological and Functional Imaging, Nuclear Medicine Unit, University of Messina, Messina, Italy 2 Unit of Nuclear Medicine, Fondazione Istituto G. Giglio, Cefalù, Italy 3 Section of Radiological Sciences, Department of Biomedical Sciences and Morphological and Functional Imaging, University of Messina, Messina, Italy 4 Department of Brain Repair and Rehabilitation, UCL Queen Square Institute of Neurology, University College London, London, UK 5 Lysholm Department of Neuroradiology, The National Hospital for Neurology and Neurosurgery, UCLH NHS Foundation Trust, London, UK Primary brain tumors represent 2–3% of cancer with an incidence of about 6/100 000/year worldwide [1]. Although this is a relative low‐rate incidence, brain tumors are a significant cause of cancer morbidity and mortality, especially in children and young adults, where they account for almost 30% and 20% of cancer deaths, respectively. Brain tumors can potentially arise in any anatomical regions of the central nervous system (CNS), with the vast majority (>90%) occurring in the brain and the remainder occurring in the meninges, spinal cord, and cranial nerves. Patients with CNS tumors often present with a spectrum of focal or generalized symptoms over days to weeks, or months to years, depending on the speed of growth and location of the tumor, as tumors in some functional areas of the brain will cause more obvious focal neurological deficits than in other areas. Generalized symptoms and signs are seizures (50–80% of patients), headaches (30% of patients), and alterations due to increased intracranial pressure (15% of patients) such as morning nausea and vomiting, drowsiness, blurred vision from papilloedema, and horizontal diplopia from cranial nerve VI palsy. Primary brain tumors refer to a heterogeneous group of tumors arising from cells within the CNS, divided, according to their origin, into glial and nonglial tumors. Gliomas are tumors of neuroectodermal origin arising from glial or precursor cells; they constitute more than 80% of CNS primary tumors in adults, including astrocytomas, oligodendrogliomas, and ependymomas [2]. Gliomas are traditionally divided into two major categories: diffuse and nondiffuse. The classification of gliomas was significantly reorganized in the 2016 World Health Organization (WHO) update. For the first time, the WHO classification of CNS tumors uses molecular parameters in addition to histology to define many tumor entities. Accordingly, it is now recognized that certain molecular and genetic features of tumors, in some instances, can be more important in response prediction and prognosis than histological type and grade, which has obvious implications in clinical therapy and research [3]. Among nonglial tumors we mention meningiomas, tumors of the cranial and paraspinal nerves, tumors of the pineal region, mesenchymal non‐meningothelial tumors, and tumors of the sellar region. Meningiomas represent about 30% of all primary brain tumors, and only 2–3% are malignant (WHO grade III). The classification and grading of meningiomas did not undergo revisions, except for the introduction of brain invasion as a criterion for the diagnosis of atypical meningioma, WHO grade II. Instead, brain secondary tumors are the most common intracranial tumors in adults and portend significant morbidity and mortality [4]. The most common cancers metastasizing to the brain include lung (50%), breast (15–20%), melanoma (5–10%), kidney (7%), and colon (4–6%) [5]. Cancer cells metastasizing to the brain are often molecularly and phylogenetically distinct from their primary tumor source, with further capabilities for penetrating the blood–brain barrier (BBB) and colonizing the brain microenvironment [6]. Recent advances in molecular biology have improved the understanding of glioma pathogenesis and several clinically significant genetic alterations have been described. CNS tumor diagnoses should consist of a histopathological name followed by the genetic features, with the genetic features following a comma and as adjectives. Now gliomas are further divided according to the presence of mutations in the isocitrate dehydrogenase (IDH) 1 and 2 genes (from this point on referred to collectively as IDH) and the presence or absence of a characteristic unbalanced translocation of chromosomes 1 and 19, known as 1p/19q co‐deletion. When present, IDH mutation occurs very early in tumorigenesis, whilst the 1p/19q co‐deletion represents a later alteration [7]. According to the 2016 WHO update, WHO grade II and III gliomas are largely dichotomized into astrocytomas or oligodendrogliomas based on molecular/genetic factors, with the previous classification of oligoastrocytoma being appropriate only in very unusual circumstances. Both astrocytomas and oligodendrogliomas are classified as “diffuse” if they are WHO grade II and “anaplastic” if they are WHO grade III. Mutant and wild‐type tumors have different distributions within the brain, namely, IDH‐wildtype grade II astrocytomas are more likely to be multifocal and to involve the brainstem, and less likely to demonstrate cystic components. Otherwise, IDH‐mutant tumors, and in particular those also harboring 1p/19q codeletion, are more likely to involve the cortex, to be heterogeneous, to contain calcification, and to display cystic alterations [8]. For WHO grade II gliomas early and maximal safe resection is the initial treatment and postsurgical treatment decisions are based on risk stratification; in contrast, the standard of care for patients with high‐grade gliomas (WHO grade III) is maximal safe surgical resection followed by chemoradiation. Glioblastoma (GBM) is the most aggressive and common of all CNS tumors, representing approximately 50–60% of all gliomas. GBMs are now recognized as two distinct tumor entities defined by the presence or absence of IDH mutation. This is concordant with the longstanding observation that GBM could be functionally divided into primary and secondary types, based on whether the tumor was thought to arise de novo as a GBM (mainly IDH wildtype) or originate as a lower‐grade astrocytoma undergoing malignant degeneration (mainly IDH‐mutant). Potentially, GBM can involve any regions of the brain and spinal cord, even if a preferential involvement of the telencephalon is described with the characteristic involvement of the white matter. A possible behavior of GBM (known as “butterfly glioblastoma”) is the tumor’s spread to the contralateral hemisphere through the corpus callosum, displaying a symmetrical growth into both hemispheres. Multiple locations of tumor growth are rare and are found in 2–5% of cerebral GBM; the prognosis of GBM is poor because of the small cell component and due to the infiltrating growth behavior. Thus, complete tumor resection is not always possible and GBM is therefore characterized by a high rate of recurrence. Neuroradiological imaging plays a crucial role in the primary diagnosis and follow‐up in brain tumors. In low‐grade glioma (LGG), imaging is mandatory to assess the dimension, the morphological features of the tumor, and the possible anaplastic transformation. In high‐grade glioma (HGG), the radiological evaluation is useful to distinguish between tumor residuum/recurrence and therapy‐induced changes. Computed tomography (CT) may be the first technique employed in a patient with a suspicious brain tumor as it is useful in the detection of hemorrhage, herniation, hydrocephalus, calcification, and mass effect (mainly caused by oligodendrogliomas or menigiomas). Magnetic resonance imaging (MRI) represents the gold‐standard modality in this scenario: in fact, diagnosis and treatment planning are routinely based on conventional MRI imaging. In 1990, Macdonald et al. published criteria for response assessment in HGG, proposing four categories: complete response (CR), partial response (PR), stable disease (SD), and progressive disease (PD). These criteria are based mainly on tumor contrast enhancement using quantitative bidirectional size measurement [9]. It is therefore mandatory to assess therapy‐induced changes, such as radiation necrosis, which is an aggressive tissue reaction that usually develops 3–12 months after radiotherapy due to BBB disruption with oedema, mass effect, and occasionally hemorrhages or calcifications. Other treatment‐related changes include pseudoprogression, namely the appearance of treatment‐related contrast enhancement or oedema on MRI despite a no‐true increase in tumor activity (3‐ to 4‐month period after radiotherapy) [10], and pseudoresponse, which represents the disappearance of contrast enhancement with recurrence of tumor in the form of a nonenhancing lesion [11]. In 2010, the Response Assessment in Neuro‐Oncology (RANO) working group published new guidelines for response assessment in patients with glioma [12]. Although RANO criteria are extensively used in clinical trials, their penetrance in clinical routine reporting is limited. Modifications to the current RANO criteria include suggestions for volumetric response evaluation, the use of contrast‐enhanced T1 subtraction maps to increase lesion conspicuity, the removal of qualitative nonenhancing tumor assessment requirements, the use of the postradiation time point as the baseline for newly diagnosed GBM response assessment, and treatment‐agnostic response assessment rubrics for identifying pseudoprogression, pseudoresponse, and a confirmed durable response in newly diagnosed and recurrent GBM trials [13]. Response assessment in LGGs has additional limitations because many LGGs lack contrast enhancement and there is a poor correlation between clinical response and post‐treatment imaging appearance of LGGs. These tumors grow fairly slowly, so it may take a long time to arrive at a 25% increase in lesion size (the typical threshold for radiographic progression in HGG). Therefore, RANO criteria introduced the category of minor response, which is defined as a 25–49% decrease in size of the T2/FLAIR hyperintense lesion [14]. RANO criteria are limited in the pediatric population because of the wide variability of cerebral tumors in such a population and the absence of consensus about the definitions of tumor response to treatment or progression [15]. As regards immunotherapy, immunotherapy‐RANO (iRANO) criteria represent specific additional guidance for the determination of glioma response criteria in this scenario, which more frequently causes post‐treatment changes, including pseudoprogression [14–16]. Due to the gadolinium enhancement limitations for the differentiation between treatment‐induced changes and tumor recurrence, advanced functional imaging techniques have been proposed for a better assessment of brain tumors. Perfusion imaging is a powerful tool in the imaging of brain tumors, improving differential diagnostics, tumor grading, and the planning and monitoring of different therapy modalities. There are two major approaches to measure cerebral perfusion with MRI. The first is the application of an exogenous, intravascular, nondiffusible contrast agent, usually a gadolinium‐based contrast agent (GBCA), that emphasizes either the susceptibility effects of GBCAs on the signal echo, namely first‐pass dynamic susceptibility contrast‐enhanced (DSC) MRI perfusion, or the relaxivity effects of GBCAs on the signal echo, namely dynamic contrast‐enhanced (DCE) MRI perfusion. The second is the application of an endogenous contrast agent using magnetically labeled arterial blood water as a diffusible flow tracer in arterial spin labeling (ASL) magnetic resonance perfusion. DSC‐MRI is a technique in which the first pass of a bolus of GBCA through the brain tissue is monitored by a T2‐weighted MRI acquisition. This permits calculation of hemodynamic parameters such as time to peak (TTP), cerebral blood volume (CBV), cerebral blood flow (CBF), and mean transit time (MTT), with CBF equaling CBV divided by MTT [17, 18]. For neuro‐oncology applications, relative CBV (rCBV) compared to normal‐appearing white matter is by far the most commonly used DSC‐MRI parameter [17]. Several studies have investigated the value of CBV measurements for establishing an initial diagnosis of neoplasm [19–23], glioma grading [24, 25], prognosis assessment [26–30], biopsy planning [31–33], predicting malignant transformation of LGG to HGG [34–36], and monitoring treatment response to antiangiogenic drugs [37–39] and immunotherapies [40–42]. Another useful and extensively studied application of CBV in brain tumors is represented by the distinction of tumor recurrence and post‐treatment‐related contrast enhancement due to pseudoprogression or radiation necrosis [40–49]. Moreover, recent studies have investigated the relationship between CBV measurements and molecular characteristics of brain tumors (radiogenomics) [28, 50–54]. Also, several studies investigated the value of CBV measurements for glioma grading, demonstrating that higher CBV (due to the angiogenesis) was mainly related to higher tumor grade [55–57], though proper DSC‐MRI methodology is required for making this classification [25]. However, in light of the updated WHO classification, the previous attempts to perform glioma grading based on CBV measurements may now seem of limited clinical importance; in fact, initial studies have suggested a causal relationship between IDH mutation status, which now constitutes one of the major molecular parameters for classifying gliomas, and angiogenesis measured by CBV [50, 58]. DSC‐MRI may also help to predict therapeutic efficacy prior to treatment. Several studies have demonstrated that stratifying patients based on their CBV at baseline facilitates prediction of treatment response, namely, patients with lower CBV were shown to have better outcomes as measured by both progression‐free survival (PFS) and overall survival (OS), thus potentially aiding patient selection for bevacizumab therapy [37, 39, 59]. Similarly to antiangiogenic treatment, the assessment of treatment response to immunotherapy on conventional MRI is challenging [60], and DSC can readily distinguish between radiation necrosis and recurrent tumor, albeit with different optimal CBV thresholds depending on the specific DSC‐MRI protocol [61, 62]. A qualitatively similar approach to perfusion imaging relies on the acquisition of a time series of T1‐weighted images during bolus application. This technique, named DCE imaging, allows the quantification of vessel permeability, which may represent a confounding factor in DSC‐based perfusion imaging. The most commonly used quantitative DCE‐MRI method is based on a two‐compartment pharmacokinetic model, the Tofts model [63]. When an arterial input function is determined, pharmacokinetic modeling can yield the following metrics: the volume transfer constant of GBCA from the intravascular space to the extravascular extracellular space (EES), (Ktrans), the volume fraction of the EES (Ve), the rate constant (Kep = Ktrans/Ve), and the fractional volume of the plasma space (Vp) [64, 65]. An increase in leaky vessels implies increased biologic activity and an aggressive tumor nature, and a strong correlation has been found between Vp and the microvessel area of histopathologic specimens [66]. Grading of glioma is feasible, and studies have revealed that HGG have significantly higher Ktrans, Vp, and Ve than LGG [65–73]. Also, it has been observed that elevated Ktrans values prior to treatment are associated with worse PFS and OS in newly diagnosed GBM [74]. The differentiation of true PD from pseudoprogression (PsP) is challenging on conventional MRI, and the potential of DCE‐MRI for distinguishing these two entities has been studied. Using pharmacokinetic parameters, PsP demonstrated lower Ktrans, Ve, and Vp compared with tumor progression in GBM [75, 76]. Another study including gliomas and brain metastases showed that increased Vp ratio and Ktrans ratio were significantly associated with progression but not with radiation injury [77]. The microvascular sensitivity of DCE‐MRI has potential utility for assessing the response to antiangiogenic therapy, and several studies support the use of Ktrans as a predictive biomarker to stratify good and bad responders for antiangiogenic treatment [78, 79], namely, in patients with recurrent GBM, baseline Ktrans prior to bevacizumab treatment was able to predict PFS and OS [78]. ASL is an alternative tool for measurement of CBF which uses magnetically labeled water in blood vessels as an endogenous diffusible tracer. The ASL is an entirely noninvasive examination in regard to the absence of an exogenous GBCA and it can be a good alternative to DSC‐MRI in patients considered at risk from GBCA, including those with renal disease, those who are pregnant, and pediatric patients. ASL enables the measurement of the CBF using labeled endogenous blood, creating a normalized CBF map, thus resulting in the differential diagnosis scenario of LGG and HGG [80–94]. One of the clinical challenges for brain tumor biopsy is the potential underestimation of the histological grade due to the stereotactic biopsy sampling of only a small portion of the tumor. Given the correlation between the histopathologic vascular density of brain tumors and CBF maps in ASL, CBF maps can be useful for guiding tumor biopsies and reducing the sampling error [95]. Furthermore, ASL aids in the differentiation of PsP from PD in patients who develop contrast‐enhancing lesions after standard treatment; ASL is also helpful in uninterpretable DSC‐MRI findings due to hemorrhage or contrast leakage, especially in post‐treatment brain tumors, as this technique is relatively robust to susceptibility artifact [96]. Finally, CBF can be used to stratify PFS in GBM because the presence of high tumoral CBF was associated with significantly shorter PFS [97]. Diffusion‐weighted imaging (DWI) measures the ability of water molecules to freely diffuse in their environment. The apparent diffusion coefficient (ADC) is derived from DWI as a quantitative metric or water molecule diffusivity within the tumor and has been widely used for glioma assessment, grading, and treatment monitoring. Two recent meta‐analyses similarly show an inverse correlation between ADC levels and cellularity [98, 99]. Differentiation of pseudoprogression from true progression has become a major clinical problem, and several studies have used DWI to better solve this issue. A meta‐analysis explored seven studies that investigated the feasibility of DWI in differentiating PD from pseudoprogression. The authors showed that DWI has conveyed better accuracy than conventional imaging in discriminating true from pseudoprogression, but the diagnostic performance of DWI is subordinate compared to magnetic resonance perfusion and magnetic resonance spectroscopy (MRS) [100]. Furthermore, other diffusion‐based techniques have emerged for their potential in glioma grading, such as intravoxel incoherent motion (IVIM) and diffusion kurtosis imaging (DKI) [100–103]. IVIM imaging is a method proposed to separate the signal arising from a diffusion sequence into vascular and nonvascular components. It assumes an isotropic and sufficiently randomly laid microvasculature network so that water molecules in the blood experience many random direction changes during the motion sensitizing period of the diffusion sequence. Under those assumptions, a pseudo‐diffusion coefficient, D*, can be defined, which describes macroscopically the incoherent movement of blood in the microvasculature compartment, as well as a perfusion fraction, f, that describes the fraction of incoherent signal that arises from the vascular compartment in each voxel over the total incoherent signal. Furthermore, a theoretical relationship between the IVIM perfusion parameters f, D*, and fD* (the multiplication of the first two parameters) and the classical perfusion parameters, CBV, MTT, and CBF has been derived. The expected behavior of signal amplitude as a function of b value in this model has been shown to be biexponential [104]. DKI is an advanced non‐Gaussian diffusion imaging technique that can be used to account for this deficiency. It provides a more accurate model of diffusion for quantifying the deviation from a Gaussian distribution, which is known as kurtosis [105]. By acquiring data for at least two nonzero diffusion gradient factors (b value) in more than 15 nonlinear directions, the kurtosis metrics (including mean kurtosis [MK], axial kurtosis [Ka], and radial kurtosis [Kr]) and conventional diffusion metrics (including mean diffusivity [MD], axial diffusivity [Da], radial diffusivity [Dr], and fractional anisotropy [FA]) are obtained simultaneously. Another opportunity is represented by diffusion tensor imaging (DTI), which creates a map of integrity and orientation of white‐matter tracts, using anisotropic measures such as FA, planar anisotropy (CP), spherical anisotropy (CS). and linear anisotropy (CL). Interesting results have been shown by a study in which the CP was the single best predictor of true progression in glioma patients [106]. MRS is an imaging diagnostic method that allows the noninvasive measurement of metabolites in tissues. Several metabolites can be identified by standard brain proton MRS but only a few of them have a clinical significance in diagnosis of gliomas, including N‐acetylaspartate, choline, creatine, myo‐inositol, lactate, and lipids. LGG are generally characterized by a relatively high concentration of N‐acetylaspartate, a low level of choline, and absence of lactate and lipids. The increase in creatine concentration indicates LGG with earlier progression and malignant transformation. Further, the de‐differentiation of a glioma is reflected in the progressive decrease in the N‐acetylaspartate and myo‐inositol levels on the one hand and the elevation in choline level up to grade III on the other. Malignant transformation of the glial tumors is also accompanied by the presence of lactate and lipids in magnetic resonance spectra of grade III but mainly grade IV gliomas. It follows that MRS is a helpful method for detection of glioma regions with aggressive growth or upgrading due to favorable correlation of the choline and N‐acetylaspartate levels with histopathological proliferation index Ki‐67. Thus, MRS is also a suitable method for the targeting of brain biopsies. MRS can also be used to distinguish recurrent glioma from radiation necrosis thanks to the choline/N‐acetyl acetate (Cho/NAA) and choline/creatine (Cho/Cr) ratios [107]. MRS has also been proposed as a convenient method to noninvasively detect 2‐hydroxy glutarate (D‐2HG) in glioma patients. Because D‐2HG is intimately connected to the mechanisms of glioma‐genesis, it can provide high specificity and sensitivity for determination of IDH status and the prediction of patient response to treatment. This is also relevant for patients who may have inoperable tumors or those in which biopsy cannot be performed due to safety reasons. Furthermore, a meta‐analysis demonstrated the highest diagnostic performance of MRS, compared with perfusion magnetic resonance and DWI, in discriminating PD from pseudoprogression [100]. Chemical exchange saturation transfer (CEST) MRI provides molecular information about imaging targets that cannot be obtained with standard anatomical imaging techniques. CEST MRI enables large signal amplification of low‐concentration molecules in vivo. The signal is generated by the chemical exchange of H‐protons of the solute of interest with those of water. It can be used to measure the concentration of in vivo metabolites that can act as biomarkers for tumor evaluation and follow‐up [105–108]. The majority of CEST studies in the literature have focused on detecting the amide proton transfer (APT) effect in various applications. Referring to the high cellular content of aggressive gliomas, a higher concentration of proteins and peptides is expected to be detected within the region of the tumor [109]. APT signals were also found to be significantly higher in areas of tumor progression compared to areas of therapy‐induced changes [110–113]. Furthermore, APT CEST MRI may have a potential role in assessing glioma response and prognosis prediction because it shows baseline and dynamic changes in lesion acidity (tissue acidosis contributes directly to a microenvironment hospitable to cancer) as an imaging biomarker of residual/viable GBM. Conventional MRI is not always enough for complete glioma evaluation, and newer advanced and innovative MRI techniques are not widely available. Such issues justify the need for molecular imaging in the clinical management of brain tumors that is able to provide additional insights into tumor pathophysiology. Recently, diagnostic shortcomings have been successfully addressed by a significant increase in the application of nuclear medicine in the neuro‐oncological field, also highlighted by the exponential increase of medical publications, particularly for amino‐acidic tracers in the evaluation of treatments response and effects. Additionally, several promising radiopharmaceuticals are under investigation by the scientific community, and new methods and technologies are developing in this field (i.e. machine learning applications and advanced hybrid scanners). Nuclear medicine techniques such as positron‐emitting tomography (PET) and single‐photon emission computed tomography (SPECT) allow specific metabolic and molecular processes to be probed using several radiolabeled molecules [114]. In particular, PET is being increasingly used in the clinical management of glioma (i.e. identification and definition of areas with increased tumor growth activity), providing additional insight to MRI [115, 116]. PET systems nowadays are always offered as a hybrid system integrated with computed tomography (CT, PET/CT) or with MRI (PET/MRI) with several advantages (i.e. attenuation correction, implemented workflow and patient’s compliance, and so on). The benefit in daily routine for a patient consists of a “one‐stop shop” exploration that is possible in hybrid PET/CT and PET/MRI devices. The first application of PET for glioma stratification involved the use of 18F‐fluorodeoxyglucose (18F‐FDG), a glucose analogue tracer widely used in clinical cancer imaging outside the CNS [117]. FDG is actively transported across the intact BBB; the recommended activity to be administered is 185–200 Mbq, and the acquisition is obtained at least 45 minutes after injection through 10–20 minutes static image [118, 119]. The radioactivity in the normal cerebral cortex has to be set near to the maximum of the scale. If lesions have higher uptake than the cerebral cortex, the scale should be adjusted such that the lesion with the highest uptake is near to the maximum of the scale; delayed imaging (3 hours) considerably improves distinction of tumor from normal gray matter. An increased standardized uptake value (SUV) of FDG in cancer cells has been related to the overproduction of glucose transporters, being generally related to tumor de‐differentiation, but high uptake in normal brain tissue and nonspecific uptake of inflammatory benign lesions has limited the FDG accuracy in glioma. According to the latest joint glioma guidelines [120], the main indications for PET imaging include, at primary diagnosis, differentiation of grade III and IV tumors from non‐neoplastic lesions or grade I and II gliomas, prognostication of gliomas, the definition of the optimal biopsy site (i.e. site of maximum tracer uptake), and delineation of tumor extent for surgery and radiotherapy planning (Figure 6.1). Another FDG PET purpose is to monitor the disease and therapy effectiveness through the detection of malignant transformation in grade I and II gliomas. FDG provides added value to MRI in GBM: the tumor‐to‐normal brain tissue ratio (TBR) has been reported to predict survival (OS and PFS). Moreover, FDG PET tends to be useful in differentiating radiation necrosis from tumor recurrence (Figure 6.2). A meta‐analysis of 16 studies on FDG PET showed good accuracy in differentiating glioma recurrence from treatment‐induced changes (pooled sensitivity and specificity 77% and 78%, respectively) [121]. However, due to its high physiological uptake in normal brain gray matter and in inflammatory lesions, FDG plays a limited role in neuro‐oncology. Amino acid tracers are more specific than FDG in brain tumor assessment and have found greater applicability in neuro‐oncology [122]. Amino acid tracers represent the state‐of‐the‐art PET probes in neuro‐oncology able to outperform FDG since they are characterized by a low/absent uptake in acute ischemic injuries, demyelinating processes, and CNS infectious processes. Also, and differently from FDG, amino acid tracers are characterized by a low uptake in normal brain tissue and through a high tumor/nontumor contrast they boosted the use of PET in neuro‐oncology, enabling precise tumor delineation, biopsy planning, and differentiation between recurrence and post‐therapeutic changes. Specifically, the uptake of amino acid probes in brain tumor cells is due to the overexpression of the transporter system and cell proliferation, and correlates with histological grade, showing a higher uptake in HGG. Methionine (MET) also shows some incorporation into proteins and participation in other metabolic pathways [123], but comparative studies between MET, fluoro‐ethyl‐thyrosine (FET), and fluoro‐dihydroxy‐phenylalanine (FDOPA) have shown that imaging of gliomas is similar with these amino acid tracers [124–127]. Amino acid tracers are largely independent from BBB integrity and hence outperform gadolinium by staging both enhancing and nonenhancing brain tumors. Accordingly, amino acid tracers improved the accuracy as in LGG and HGG, with greater specificity than standard MRI for the evaluation of progressive tumors and prognosis assessment for specific therapy (i.e. anti‐angiogenetic drugs) [128]. Figure 6.1 Serial MRI scans in a young patient with midline glioma (WHO grade IV) treated with chemoradiation. The baseline contrast‐enhanced MRI (a) shows strong enhancement (arrow) which has corresponding avid FDG uptake (b, arrow). Three months after concomitant chemoradiation, the size of the tumor has shrunk and it shows markedly less enhancement (c). These conventional appearances in the postcontrast T1‐weighted images were inconclusive whether there was major treatment response or treatment‐related changes. The DWI showed increased signal at b value = 1200 s/mm2 (d, arrow), raising the suspicion of residual tumor, which was confirmed on the follow‐up FDG PET scan (e, arrow). The first amino acid tracer largely studied in the literature is MET. MET targets protein synthesis [129] and, in the assessment of glioma, is a tool able to better assess prognosis than FDG PET [130], although it remains less specific for tumor cell localization than FET PET [129]. MET is labeled with C‐11, and the very short half‐life of C‐11 limits its uses to centres with on‐site cyclotron and radiochemistry facilities. The recommended administered activity is 370–555 Mbq and it does not require BBB disruption to accumulate. The acquisition is performed 10 minutes after the injection, for a 20‐minute static image. The background radioactivity of the healthy brain has to be in the lower third of the range to create standardized conditions for the visual detection of increased tracer accumulation above the background. SUVmax/mean can be calculated as ratios to healthy appearing reference brain tissue (TBRmean and TBRmax), with a cut‐off threshold for the definition of biological tumor volume of SUVmean‐ratio > 1.3 [131] (Figures 6.3–6.6). A meta‐analysis compared the performance of PET using FDG and non‐FDG amino acid tracers, essentially 11C‐MET. The authors concluded that both FDG and MET PET show moderately good accuracies in differentiating glioma recurrence from treatment‐induced changes, with higher specificity for MET (pooled sensitivity and specificity for FDG PET of 77% and 78%, and for MET PET of 70% and 93%, respectively) [121].
6
PET Imaging in Gliomas: Clinical Principles and Synergies with MRI
Introduction
Brain Tumors: Epidemiology and Symptomatology
Brain Tumors: Classification
Gliomas: Histomolecular Classification
WHO Grade II and III Gliomas
WHO Grade IV Glioma: Glioblastoma
MRI for Diagnosis and Response Assessment in Gliomas
Perfusion MRI
DSC‐MRI perfusion
DCE‐MRI perfusion
Arterial Spin Labeling
Diffusion‐weighted Imaging
Magnetic Resonance Spectroscopy
Chemical Exchange Saturation Transfer
Nuclear Medicine Imaging
18F‐Fluorodeoxyglucose
Amino Acid Tracers
MET PET
Related posts:
 Nephro‐urinary Tract Pathologies: A Correlative Imaging Approach
 Lymphoma and Myeloma Correlative Imaging
 Artificial Intelligence in Diagnostic Imaging
 Osteoporosis: Diagnostic Imaging and Value of Multimodality Approach in Differentiating Benign Versus Pathologic Compression Fractures
 The Role of Noninvasive Cardiac Imaging in the Management of Diseases of the Cardiovascular System
 Spine Disorders: Correlative Imaging Approach
Stay updated, free articles. Join our Telegram channel

Full access? Get Clinical Tree


