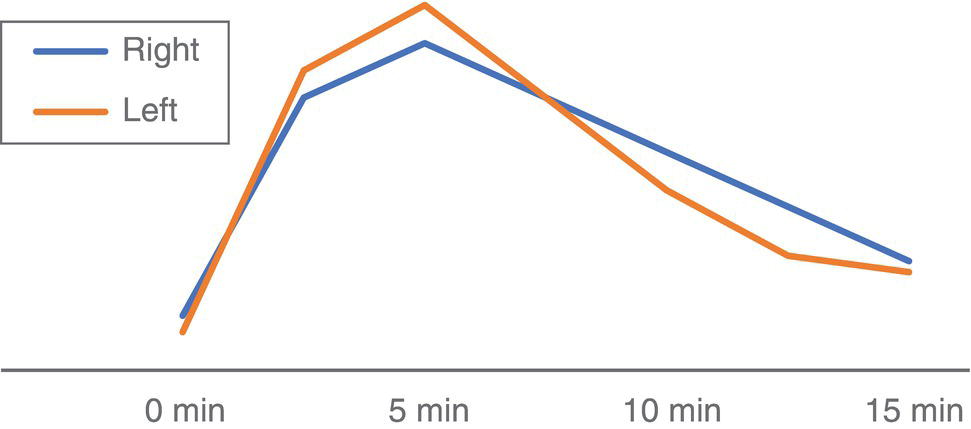
Salar Tofighi1, Thomas G. Clifford1, Saum Ghodoussipour2,3, Peter Henry Joyce1, Meisam Hoseinyazdi4,5, Maryam Abdinejad5,6, Saeideh Najafi1, Fahad Marafi7, and Russell H. Morgan8 1 Department of Radiology, Keck School of Medicine, University of Southern California, Los Angeles, CA, USA 2 Rutgers Robert Wood Johnson Medical School, New Brunswick, NJ, USA 3 Section of Urologic Oncology, Rutgers Cancer Institute of New Jersey, New Brunswick, NJ, USA 4 Shiraz University of Medical Sciences, Shiraz, Iran 5 Department of Radiology, Namazi Hospital, Shiraz, Iran 6 Department of Nuclear Medicine, Namazi Hospital, Shiraz, Iran 7 Jaber Al‐Ahmad Center for Molecular Imaging, Kuwait City, Kuwait 8 Department of Radiology and Radiological Science, Johns Hopkins Medical Institution, Baltimore, MD, USA The primary function of the kidneys is to excrete waste products such as ammonia and drug metabolites, balance electrolytes and acid–base equilibrium, and regulate blood pressure. Given this range of functions, renal and urinary tract diseases can present with varied manifestations, including but not limited to hematuria, flank pain, decreased urine output, fever, hypertension, and irritative voiding symptoms. In fact, some pathologies may be asymptomatic and discovered incidentally. Although ultrasonography, computed tomography (CT), and magnetic resonance imaging (MRI) are the primary imaging modalities for the evaluation of the kidneys and urinary tract, they mainly depict anatomic findings while providing scant data on the functional status of the organs. Scintigraphy provides insight into kidney and urinary bladder perfusion, function, and urodynamics. Indications in adults include the assessment of urinary tract patency, complications of renal transplantation, renal and bladder masses, and renovascular hypertension. Additionally, scintigraphy is indicated when there are contraindications to other imaging modalities, such as hypersensitivity to intravenous contrast. Evaluating vesicoureteral reflux, acute pyelonephritis, and cortical scarring are typical indications of scintigraphy in pediatrics and are further discussed in the related chapters. Renal scintigraphy consists of functional renal imaging (renal activity shown in a nephrogram), renography represented by time‐activity curve, glomerular filtration rate (GFR)/effective renal plasma flow (ERPF) measurement, and cortical anatomic imaging. Correlating various imaging modalities improves our ability to identify pathophysiology and ultimately arrive at the correct diagnosis. However, a prerequisite to interpretation of all radiologic studies is an understanding of the anatomy being imaged. Therefore, we begin with an overview of basic anatomy. Renal physiology is subsequently discussed to provide context to the methods of radionuclide imaging. Next, technical descriptions of renal scintigraphy, disease‐based radiology, and nuclear imaging are provided. The kidneys are situated in the retroperitoneal space adjacent to the psoas muscles at the T11‐L3 level. Each kidney is coated by the renal fascia (Gerota’s fascia), which is visible on CT when thickened. Each kidney is also covered by a tight fibrous capsule, which produces a sharp margin on images. Perirenal fat surrounds the kidneys in the space between the fibrous capsule and renal fascia. Pararenal fat is often seen on the posterolateral side of each kidney. Normal kidneys are approximately 10–14 cm in length, 3–4 cm in width, and 3 cm in anteroposterior thickness. They are typically about 1 cm smaller in women, and the left kidney tends to be slightly larger than the right. Each kidney has a fissure at its medial aspect known as the hilum. The main right and left renal arteries branch from the aorta below the superior mesenteric artery at L1–L2. In most patients, the right renal artery courses posterior to the inferior vena cava and the left courses posterior to the left renal vein. They enter the kidneys at the hilum before branching into segmental and interlobar arteries. Interlobar arteries combine to create the arcuate artery, which is parallel to the renal capsule and can be visualized on Doppler ultrasonography. The renal parenchyma is divided into the inner medulla and outer cortex. The renal medulla consists of pyramids directed toward the hilum while the renal cortex is adjacent to the base of pyramids. The apex of pyramids projects into the calyces that drain into the renal pelvis. The ureters are the continuum of the fibrous capsule and bladder adventitia that start at the renal pelvis and enter the bladder obliquely. Ureteral peristalsis can be observed on ultrasound. On other imaging modalities, the ureters may be opacified by excreted urine. The ureters characteristically narrow at the ureteropelvic and ureterovesical junctions as well as the pelvic inlet. The kidneys receive approximately 20% of cardiac output, or about 500 mL/min. About 250–300 mL/min constitutes renal plasma flow that mostly enters glomeruli. The Bowman’s capsule filters 20% of plasma flow, which then courses through the renal tubules to the collecting ducts and calyces, forming urine. Of the created filtrate, 99% is reabsorbed by renal tubules, predominantly by the proximal tubules [1]. The transit time from glomeruli to collecting system (parenchymal transit time) depends on urine flow within the tubules, typically taking about 2 minutes. Antidiuretic hormone is released in response to dehydration, resulting in a small amount of reabsorption within the distal tubules. However, moderate dehydration will not significantly alter parenchymal transit time. As urine travels across tubules and reaches the collecting system, transit speed decreases as the volume of urine drops within the tubule. Reduced distal speed results in the same parenchymal transit time for glomerular filtrates as secretions of the proximal tubule. Images in renal scintigraphy are obtained using a large field of view gamma camera with a parallel hole collimator. When imaging native kidneys, the camera is positioned posteriorly at the lumbar region with the patient supine. Technetium‐99m (99mTc) serves as the prime labeled radiopharmaceutical, as it possesses no risk of allergic or anaphylactic reactions and exposes providers to cumulative radiation amounts below the standard yearly safe threshold. Renal radiopharmaceuticals function through one of three mechanisms: With dynamic (sequential) scintigraphy, tubular extraction (99mTc‐MAG3) and glomerular filtration (99mTc‐MAG3) tracers are used and serial images are acquired 20–30 minutes after injection. The patient must be well hydrated prior to tracer injection to ensure adequate radiotracer clearance. The bladder should also be emptied immediately prior to image acquisition, as a full bladder can delay tracer accumulation. Regions of interest (ROI) are then assigned around each kidney or around the cortex, but they may also be placed on the collecting system and ureter to evaluate urinary tract patency. An additional ROI should be assigned below each kidney to compare background activity with renal activity for generation of a renogram curve (Figure 18.1). Figure 18.1 Normal renogram. Nephrography is composed of three phases: Following dynamic imaging, a static image may be acquired to ensure tracer clearance. The following parameters are used for the quantitative reporting of renogram curves. A cortical radiopharmaceutical, most commonly DMSA, can be used to obtain static scintigraphic images. No patient preparation is required, but patient hydration is suggested following tracer injection and prior to imaging to decrease the deposition of nonreabsorbed tracer in the bladder. Standard protocol includes anterior, posterior, and posterior oblique views. Image acquisition is performed 3 hours following radiotracer injection. Static scintigraphy is commonly used to evaluate pediatric cortical injuries, which is further discussed in the respective chapter (chapter 25). Additional pediatric indications include acute pyelonephritis, cortical scar follow‐up, horseshoe or ectopic kidney, and renal agenesis. In the adult population, static scintigraphy may be used to evaluate malignant renal masses and transplant complications. Urinary obstruction is a common urologic complaint, typically presenting with hydronephrosis and hydroureter on imaging. It may manifest with flank pain or be found incidentally on routine imaging. Obstruction is most commonly caused by nephrolithiasis, in which case imaging is performed to obtain information regarding stone size and location in order to guide management. Small stones are more likely to pass spontaneously and may be managed in the outpatient setting whereas larger stones may require more urgent intervention. Hydronephrosis and hydroureter may also occur due to nonobstructive causes such as vesicourethral reflux, urinary tract infection or previous obstruction (“memory hydronephrosis”). Low‐dose CT is often the initial study performed in the evaluation of nephroureteral obstruction. The sensitivity and specificity of low‐dose CT for the detection of urolithiasis are 95 and 97%, respectively [3]. The administration of intravenous contrast reduces the sensitivity of CT in the detection of small stones. CT can also identify noncalculus etiologies of obstruction, such as urothelial cell carcinomas or extrinsic compression from abdominopelvic masses. New low‐dose modalities with iterative reconstruction have significantly decreased radiation exposure and preserved accuracy at the expense of reduced sensitivity for the assessment of other pelvic abnormalities. Ultrasonography is less reliable than CT for stone detection and is used when CT is not available or contraindicated. Although ultrasonography reliably detects hydronephrosis and hydroureter, it demonstrates a significantly lower sensitivity (70%) and specificity (75%) than CT in detection of renal stones and typically overestimates stone size [4]. Unlike large stones that demonstrate posterior acoustic shadowing, stones less than 5 mm may not be visualized on ultrasonography. While ultrasound is the preferred initial modality in children and pregnant women, follow‐up imaging with an alternative modality may be indicated to better demonstrate stone size. Ultrasound is sometimes combined with plain radiographs of the kidney, ureter, and bladder (KUB) to increase sensitivity of stone detection. Evaluation with KUB alone has limited use for the evaluation of obstruction as its sensitivity is greatly influenced by the size, location, and composition of the stone. Color flow or pulse wave Doppler demonstrate higher resistive indices relative to contralateral unaffected kidney in obstructive disease. Additionally, periodic efflux of urine from the vesicoureteral junction to the bladder (ureteric jet) occurs less often, and is shorter and slower. Physiologically, ureteric jets occur twice or more per minute with a duration of 6 seconds or more. A maximum jet velocity lower than 19.5 cm/s indicates renal obstruction. Intravenous pyelography (IVP), also known as intravenous urography (IVU), uses iodinated contrast and can reliably depict hydronephrosis, but it has low sensitivity for detection of nephrolithiasis. In IVP, a precontract radiograph is obtained followed by multiple additional postcontrast radiographs in varying views. Delayed accumulation of contrast followed by concentration of contrast within the cortex and medulla is indicative of obstruction. Given the availability and advantages of CT, IVP is rarely performed. MRI demonstrates significantly less sensitivity than CT in the detection of stones and cannot differentiate stones from other filling defects such as tumors or blood clots [5]. Rarely it is indicated in pregnant women following ultrasonography to distinguish between physiologic dilation in pregnancy and renal stone. The most common indication for radionuclide imaging in renal disease is evaluation of nephroureteral patency. Radionuclide imaging provides pivotal information as to the degree of functional impairment and urodynamics of the collecting system. Even small stones can cause significant functional impairment, which may alter management. Preserved renal function is crucial as sufficient urine excretion of the radiopharmaceutical agent is required to produce adequate images. The tubular agent 99mTc‐MAG3 is the radiotracer of choice in the evaluation of obstruction since its tubular excretion decreases later than glomerular excretion.
18
Nephro‐urinary Tract Pathologies: A Correlative Imaging Approach
Nephro‐urinary Tract
Anatomy
Image Acquisition
Dynamic (Sequential) Scintigraphy
Static Scintigraphy
Evaluation of Nephroureteral Obstruction
Radiology
Nuclear Medicine
Related posts:
 Lymphoma and Myeloma Correlative Imaging
 Artificial Intelligence in Diagnostic Imaging
 Osteoporosis: Diagnostic Imaging and Value of Multimodality Approach in Differentiating Benign Versus Pathologic Compression Fractures
 The Role of Noninvasive Cardiac Imaging in the Management of Diseases of the Cardiovascular System
 A Correlative Approach to Breast Imaging
 Infection/Inflammation Imaging
Stay updated, free articles. Join our Telegram channel

Full access? Get Clinical Tree


