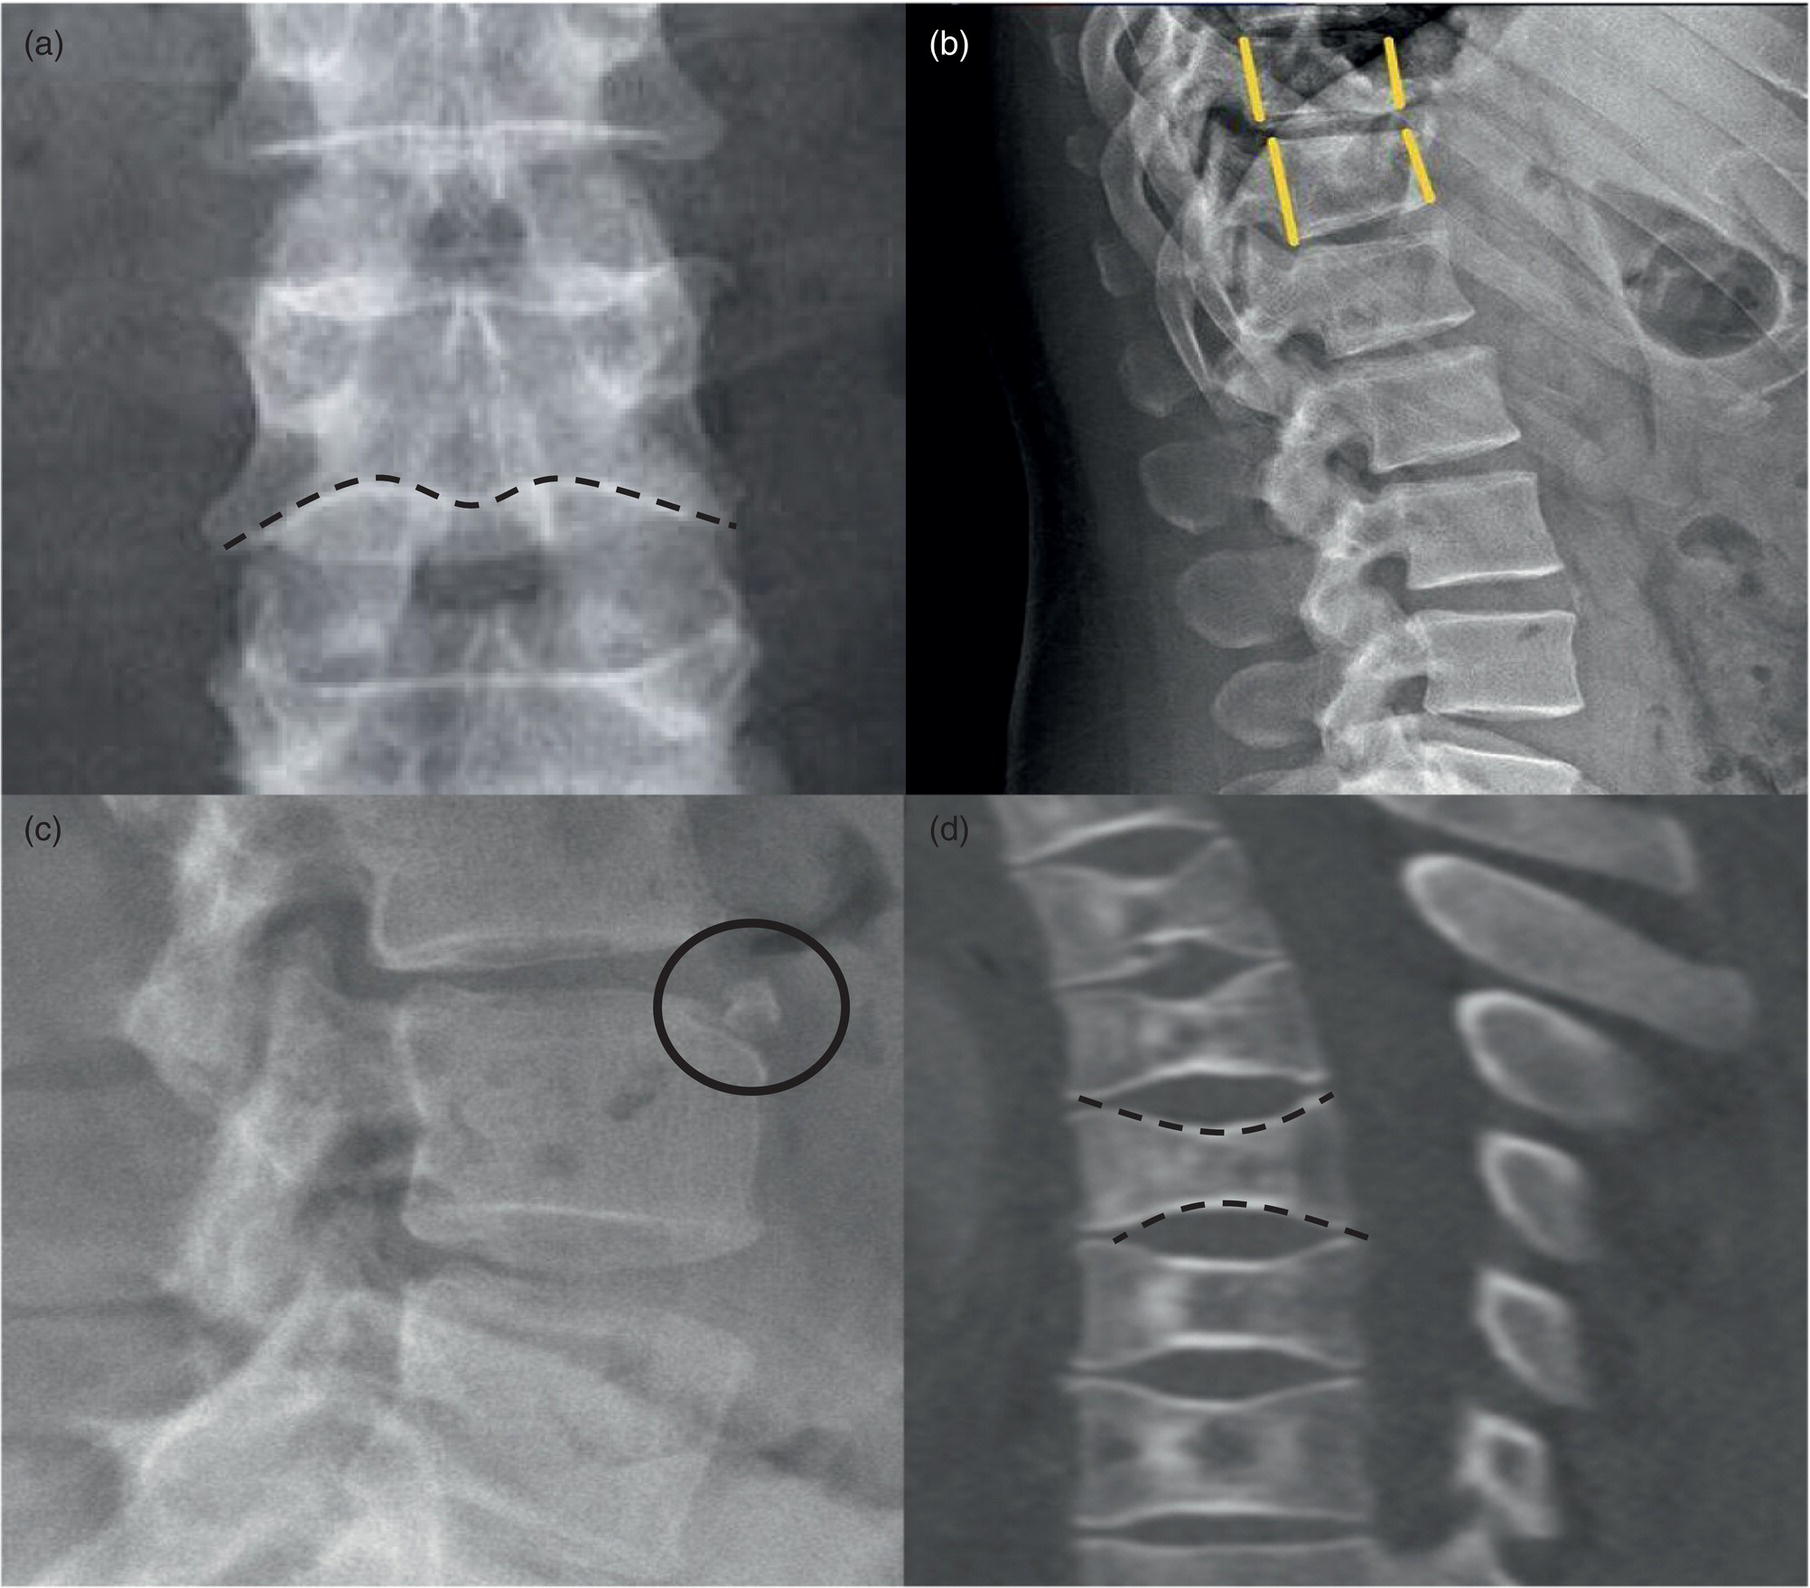
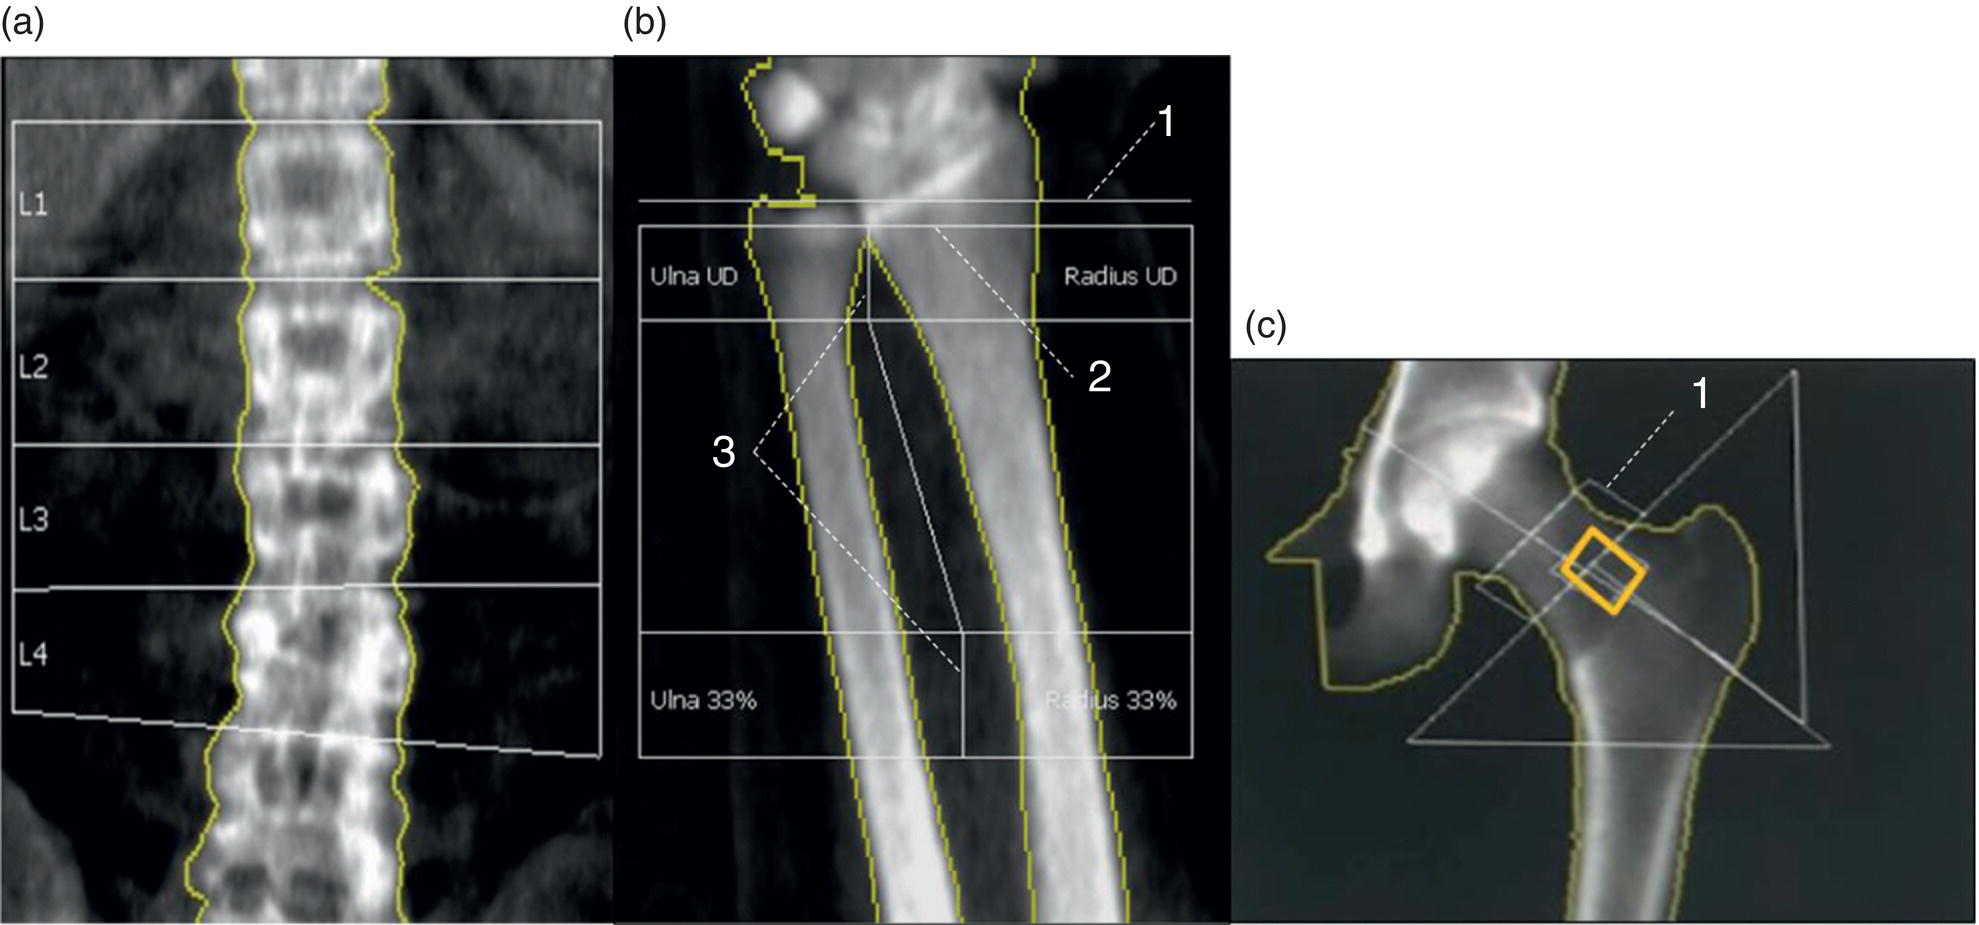
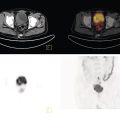
Daniela Garcia, Shambo Guha Roy, and Reza Hayeri Department of Radiology, Mercy Catholic Medical Center, Darby, PA, USA Osteoporosis is a progressive systemic disorder characterized by an initial loss of bone strength, defined by decreased bone mineral density (BMD), and microarchitecture damage, predisposing the bones to increased skeletal fragility [1]. Pathophysiology is multifactorial, which includes estrogen deficiency, imbalance of bone remodeling, and abnormal cytokine production. These have become the foundation for identifying modifiable risk factors and establishing therapeutic interventions to halt or regress the disease. This metabolic disorder is associated with increased mortality and morbidity among the elderly and a considerable economic burden for the healthcare system. In the United States, 53.6 million people over the age of 50 years suffer from either low bone mass or osteoporosis, the latter affecting 10.2 million people, and this results in 1.5 million fractures per year [2, 3]. It is estimated that at least 19% of women will require daily assistance in nursing homes after a hip fracture, and approximately 20% will die within 1 year [1]. Direct medical costs associated with osteoporotic fractures were estimated at up to US$20 billion in 2005 and a 50% increase in costs is projected by 2025 [4]. Despite their importance, osteoporosis and low bone density are underdetected in the United States. Osteoporosis is typically associated with a high economic and medical burden associated with its complications. As such, the United States Preventive Services Task Force (USPSTF) recommends screening for osteoporosis in women 65 years and older and in younger women whose fracture risk is equal to or greater than that of a 65‐year‐old white woman who has no additional risk factors. Subtle initial manifestations like progressive loss of height, changes in posture with nonspecific symptoms such as chronic pain, and declining performance status make osteoporosis a clinical challenge for physicians. Diagnosis of osteoporosis can be made clinically or by BMD measurement by imaging, particularly dual‐energy absorptiometry (DXA). Clinically, fragility fractures tend to be the single major sign suggesting the disease. Fragility skeletal fractures are fractures that occur spontaneously or after minor trauma (e.g. fall from standing height), particularly at the humerus, wrist, spine, hip, and rib [5]. Fracture risk assessment (FRAX) was developed to help clinicians evaluate 10‐year hip and major osteoporotic fracture probability. FRAX is calculated from DXA‐derived hip BMD and 11 other clinical variants, namely age, sex, weight, height, previous fracture, history of hip fracture in parents, consumption of alcohol, current smoking, use of glucocorticoids, presence of rheumatoid arthritis, and secondary osteoporosis. Some high‐risk patients can be selected for preventive treatment based solely on clinical history even in the absence of BMD measures. A clinical diagnosis of osteoporosis can also be made when the FRAX scores for major osteoporotic and hip fracture are higher than 20% and 3%, respectively [6]. As mentioned earlier, clinical diagnosis of osteoporosis can be challenging since osteoporotic vertebral fractures are often asymptomatic and occur slowly over time. In fact, osteoporotic compression fractures are frequently detected as an incidental finding in patients in whom the study was performed for other reasons. Imaging plays an integral role in screening, diagnosis, and monitoring response to treatment. Conventional radiography is a common modality to identify fragility fractures. However, these fractures are often underdiagnosed, particularly in the spine. Vertebral fractures can be graded using Genant’s classification. This semiquantitative method evaluates areas with loss of endplate height and wedging compared to unaffected areas of the same vertebral body. Loss of >20% of height is consistent with compression fracture (Figure 23.1) [7]. Genant’s classification is a standardized, reliable, and reproducible method of diagnosing vertebral fractures, but it lacks the ability to determine the age of the fracture, and it doesn’t account for normal anatomic variants (e.g. Cupid’s bow, limbus vertebra, normal gradual minimal vertebral body height loss in the thoracic spine) or manifestations of systemic diseases (e.g. H‐shaped vertebra in sickle cell, Schmorl’s nodes in Scheuermann disease) (Figure 23.2). DXA is the gold standard for BMD measurement. DXA values have been validated to diagnose primary and secondary osteoporosis, monitor treatment response, and estimate fracture risk (FRAX, discussed above). DXA utilizes two different energy X‐rays, which have different attenuation values for bone and soft tissues. BMD is usually measured in the central skeleton (i.e. lumbar spine and hip) and in certain circumstances (e.g. hyperparathyroidism) in the non‐dominant forearm. This modality is ubiquitously available, cheap, easy to use, reproducible, and has very low levels of radiation (less than 10 μSv). DXA has a very low coefficient, variance, around 1−1.5% for spinal and total femoral BMD and 2–2.5% for femoral neck BMD. This small variation in measurements makes DXA an ideal follow‐up tool. The World Health Organization (WHO) recognizes a classification for BMD based on standard deviation (SD) difference between a young adult reference population and that of the patient. T‐score and Z‐score definitions for the diagnosis of osteoporosis are summarized in Table 23.1. Special attention to image acquisition quality, interpretation, and reporting is essential to avoid unnecessary medical costs and improve patient healthcare. Evaluation of image quality must be the first step in the assessment of a DXA study (Figure 23.3). Quality control considerations for each site are summarized in Table 23.2. The International Society for Clinical Densitometry (ISCD) recommends that patients are evaluated with the same densitometer at the same facility for every study. T‐score values may vary between different vendors and this does not necessarily represent a significant change in BMD. Figure 23.1 Genant’s semiquantitative grading system for evaluation of vertebral fractures based on maximum reduction of the vertebral height. (a) Grade 1 (mild) represents 20–25% vertebral body height loss, (b) grade 2 (moderate) represents vertebral body height loss of 26–40%, and (c) grade 3 (severe) represents >40% height loss. Figure 23.2 Examples of normal variants and mimickers of vertebral fractures on radiographs. (a) Cupid’s bow sign (dashed line) is normal parasagittal smooth and symmetric concavities in the endplates of vertebral bodies on the frontal view mimicking endplate compression fracture. (b) Anterior wedging of vertebral bodies from T1 to L2 can be a normal variant if the anterior vertebral body height loss is up to 10–15% less than its posterior height. (c) The limbus vertebra is a well‐corticated unfused secondary ossification center (circle) usually in the anterosuperior endplate of a vertebral body. (d) H‐shaped vertebra is the central endplate depression of the vertebral body endplates (dashed line). It is a characteristic finding in approximately 10% of patients with sickle cell disease. It is the result of microvascular endplate infraction from underlying hemoglobinopathy. A multimodality approach to interpretation is encouraged. Clinical history and correlation with prior and other relevant imaging modalities may provide additional information that changes the final diagnosis and troubleshoots challenging cases (Figures 23.4 and 23.5). Standardized reporting templates are recommended for all institutions, especially if there is more than one certified radiologist interpreting the studies. The report must contain clear and concise diagnostic information with adequate recommendations to the provider. As mentioned above, manufacturer and model must be added to ensure consistency of diagnosis. One single diagnostic impression must be included in the report, indicating the lowest category based on the lowest measured BMD. In assessing the spine, the BMD of at least two adjacent vertebrae and preferably L1–4 should be reported. If the difference between the two adjacent vertebrae is more than one SD or the vertebra is distorted (e.g. severe degenerative changes, instrumentation), that level should be excluded from assessment (Figure 23.4). The presence of artifacts and acquisition quality must be reported, as well as any excluded site followed by the rationale behind such decision. Finally, the addition of the FRAX score has proved to be helpful in decision‐making, especially for patients with osteopenia that could benefit from initiation of treatment [8]. Table 23.1 Diagnostic categories and correct nomenclature based on WHO classification for BMD measured by dual energy X‐ray absorptiometry. BMD, bone mineral density; SD, standard deviation. Target group for utilizing T‐score: postmenopausal women and men 50 years of age or older. Target age group for utilizing Z‐score: premenopausal patients or men under 50 years of age. DXA can also be used to assess treatment response, but the data are less robust than fracture risk prediction. Patients with stable or improving BMD are encouraged to be on the same treatment, whereas nonresponders are considered for alternate medications. The high spatial resolution makes computerized tomography (CT) ideal for the evaluation of bone integrity. Low attenuation and qualitative loss of cortical and trabecular volume throughout the bone can suggest a diagnosis of osteoporosis. Despite the lack of consensus in official thresholds, a linear decreased attenuation, measured in Hounsfield units (HU), in the trabecular region of interest (ROI) at a single lumbar level seems to correlate with osteoporosis in the elderly [9]. Features like anterior wedging, retropulsion of the fracture, and vacuum phenomenon in the spine are classic signs for osteoporotic fractures (Figure 23.6). More advanced techniques such as bone marrow analysis with dual‐energy CT can also be valuable and comparable to MR evaluation to determine the age of the fracture (Figure 23.6) [10].
23
Osteoporosis: Diagnostic Imaging and Value of Multimodality Approach in Differentiating Benign Versus Pathologic Compression Fractures
Introduction
Diagnosis
Imaging
Conventional Radiography
Dual‐energy Absorptiometry
Interpretation and Reporting
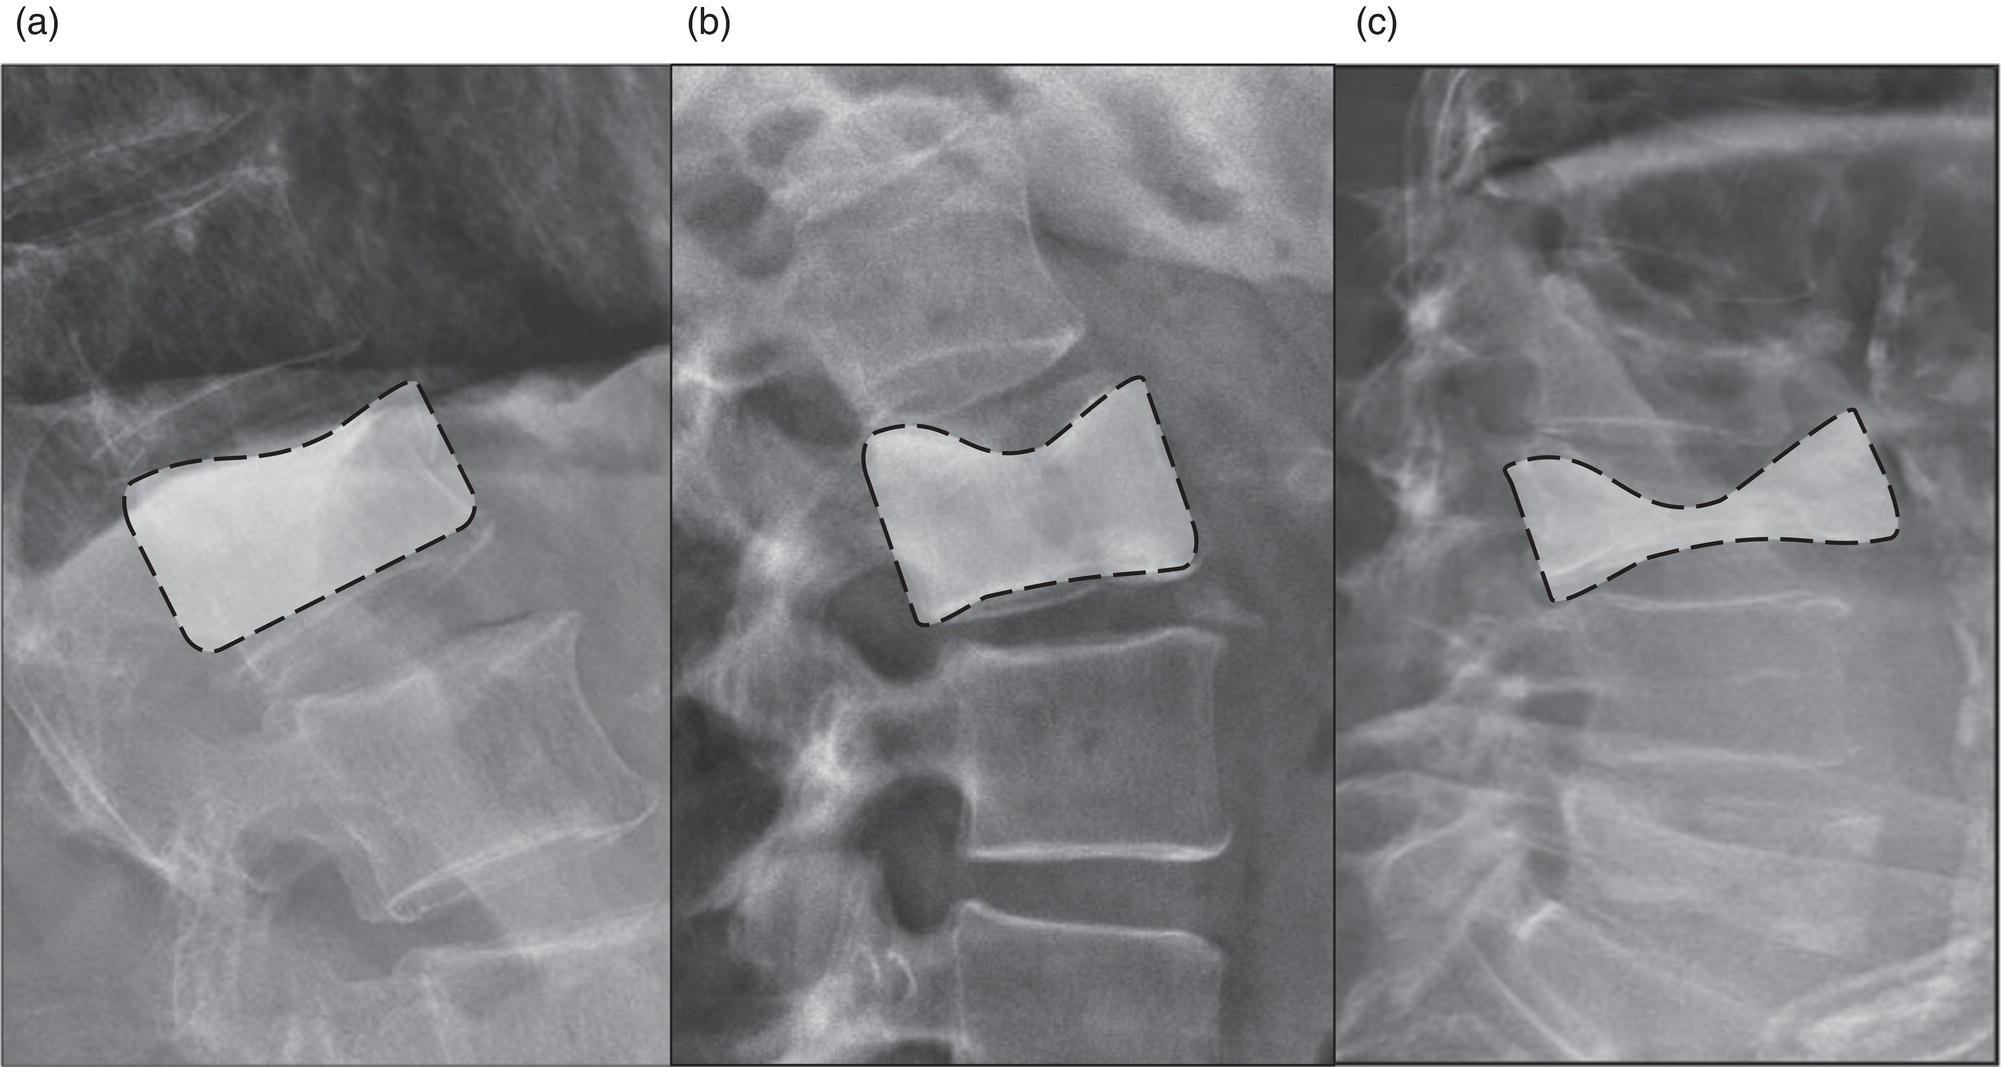
Normal
−1 SD ≤ T‐score
Low bone mass (osteopenia)
−1 SD < T‐score < −2.5 SD
Osteoporosis
T‐score ≤ −2.5 SD
Severe (manifest) osteoporosis
T‐score ≤ −2.5 SD and one or more fragility fracture present
Within expected range for age
Z‐score > −2 SD
Below expected for age
Z‐score ≤ −2 SD
CT and Dual‐energy CT
Related posts:
 Nephro‐urinary Tract Pathologies: A Correlative Imaging Approach
 Lymphoma and Myeloma Correlative Imaging
 Artificial Intelligence in Diagnostic Imaging
 Imaging in Gliomas: Clinical Principles and Synergies with MRI
 The Role of Noninvasive Cardiac Imaging in the Management of Diseases of the Cardiovascular System
 Spine Disorders: Correlative Imaging Approach
![]()
Stay updated, free articles. Join our Telegram channel

Full access? Get Clinical Tree


