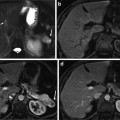
Fig. 1
MR imaging features of regenerative nodule. (a) Fat-suppressed FSE T2-weighted axial MR image shows approximately 2 cm-sized subtle low-signal-intensity nodule in segment VIII of the liver (white arrow). (b) On T1-weighted image, this nodule shows iso-signal intensity to surrounding liver parenchyma (white arrow). (c) On arterial phase Gd-EOB-DTPA-enhanced image, this nodule shows no arterial enhancement. (d) On portal venous phase, this nodule shows iso-signal intensity. (e) On hepatobiliary phase image obtained 20 min after administration of Gd-EOB-DTPA, this nodule shows iso-signal intensity. Subtle hyperintensity is also seen at the periphery of this nodule. On pathologic exam, this nodule is diagnosed with regenerative nodule
Dysplastic Nodule
A dysplastic nodule is defined as a nodule of hepatocytes of at least 1 mm in diameter, and is composed of hepatocytes that display histologic characteristics of abnormal growth but do not meet the histologic criteria for malignancy [12]. Dysplastic nodules usually occur in the setting of cirrhosis and may be classified as low or high grade, according to the degree of dysplasia [12, 26]. Dysplastic nodules are found in 15–25 % of cirrhotic livers [102]. Dysplastic nodules are characterized histologically by progressive architectural derangement, nuclear crowding, atypia, and a variable number of unpaired arterioles or capillaries [26]. Low-grade dysplastic nodules closely resemble the regenerative nodules histologically. These nodules are composed of hepatocytes with minimal atypia, including slightly increased nuclear/cytoplasmic ratio, minimal nuclear atypia, and absent mitosis as well as have the normal vascular profile, hepatocellular function, and Kupffer cell density [12]. Low-grade dysplastic nodules are considered to have low malignant potential with slow, infrequent progression to HCC and are not thought to be premalignant [103]. To the contrary, high-grade dysplastic nodules show at least moderate dysplasia, some architectural distortion, and occasional mitosis, with sinusoidal capillarization and an increased density of unpaired arteries [104]. They may even express alpha-fetoprotein (AFP) but are not frankly malignant [105]. The Kupffer cell density is variable; it may be increased, normal, or diminished [106–108]. High-grade dysplastic nodules are thought to progress to HCC more frequently than low-grade dysplastic nodules [103]. They are considered as premalignant, and development of HCC within a dysplastic nodule has been reported within as little as 4 months [109, 110]. However, the rate of malignant transformation of dysplastic nodules is relatively slow, and it has been suggested that both high- and low-grade dysplastic nodules may disappear on follow-up studies and that only a small percentage of high-grade dysplastic nodules progress to HCC [26, 111]. As expected on the basis of their heterogeneous histologic characteristics, dysplastic nodules have variable appearance on MR images, and their signal intensity characteristics overlap with those of regenerative nodules and well-differentiated HCC [26] (Figs. 2 and 3). However, many of dysplastic nodules usually have similar signal intensity on T1- and T2-weighted images to regenerative nodules; thus, they are isointense to surrounding liver parenchyma [9]. Some dysplastic nodules can retain copper, which causes them to have hyperintensity on T1-weighted images [89]. If siderotic, these nodules are hypointense to surrounding liver parenchyma on T1- and T2-weighted images due to susceptibility effects of iron. Occasionally, both regenerative and dysplastic nodules can infract, leading to high signal intensity on T2-weighted images, and therefore are often mistaken for HCC [112]. Regarding blood supply to dysplastic nodules, low-grade dysplastic nodules are normally supplied by the portal vein, and therefore are isointense to liver parenchyma during the hepatic arterial phase [9]. Whereas some high-grade dysplastic nodules can receive increasing arterial blood supply [113–116], this feature of high-grade dysplastic nodules may overlap with those of HCC nodules during the process of hepatocarcinogenesis. These nodules can reveal the contrast enhancement on hepatic arterial phase, and therefore can be mistaken for HCC [9]. In case of high-grade dysplastic nodules showing an arterial enhancement, the differential diagnosis with an HCC is mainly demanded by the lack of washout on portal venous and late equilibrium phase images [49]. Regarding RES-targeting agents, dysplastic nodules usually accumulate the SPIO particles, therefore appear as hypointense on SPIO-enhanced T2- or T2*-weighted images and as isointense to surrounding liver parenchyma. However, the density of Kupffer cells in high-grade dysplastic nodules may vary, thus explaining the different signal intensities, ranging from slightly hypointense to iso- or even slightly hyperintense [49]. Regarding hepatobiliary contrast agents, it is not yet clear whether this class of contrast agent permits the characterization of dysplastic nodules [26]. A dysplastic nodule with a focal focus of HCC was first described on T2-weighted images as “a nodule within a nodule” appearance [117]. The classic MR appearance is a focus of high signal intensity within a low-signal-intensity nodule on T2-weighted images, and this focus of HCC may also show arterial enhancement [118] (Figs. 4 and 5).
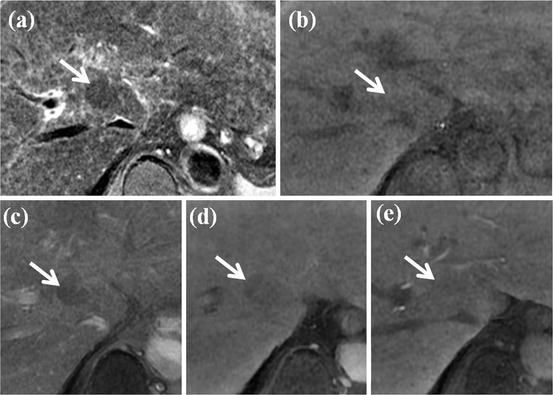
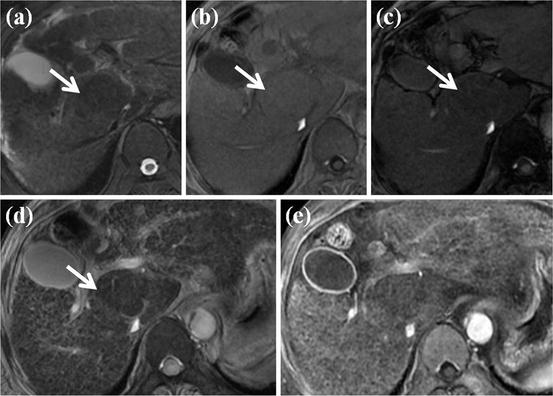
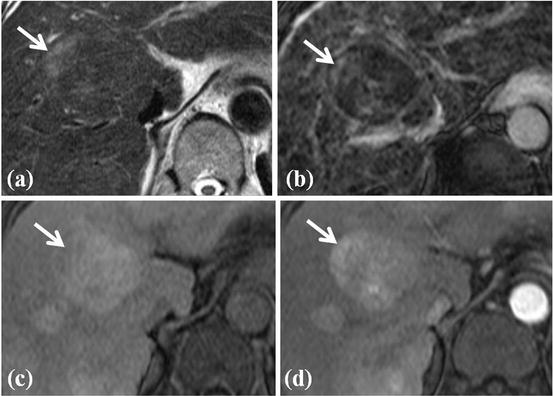
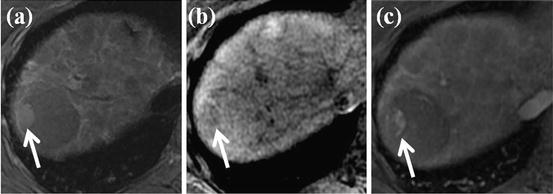
Fig. 2
MR imaging features of dysplastic nodule. (a) T2-weighted FSE axial MR image shows approximately 2 cm-sized low-signal-intensity nodule in segment I of the liver (white arrow). (b) On T1-weighted image, this nodule shows iso- or slightly high signal intensity (white arrow). (c, d, e) On dynamic contrast enhancement, this nodule (white arrow) reveals low signal intensity on arterial (c), portal (d), and equilibrium image (e)
Fig. 3
Large fat-containing dysplastic nodule. (a) T2-weighted FSE axial MR image shows approximately 3 cm-sized low-signal-intensity nodule in segment I of the liver (white arrow). (b) On in-phase T1-weighted image, this nodule shows iso-signal intensity (white arrow). (c) On opposed-phase T1-weighted image, signal drop is seen for this nodule when compared with in-phase image (white arrow), suggesting fat-containing nodule. (d) On SPIO-enhanced T2*-weighted image, this nodule shows accumulation of SPIO particle, resulting in signal drop (white arrow). (e) On arterial phase-contrast-enhanced image, no arterial enhancement is seen on this nodule
Fig. 4
HCC foci within large dysplastic nodule. (a) T2-weighted FSE axial MR image shows approximately 4 cm-sized heterogeneous signal intensity mass in segment IV of the liver. Right upper portion of this nodule shows high signal intensity (white arrow) within the surrounding low-signal-intensity nodule. This feature of nodule is called as nodule-in-nodule appearance. (b) On SPIO-enhanced T2*-weighted image, right upper portion of nodule does not accumulate SPIO particle, resulting in high signal intensity (white arrow). (c) On T1-weighted image, this nodule shows high signal intensity except right upper portion (white arrow). (d) On arterial phase-contrast-enhanced image, arterial enhancement is seen for right upper portion of this nodule (white arrow). On pathologic exam, this right upper portion of nodule is diagnosed with HCC foci
Fig. 5
HCC foci within large dysplastic nodule. (a) T2-weighted FSE axial MR image shows approximately 4 cm-sized low-signal-intensity nodule in segment VII of the liver. However, right lateral portion of this nodule shows high signal intensity (white arrow). (b) On T1-weighted image, this right lateral portion of nodule shows slightly low signal intensity (white arrow). (c) On arterial phase-contrast-enhanced image, arterial enhancement is seen for right lateral portion of this nodule (white arrow). On pathologic exam, this right lateral portion of nodule is diagnosed with HCC foci
Hepatocellular Carcinoma
HCC is defined as a malignant neoplasm composed of cells with hepatocellular differentiation [12]. HCC generally are describes as small (<2 cm in diameter) or large (≥2 cm in diameter). The classic system of macroscopic classification of HCC, in use since 1901, includes three major types: nodular when there are small lesions with distinct margins, massive when there is a single large mass with or without small satellite nodules, and diffuse when there are multiple infiltrative tumors [119]. Large HCCs tend to show evidence of necrosis and often have a mosaic appearance characterized by a seemingly random distribution of confluent small nodules with intervening fibrous septa and areas of necrosis [12, 26]. Tumor capsules, irregular margins, satellite nodules, and vascular invasion are frequently found with such large HCCs [12, 120, 121]. All these features of large HCCs can provide the clue for the MR imaging diagnosis of HCCs. However, regarding small (<2 cm in diameter) and early stage of HCC, these features are almost absent (Figs. 6, 7, 8, and 9). Histologic features of HCC include advanced architectural distortion (widening and irregularity of hepatocyte plates, presence of pseudoglandular structures, absence of portal tracts, and increased density of unpaired arteries), nuclear atypia, necrosis, and microscopic invasion of stroma and portal tracts [26]. Kupffer cells are also eventually absent in HCC; however, well-differentiated HCCs can contain some Kupffer cells. Normal hepatocyte uptake and excretion function are also disappeared in HCCs. However, some well-differentiated HCCs preserve some uptake function of hepatocytes. A tumor capsule composed of an inner fibrous tissue layer and an outer layer of compressed vessels and bile ducts is evident at histologic examination in 65–82 % of larger HCCs [26]. However, regenerative nodules and dysplastic nodules may also have a tumor capsule. Small HCCs tend to be well differentiated, and large HCCs are most often moderately or poorly differentiated [12]. The presence of extracapsular extension or macrovascular invasion, the absence of tumor capsule, and poor histologic differentiation are associated with a higher risk of tumor recurrence after treatment [26].
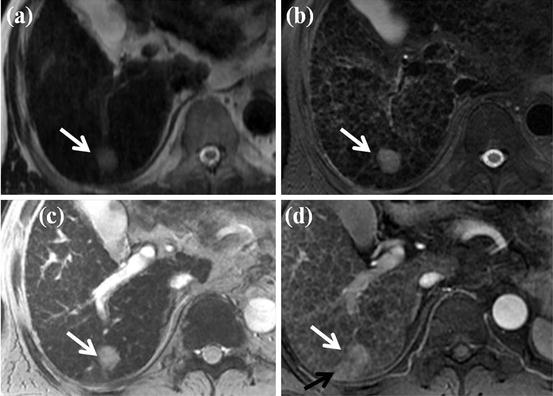
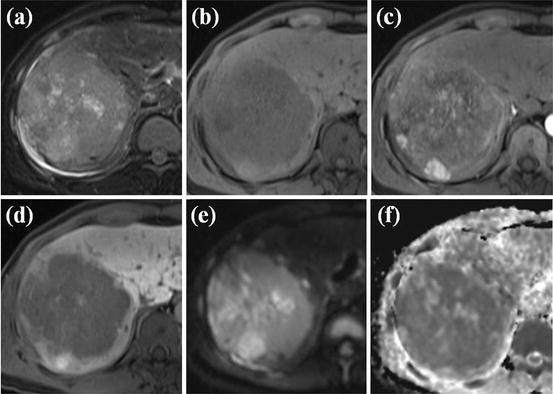
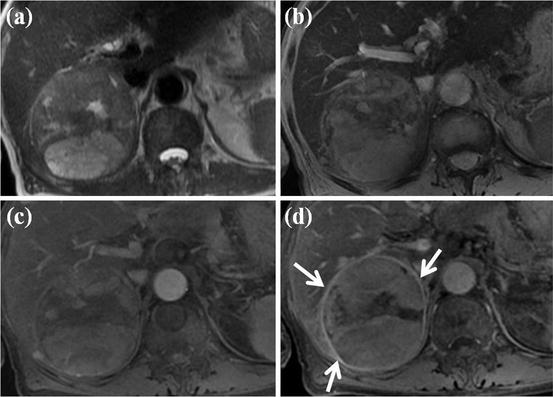
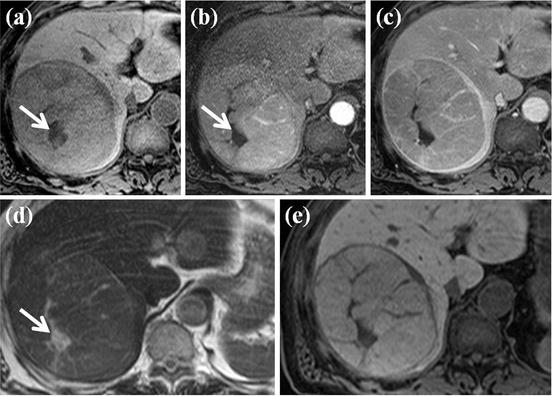
Fig. 6
Typical MR features of small HCC. (a, b) On SSFSE (a) and FSE (b), T2-weighted axial MR images show approximately 2 cm-sized nodule in segment VII of the liver (white arrow). (c) On SPIO-enhanced T2*-weighted image, this nodule shows high signal intensity (white arrow), suggesting no accumulation of SPIO particle. (d) On arterial phase-contrast-enhanced image, this nodule shows arterial enhancement (white arrow). Arterioportal shunt is also seen adjacent to this nodule (black arrow). All these image features are typical for HCC
Fig. 7
MR features of large HCC with diffusion and hepatobiliary phase. (a) FSE T2-weighted axial MR image shows large heterogeneous high-signal-intensity mass lesion at right lobe of the liver. (b) On T1-weighted images, this mass shows low signal intensity. (c) On arterial phase Gd-EOB-DTPA-enhanced image, heterogeneous arterial enhancement is seen within this nodule. (d) On hepatobiliary phase image obtained 20 min after administration of Gd-EOB-DTPA, this mass shows low signal intensity. (e) On diffusion-weighted image, this mass shows high signal intensity. (f) On ADC map, this mass reveals low signal intensity. Considering diffusion-weighted image and ADC map, this mass has diffusion restriction, suggesting high cellularity, one of the typical features of HCC
Fig. 8
Large HCC with mosaic pattern and capsular enhancement. (a) T2-weighted FSE axial MR image shows approximately 5 cm-sized heterogeneous high-signal-intensity mass lesion in right posterior segment of the liver. (b) On SPIO-enhanced T2*-weighted image, this mass shows heterogeneous high signal intensity. (c) On arterial phase-contrast-enhanced image, this mass shows heterogeneous arterial enhancement. (d) On portal phase image, peripheral capsular enhancement is seen (white arrows)
Fig. 9
Large HCC with inner necrosis. (a) On T1-weighted axial MR image shows approximately 7 cm-sized mass lesion in right posterior segment of the liver. More prominent hypointensity is seen at central portion of mass (white arrow). (b) On arterial phase-contrast-enhanced image, contrast enhancement of mass is seen except for the central portion (white arrow). (c) Portal phase image shows peripheral capsular enhancement of this mass. (d) On FSE T2-weighted image, this mass shows moderate-degree high signal intensity. More prominent hyperintensity is also seen at central portion of mass (white arrow). On pathologic exam, this portion is diagnosed as internal necrosis of HCC. (e) On mangafodipir trisodium-enhanced T1-weighted MR image, this mass shows low signal intensity
The signal intensity characteristics of HCCs depend on their size, histologic grade, and biologic features, and therefore are variable on T1- and T2-weighted images [122, 123]. Some HCCs show hypersignal intensity to surrounding liver parenchyma on T1-weighted images, and these T1 hyperintensities are attributed to intratumoral fat, to copper, or to glycogen [122, 124]. Intratumoral fat content leads to loss of signal intensity on opposed-phase GRE images in comparison with in-phase GRE images, thus easily identified with dual echo imaging [125]. Moderate hyperintensity on T2-weighted images is one of key imaging features of HCC, as dysplastic nodules do not show T2 hyperintensity unless they are infracted [89, 112, 122]. However, small HCC can be difficult to detect on T2-weighted images because of heterogeneity of cirrhotic liver, which obscures mildly hyperintense tumors. Breathing-related artifacts, particularly in patients with ascites, can also keep HCC from being detected [126, 127]. Also, some well-differentiated HCCs may appear isointense or even hypointense on T2-weighted images to surrounding liver parenchyma [26]. Large HCCs can exhibit a greater variability of signal intensity, mainly caused by necrosis and hemorrhage. Hemorrhagic HCCs may show marked high signal intensity on T1-weighted images and low signal intensity on T2- and T2*-weighted images. Intratumoral necrosis typically manifests as one or more areas of low signal intensity on T1-weighted images and high signal intensity onT2-weighted images [26].
In nature of blood supply to the cirrhosis-associated hepatocellular nodules, as the progression of multistep carcinogenesis from regenerative nodules to overt HCC, gradual reduction of the normal hepatic arterial and portal venous blood supply to the nodule, and followed by an increase in the abnormal arterial supply via newly formed abnormal arteries (neoangiogenesis) are the key features of change occurring within the nodules, and these features were reported by some investigators with CT during hepatic arteriography (CTHA) and CT during arterial portography (CTAP) [116, 128]. Histologically, this feature corresponds to a diminution in the portal tracts (portal vein and hepatic artery), which are virtually absent in HCC [128]. Moreover, unpaired arteries and sinusoidal capillarization are most common in HCC, less common in dysplastic nodules, and rare in regenerative nodules [9, 104]. Therefore, overt HCCs provide their blood supply wholly from newly formed abnormal arteries. This process of neoangiogenesis of arterial recruitment during the hepatocarcinogenesis reflects the one of key imaging features of HCC, which is arterial enhancement [129, 130]. With moderate hyperintensity on T2-weighted images, arterial enhancement (hypervascularity) is considered as essential characteristic of HCC. Enhancement tends to be heterogeneous in large HCCs and is homogeneous in small HCCs [123, 131]. However, all HCCs are not hypervascular, and approximately 80–90 % of HCCs are hypervascular and show intense enhancement on hepatic arterial phase after an injection of gadolinium contrast agents [26]. About 10–20 % of HCCs are hypovascular and show contrast enhancement slightly less than that in surrounding liver parenchyma on hepatic arterial phase. Typically, hypovascular HCCs are small, well-differentiated tumors [26]. This feature probably reflects the stage of hepatocarcinogenesis within nodule where there has been partial or complete loss of the normal portal tract, with no associated increased neo-arterializations to cause hyperintensity in the hepatic arterial phase [128, 132]. However, poorly differentiated and diffusely infiltrative hypovascular HCC also may occur [133, 134]. In such cases, despite large size and aggressive behavior, HCCs may be difficult to detect on gadolinium-enhanced MR images. In such cases, T2-weighted images or SPIO-enhanced images can help the visualization of these tumors [26]. Since portal venous blood supply to HCC is reduced, HCCs usually become hypointense in the portal venous phase, the so-called washout. These washouts and hypointensity to liver parenchyma of HCCs are more evident on delayed phase images and highly specific for HCCs with a reported overall sensitivity of 89 % and specificity of 96 % for delayed hypointensity [129]. Rarely, some HCCs may remain hyperintense to surrounding liver parenchyma on portal venous and delayed phase images [9]. On portal venous and delayed phase images, HCC can show a delayed enhancing outer rim “capsule,” and these features are also highly specific for HCCs [9, 89, 101]. Ueda et al. reported that all 32 HCCs (mean diameter, 2.5 cm) in their study using single-level dynamic CT hepatic arteriography (CTHA) showed surrounding halo of enhancement or “corona enhancement” in the venous phase [135]. This finding can be explained by portal venous drainage of the HCCs, and the portal venous drainage of HCCs may explain the high incidence of portal vein thrombosis associated with HCC [9]. A tumor capsule can appear as a thin circumferential rim at the periphery of an HCC nodule on MR images and typically thickens with increasing tumor size [136]. On unenhanced T1- and T2-weighted images, the tumor capsule often shows low signal intensity. As tumor capsules are composed of fibrous inner tissue and compressed outer vessels, they enhance progressively after gadolinium contrast administration and retain contrast agent longer, therefore showing hyperintensity to the surrounding liver parenchyma on delayed phase images [136–138]. Therefore, delayed capsular rim enhancement of HCCs can be explained by either portal venous drainage of the HCC or tumor capsule delayed enhancement.
Regarding SPIO particles, moderately and poorly differentiated HCCs characteristically accumulate less or eventually no SPIO particles when comparing with the surrounding liver parenchyma, and therefore show no signal drop in SPIO-enhanced T2- and T2*-weighted images, revealing the relatively high signal intensity to surrounding liver parenchyma. The neoplastic sinusoid capillarization and formation of unpaired arteries lead to progressive loss of Kupffer cells within nodules [139]. However, well-differentiated HCCs can contain Kupffer cells and may accumulate SPIO particles, and therefore tend to be iso- or hypointense on SPIO-enhanced T2- and T2*-weighted images compared with the surrounding liver parenchyma [106–108]. Large HCCs may have nonuniform Kupffer cells density and show heterogeneous uptake of SPIO particles [26]. HCCs are lacking of functioning hepatocytes within the nodules, so they do not accumulate or excrete hepatobiliary contrast agents. Therefore, on hepatobiliary phase images obtained after administration of hepatobiliary contrast agents, HCCs appear as low signal intensity in comparison with the surrounding liver parenchyma [133, 140]. According to recent study, hepatobiliary phase images obtained using Gd-EOB-DTPA can increase the sensitivity for detecting HCCs [85]. Rarely, some small HCCs can show iso- or even hyperintensity on hepatobiliary phase, especially in case of well-differentiated HCCs. These findings can be explained as follows: well-differentiated small HCCs may preserve hepatocellular function to take up the hepatobiliary contrast agent but have impaired excreting function, and therefore the hepatobiliary contrast agents can be retained within these nodules.
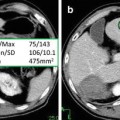
Functional MRI tools such as DWI and elastography can also help the detection and diagnosis of HCC in cirrhotic liver. As other malignant tumor, HCCs have increased cellularity. Increased cellularities within the HCCs prevent water from freely diffusing, and this restricted water molecule diffusion of HCCs can be detected on DWI as hyperintensity lesions. There are compelling data that show better performance of DWI compared with T2-weighted imaging for lesion characterization [23, 54]. DWI can help to increase the detection rate of focal liver lesions and show added value increasing the detection rate for HCC with gadolinium-enhanced MR in cirrhotic liver [25, 54, 56]. In addition, the quantification of restricted diffusion with the ADC maps helps to differentiate malignant lesion from benign lesion [141–143]. Different ADC cutoffs (1.4–1.6 × 10⁻³ mm2/s) have been suggested in the literature, with a reported sensitivity of 74–100 % and specificity of 77–100 % [23, 53]. However, up to now there is no evidence in the literature in how far DWI might be a feasible approach to differentiate among regenerative nodules, dysplastic nodules, and HCCs [23, 25]. Malignant tumors including HCCs are also harder in comparison with surrounding normal tissues and have increased stiffness values. MR elastography (MRE) can detect focal liver lesions with increased stiffness values and measure the tissue stiffness value quantitatively. According to a previous study [57], HCCs have greater stiffness value than benign tumor or surrounding liver parenchyma, and a cutoff value of 5 kPa for differentiation of benign tumors form malignant hepatic tumors is suggested. Use of MRE may lead to new quantitative tissue characterization parameters for differentiating benign and malignant hepatocellular nodules in a cirrhotic liver [23, 57]. Further studies are needed to validate the possible application of MRE in the diagnosis and monitoring of HCCs [23, 57, 144].
Large HCCs show a more variable pattern. A mosaic pattern is created by confluent nodules separated by fibrous septa and area of necrosis [9]. These tumors usually show high signal intensity on T2-weighted images and enhance heterogeneously [145, 146]. Large HCCs do not pose a diagnostic problem.
Diffuse-type HCC constitutes up to 13 % of cases of HCC [147] and appears as an extensive, heterogeneous, permeative hepatic tumor, often associated with an elevated serum AFP level [9]. These tumors have a patchy or nodular early enhancement pattern and can be difficult to detect on unenhanced T1- or T2-weighted images but become hypointense in the late phase of enhancement [147]. Contour deformity of liver surface can also be a clue for the diagnosis of these tumors.
Portal vein invasion is another important characteristic of HCC and is thought to be associated with the portal venous drainage of HCC [135, 148]. However, patients with cirrhosis can also develop benign portal vein thrombosis secondary to portal hypertension and venous stasis [149]. Malignant portal vein thrombosis in HCC occurs by means of direct invasion of vein [149]. The incidence of malignant portal vein thrombosis in association with HCC is reported from 5 to 44 % [150–153], and at autopsy, the reported rate has been increased [154]. A malignant portal vein thrombus is always contiguous with or directly in contact with a parenchymal HCC [9]. Increased signal intensity on T2-weighted images is highly suggestive of malignant thrombosis. Malignant portal vein thrombosis is characterized by dramatic expansion of the vein, compared with near-normal-diameter veins in benign bland thrombosis [155] (Fig. 10). The enhancement of intravascular tumor tissue during the arterial phase and filling defect on later phase images is also highly specific for malignant thrombosis and is due to the presence of neovascularization of tumor [155]. Therefore, assessment of the dynamic gadolinium-enhanced gradient-echo images can help distinguish between bland portal vein thrombosis and malignant ones. A bland thrombus has very low signal intensity due to hemosiderin content, whereas malignant thrombus has the same signal intensity and contrast enhancement pattern as the HCC [9, 156]. However, some rare cases with enhancement of bland benign thrombi have also been reported [155]. Differentiation of these two types of thrombi is critical in clinical practice. The presence of a tumor thrombus also carries a higher risk of hematogenous dissemination of HCC and precludes liver transplantation for treatment options. However, a bland thrombus is a frequent finding in the setting of liver cirrhosis, may occur in the absence of HCC, and depending on its location and extent, may be of minimal importance for decision making with regard to disease management [26].
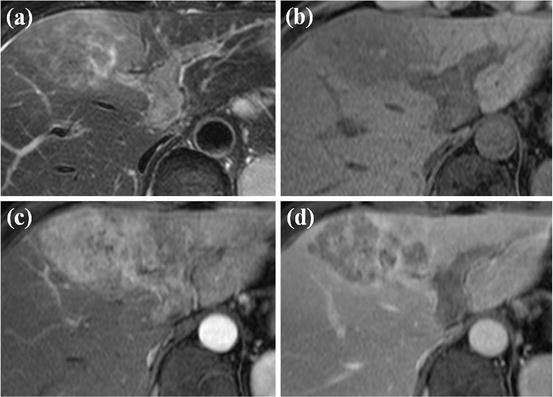
Fig. 10
HCC with left portal vein invasion. (a) T2-weighted FSE axial MR image shows diffuse high signal intensity at left medial segment of the liver. Expansion of left portal vein with inner high signal intensity is also seen. (b) T1-weighted image shows diffuse low signal intensity at left medial segment with expansion of left portal vein with inner low signal intensity. (c) On arterial phase-contrast-enhanced image, diffuse arterial enhancement of left medial segment is seen. Expanded left portal vein also shows arterial enhancement. (d) Portal phase image shows diffuse low signal intensity in left medial segment. The expanded left portal vein also shows low signal intensity, suggesting washout. All these imaging features are typical for HCC with left portal vein invasion
Invasion of HCC into the hepatic veins occurs less frequently than and is often associated with invasion of the portal vein [9] (Fig. 11). In rare cases, HCC may grow into the major bile ducts, resulting in obstructive jaundice, and is frequently associated with concomitant portal vein tumor invasion [154] (Fig. 12).
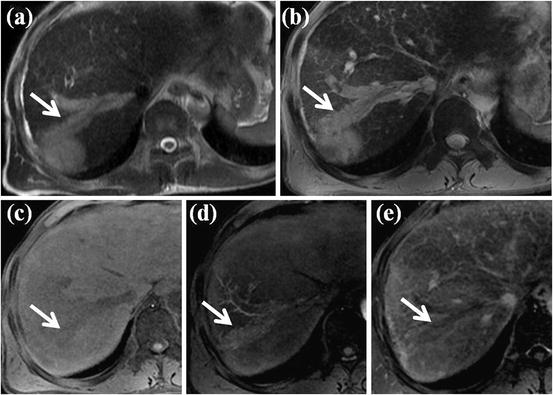
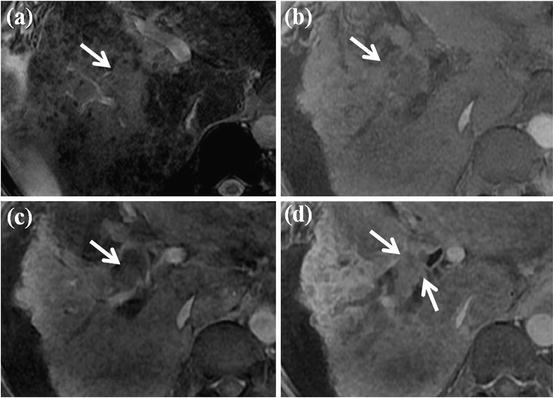
Fig. 11
HCC with right hepatic vein invasion. (a) T2-weighted FSE axial MR image shows approximately 3 cm-sized high-signal-intensity mass lesion in segment VII of the liver. Expansion of adjacent right hepatic vein with inner high signal intensity (white arrow) is also seen. (b) On SPIO-enhanced T2*-weighted image, expansion of right hepatic vein with high signal intensity is also noted (white arrow). (c) On T1-weighted image, expanded right hepatic vein shows low signal intensity (white arrow). (d) On arterial phase-contrast-enhanced image, arterial enhancement of expanded right hepatic vein is seen (white arrow). (e) Portal phase image shows low signal intensity of expanded right hepatic vein, suggesting washout (white arrow). All these imaging features are typical for HCC with right hepatic vein invasion
Fig. 12
HCC with bile duct invasion. (a) On SPIO-enhanced T2*-weighted image, diffuse high signal intensity at right anterior segment of the liver is seen (white arrow). (b) T1-weighted image also shows diffuse subtle low signal intensity at right anterior segment (white arrow). (c, d) On arterial phase (a) and portal phase (b), contrast-enhanced images show expansion of right anterior bile duct with intraluminal enhancing mass (white arrows). This intraluminal enhancing mass is HCC which invades right anterior bile duct
Lesions Mimicking HCC
Among the MR imaging characteristics of HCC, arterial enhancement is considered the most consistent feature of HCC. However, other arterial enhancing nonmalignant lesions can also be seen in the cirrhotic liver, especially those measuring smaller than 2 cm in diameter, which may be regarded as HCC and explains the high incidence of false-positive results for HCC [157–159] (Figs. 13, 14, 15, and 16). Transient arterial enhancement due to non-tumorous arterioportal shunts [160, 161] or focal obstruction of a distal parenchymal portal vein [38] is often seen in the cirrhotic liver. Usually these shunts are isointense to surrounding liver parenchyma on T1- and T2-weighted images and are commonly located in the liver periphery, wedge shaped. However, shunts can be seen as nodular or irregularly outlined shape and may also show minimally hyperintensity on T2-weighted images [38, 160, 162]. In such cases, the differentiation between small HCC and arterioportal shunts is difficult, and shunt can be misinterpreted as small HCC. On dynamic contrast-enhanced MR images, shunts are isointense to the surrounding liver parenchyma on portal venous and delayed phase. Aberrant venous drainage and early drainage by a subcapsular vein have all been described as hypervascular areas which are seen hyperintense on hepatic arterial phase images and mimicking small HCCs [9, 160, 163]. As shunts and vascular changes are not true mass or tumor, functional MR imaging including DWI can also help the differential diagnosis. However, the ability of DWI differentiating HCCs from non-tumorous lesions has not been fully investigated. Further study has to be needed for this issue.
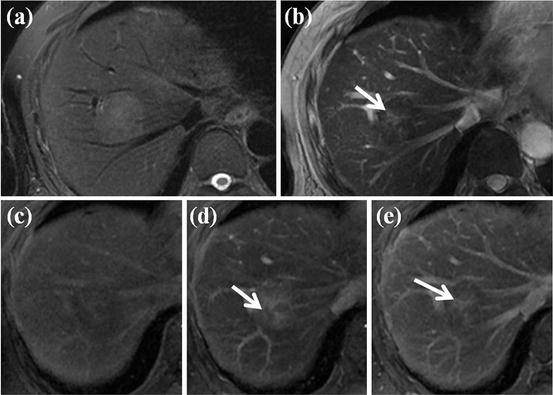
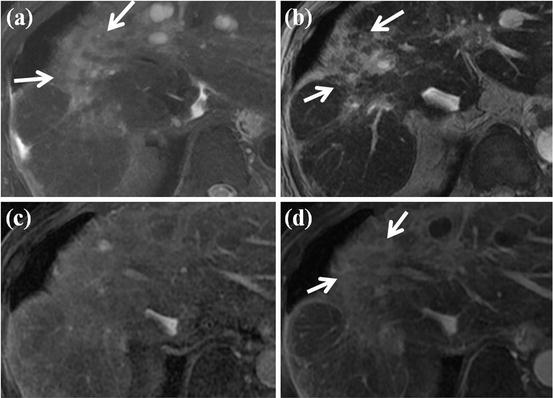
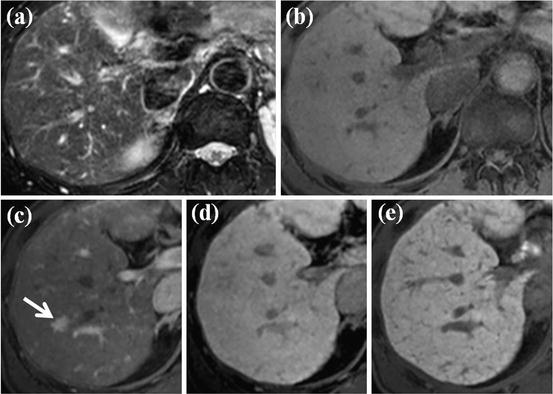
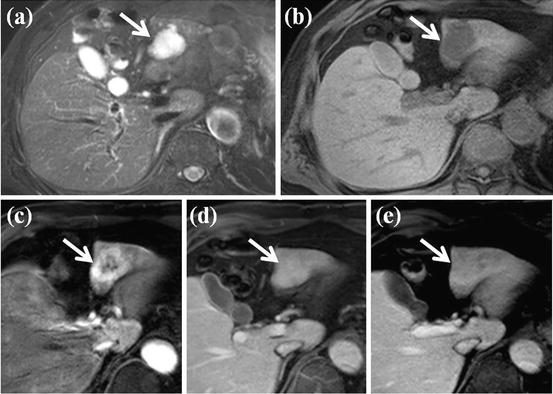
Fig. 13
HCC mimicking lesion: focal nodular hyperplasia (FNH). (a) T2-weighted FSE axial MR image shows approximately 3 cm-sized high-signal-intensity lesion. (b) On SPIO-enhanced T2*-weighted image, this nodule shows low signal intensity suggesting accumulation of SPIO particle. However, central portion of this nodule corresponding to central scar does not accumulate SPIO particle, resulting in high signal intensity (arrow). (c) On precontrast T1-weighted image, this nodule shows subtle low signal intensity. (d) On arterial phase-contrast-enhanced image, arterial enhancement of this nodule is seen. However, central portion of this nodule does not show enhancement on this phase (white arrow). (e) On equilibrium phase, delayed enhancement of central scar is clearly seen (white arrow). These imaging findings are consistent with FNH, which can mimic HCC considering T2 high signal intensity and arterial enhancement
Fig. 14
HCC mimicking lesion: confluent hepatic fibrosis. (a) T2-weighted FSE axial MR image shows diffuse high signal intensity at right anterior segment of the liver (white arrows). Volume loss of affected segment and capsular retraction are also seen. (b) On SPIO-enhanced T2*-weighted image, diffuse wedge-shaped high signal intensity at right anterior segment is seen (white arrows), suggesting no accumulation of SPIO particle in this area. (c) On arterial phase-contrast-enhanced image, arterial enhancement of this area is not evident. (d) On equilibrium phase, diffuse delayed enhancement at right anterior segment is clearly seen (white arrow). These features are consistent with confluent hepatic fibrosis, which can mimic HCC considering T2 high signal intensity and no accumulation of SPIO particles
Fig. 15
HCC mimicking lesion: nodular arterioportal (AP) shunt. (a, b) There is no focal lesion in the liver on FSE T2-weighted (a) and T1-weighted (b) axial MR images. (c) However, on EOB-DTPA-enhanced arterial phase image, nodular-enhancing lesion is clearly seen (arrow). (d) On equilibrium phase, however, this nodule is not visualized. (e) On hepatobiliary phase image, there is no focal lesion in the liver. This is the case of nodular AP shunt which can mimic HCC considering nodular arterial enhancement
Fig. 16
HCC mimicking lesion: hemangioma. (a) FSE T2-weighted axial MR image shows approximately 3 cm-sized high-signal-intensity lesion at segment III of the liver (white arrow). (b) On T1-weighted image, this lesion shows low signal intensity (white arrow). (c) On arterial phase-contrast-enhanced image, arterial enhancement is seen on the peripheral portion of this lesion. (d) On portal venous phase, complete fill-in-type enhancement of this lesion is also seen (white arrow). (e) On equilibrium phase, this lesion shows subtle persistent enhancement (white arrow). This is the typical MR features of hemangioma which can mimic HCC considering T2 high-signal-intensity arterial contrast enhancement
Fibrosis is frequently found in cirrhotic liver and usually in a lattice-like network throughout the liver. Focal confluent hepatic fibrosis, observed in end-stage liver disease, can have mass-like appearance, and therefore may be mistaken for HCC [164]. Areas of confluent fibrosis can be diffuse but more often focal, wedge shaped with the wide base toward the liver capsule, and usually located in the anterior and medial segment of the liver, either involving the entire segment or a portion of it [164]. Confluent fibrosis is usually associated with atrophy of the affected segment, and capsular retraction over the area is common [93]. Confluent fibrosis is usually of low signal intensity to the surrounding liver parenchyma in T1-weighted images and hyperintense on T2-weighted images. Confluent fibrosis do not contain Kupffer cells, therefore hyperintense on SPIO-enhanced T2- and T2*-weighted images. These hyperintensity on T2-weighted images and SPIO-enhanced images may lead to misclassification of focal confluent hepatic fibrosis as HCCs. On dynamic MR images after gadolinium contrast administration, delayed enhancement of fibrosis is characteristic [9]. However, occasionally confluent fibrosis shows contrast enhancement during the hepatic arterial phase, mimicking small HCCs and requiring biopsy for exact diagnosis [164, 165]. The characteristic shape, location, volume loss, and enhancement pattern can help differentiate focal confluent fibrosis from an HCC [166].
Other arterial enhancing hepatic tumor such as hemangioma, focal nodular hyperplasia (FNH), hepatic adenoma, and hypervascular metastasis can also mimic an HCC [167–169]. Hemangiomas, commonly found in normal livers, are rare in end-stage cirrhosis, probably because the process of cirrhosis can obliterate existing hemangiomas [9]. Therefore, hemangiomas are often atypical in appearance in cirrhotic livers and contain large regions of fibrosis [164]. Especially, with the concomitant use of gadolinium chelates and SPIO particles using dual-contrast protocol, enhancement pattern of hemangioma after gadolinium administration can be impaired due to the previously injected SPIO particle and may lead to misclassification of hemangioma as HCCs [75]. Some FNH and hepatic adenoma have Kupffer cell, therefore can accumulate SPIO particle, and show low signal intensity on SPIO-enhanced T2- and T2*-weighted images. These characteristic can help differentiate these nodules from HCCs [170].
It is important to distinguish HCC from benign large regenerative nodules, which occurs secondary to liver damage without cirrhosis, for example, in case of Budd-Chiari syndrome or severe disease of the portal veins or hepatic sinusoid. These nodules often appear as multiple well-defined arterially enhancing nodules with high signal intensity on T2-weighted images and sometimes delayed hypointensity [171, 172]. They sometimes contain a central scar [173]. Information about patient’s history can be helpful [9].
Mass-forming intrahepatic cholangiocarcinoma is also occasionally misinterpreted as an HCC. Mass-forming intrahepatic cholangiocarcinoma usually shows thin or thick rim enhancement in the arterial and venous phases, with progressive and concentric filling of contrast agent in the later phases [174]. This pattern of contrast enhancement is atypical for HCC. However, in case of small mass-forming intrahepatic cholangiocarcinoma, arterial enhancement can be seen. Intrahepatic biliary duct dilation distal to the tumor and associated capsular retraction are features more commonly associated with mass-forming intrahepatic cholangiocarcinoma and are rarely seen in association with HCC [174, 175].
Difficulty in Diagnosis of Small (≤2 cm) Arterial Enhancing Lesion
Key MR features for the diagnosis of HCC are as follows: (1) contrast enhancement during the hepatic arterial phase and washout during the later portal venous and equilibrium phase, (2) capsular rim enhancement on portal venous and delayed phase images, (3) moderately hyperintensity on T2-weighted images, (4) hyperintensity on SPIO-enhanced T2- and T2*-weighted images, (5) hypointensity on hepatobiliary phase after administration of hepatobiliary contrast agent, (6) and restricted diffusion on DWI. Large HCCs (>2 cm) usually show all of these features and do not pose a diagnostic problem. However, small HCCs (≤2 cm) tend not to have these entire features but have some of them. Therefore, small nodules are often difficult to characterize as benign or malignant. In addition, small arterially enhancing nodules are not uncommon in the cirrhotic liver, and the majority of these nodules are benign [101, 132, 157, 158, 176–178]. However, detection and characterization of small HCCs is important because curative treatment options such as transplantation or percutaneous ablation are optimally beneficial when the tumor is small [179, 180]. In patients with cirrhosis and small HCC, the 5-year survival rate after transplantation is 80 % compared with less than 5 % in those with untreated symptomatic HCC [6, 178, 181]. If small HCCs are left alone, these HCCs can grow aggressively. Invasion of tumor can also occur before tumors reach the 2 cm cutoff size for small HCC [129]. Therefore, every attempt should be made to characterize these small nodules [9]. If exact characterization of these nodules is not possible with MR images, follow-up imaging or biopsy should be considered to verify their nature. The management of small enhancing nodules (≤2 cm) is mainly dependent on their imaging features [9]. If the imaging features are highly suggestive of malignancy (i.e., hypointensity on delayed image, capsular rim enhancement on portal venous and delayed phase images, moderate hyperintensity on T2-weighted images, restricted diffusion, absence of uptake of SPIO particles and hepatobiliary contrast agent), the diagnosis of HCC should be made at either imaging or biopsy, because resection or ablation therapy is more effective and beneficial than surveillance. However, more often than not, the imaging features of these nodules are nonspecific, and biopsy or follow-up imaging becomes necessary to confirm their nature [9]. The optimal follow-up interval is yet to be established and is influenced by the tumor volume doubling time. Reported doubling time for HCC ranges from 18 to 605 days, and smaller HCCs tend to grow rapidly and to have a shorter doubling time [182–188]. Therefore, a follow-up interval of 3–6 months has been suggested and used in many institute nowadays.
References
1.
Related posts:
 Approach to Detection and Characterization of Hepatic Hemangiomas
 Resonance Imaging of Adenocarcinoma of the Pancreas
 Imaging Characteristics of Hepatocellular Carcinoma
 Cortex Segmentation on Computed Tomography
 Liver Segmentation Without Prior Statistical Models
 Surface Registration Using Ricci Flow
Stay updated, free articles. Join our Telegram channel

Full access? Get Clinical Tree


