Fig. 5.1
Post-traumatic OA of the knee in a 42-year-old former professional soccer player. (a) Anteroposterior view of the right knee. Remote anterior cruciate ligament disruption has been surgically repaired as evidenced by the screws in the metaphyseal femur and tibia (black arrowheads). Large osteophytes are observed at the medial tibiofemoral joint line (white arrowheads). In addition, joint space narrowing of the medial tibiofemoral compartment with bone-to-bone contact is depicted (no arrows). Note the loose body projecting into the lateral tibiofemoral joint space (arrow). (b) Anteroposterior view of the left knee. No joint space narrowing and no relevant osteophytes are seen in the unaffected knee
Fig. 5.2
Post-traumatic OA following complete ACL disruption. Conservative treatment. (a) Baseline image directly after trauma shows a normal medial and lateral tibiofemoral joint space. No osteophytes are visible. (b) Two years later, there is an incident definite osteophyte at the medial tibial margin (arrow). Radiographic osteoarthritis 2 years after trauma is diagnosed. (c) At 5 years, the osteophyte again is clearly depicted but has not changed in size (arrowhead). Note increasing sclerosis in the medial tibial plateau subchondrally (asterisk)
The standing anteroposterior (AP) protocol of the knee in extension in the weight-bearing position used to be the most commonly used technique. In the current routine clinical assessment of patients with suspected OA, standing AP and lateral radiographs are sufficient in most cases. However, this protocol is not recommended for monitoring disease progression. In particular, there is no attempt to standardize the degree of knee rotation, flexion, or X-ray beam alignment. Consequently, images are not reliably reproducible in longitudinal follow-up examinations (Buckland-Wright et al. 2004). To circumvent this problem, several radiographic protocols for flexed knees have been developed, either with fluoroscopy, the semi-flexed protocol (Adams et al. 1999) and the Lyon-Schuss protocol (Piperno et al. 1998), or without fluoroscopy, the metatarsophalangeal protocol (Buckland-Wright et al. 1999), the fixed-flexion protocol (Hunter et al. 2006), and the modified Lyon-Schuss protocol (Mazzuca et al. 2008). The use of fluoroscopy is limited by the availability of the equipment and increased radiation exposure. Radiographic protocols of the knee in flexion that enable the alignment of the medial tibial plateau have been shown to be more sensitive for imaging the tibiofemoral compartment for both clinical practice and research purposes (Mazzuca et al. 2004).
The radiographic definition of OA relies mainly on the evaluation of both osteophytes and JSN. Because osteophytes are considered specific to OA, develop at an earlier stage than JSN, are more correlated with knee pain, and are easier to delineate than other radiographic features, their presence is the most widely applied criterion to define OA (Altman et al. 1986). Progression of JSN is the most commonly used criterion for the assessment of OA progression, and the complete loss of JSW characterized by bone-on-bone contact is one of the indicators for joint replacement.
The severity of OA can be estimated using semiquantitative scoring systems. Published atlases provide images that represent specific grades (Altman and Gold 2007). Several grading schemes have been developed including the widely applied Kellgren-Lawrence (KL) classification (Kellgren and Lawrence 1957) (Fig. 5.3). The KL grading system, however, has limitations in that it is based on the invalid assumptions that changes in radiographic features (e.g., osteophytes, JSN) are linear over the course of the disease and that the relationship between these features is constant. In contrast, the Osteoarthritis Research Society International (OARSI) atlas classification grades the tibiofemoral JSN and osteophytes separately in each compartment of the knee. Compartmental scoring appears to be more sensitive to longitudinal radiographic changes than KL assessment. A recent study using the data from the Osteoarthritis Initiative highlighted the importance of centralized radiographic assessment in multicenter OA trials in regard to observer reliability, as there are different thresholds for scoring of JSN even between expert readers (Guermazi et al. 2011b).
Fig. 5.3
Grading of knee radiographs with the Kellgren-Lawrence scale. (a) There is a small bony spur described as “lipping” at the lateral tibial margin (arrow). This lesion is not large enough to qualify as a definite osteophyte and thus is termed a “doubtful” osteophyte, making this knee Kellgren-Lawrence grade 1. No other abnormalities are shown. (b) There are small marginal osteophytes at the right medial tibia, as well as medium-sized osteophytes at the lateral femur and tibia (arrows). There is no joint space narrowing. This is an example of Kellgren-Lawrence grade 2 and is classified as radiographic osteoarthritis. (c) There are osteophytes at the left medial and lateral margins of the femur and tibia (white arrows). Also noted are the medial joint space narrowing (black arrowheads) and medial tibial subchondral sclerosis (white arrowheads). This is Kellgren-Lawrence grade 3. (d) There are osteophytes at the left medial tibia and femur and lateral tibia (white arrows). The medial joint space is completely lost and shows “bone-to-bone.” Also noted in the medial compartment are lucencies suggestive of subchondral cysts (gray arrowheads) and opacities representing subchondral sclerosis (no arrows). This is Kellgren-Lawrence grade 4
Among the various radiographic features of OA, JSW is considered a surrogate marker for articular cartilage thickness. JSW measurement can be either manual using calipers or a simple graduated ruler and a micrometric eyepiece, or semiautomated using computer software (Duryea et al. 2003). The smallest standard deviation of the difference between test-retest measurements of minimum JSW in pairs of radiographs reaches about 0.10 mm in the most reproducible methods (Gale et al. 1999) indicating that the smallest detectable difference is at least 0.20 mm, which is still relatively large considering the 0.10–0.15 mm expected average annual JSN of OA knee joints.
Previously held beliefs that ascertainment of JSN and its changes are a reflection only of damage to articular cartilage, however, were shown to be incorrect after a recent study demonstrated that alterations in the meniscus, such as meniscal extrusion or subluxation, also contribute to JSN (Hunter et al. 2006). This study used both MRI and weight-bearing posteroanterior radiographs to explore the relative contribution of cartilage and meniscal integrity and position to radiographic JSN. Features of the meniscus (position and degeneration) accounted for a substantial proportion of the explained variance in JSN, and change in meniscal position accounted for a substantial proportion of change in JSN.
Another study by the same group of investigators used a quantitative approach to compare cartilage (measured with a 3D morphometric approach) and meniscal position as seen on MRI, to JSW as measured in LS radiographs of the knee (Hunter et al. 2009). Sixty-five percent of the variation in medial JSW was explained by regional cartilage thickness measures, different KL grades, and meniscal coverage. Of these measures, the medial tibia cartilage thickness measures and central region of the central medial femur (ccMF) played a consistent role in variations in medial JSW observed across all KL grades. Furthermore, ccMF and the addition of percent meniscal coverage to this model explained the remaining differences in mean medial JSW between those subjects with definite JSN (KL grade 3) and those without OA.
The structural changes in OA are markedly collinear, i.e., as hyaline articular cartilage becomes morphologically more abnormal, the other structural processes parallel these changes, with increasing degenerative findings in the meniscus and increasing meniscal displacement (Hunter et al. 2009). The causal process is therefore complex, and although JSN genuinely reflects changes in all of these structures, in some knees, cartilage loss is less important as a cause of JSN than meniscal variables. One should also note that the lateral joint space may become widened as a result of severe medial JSN. In such secondary widening of joint space, articular cartilage in the lateral compartment may still be normal.
5.2.2 Summary
In summary, conventional radiography is presently the only accepted imaging outcome to define progression of OA in clinical trials. Recent systematic reviews found that measurement of JSW obtained from radiographs was reliable, especially when the study lasted more than 2 years and when radiographs were obtained with the knee in a standardized flexed position (Reichmann et al. 2011). Thus, the Osteoarthritis Research Society International (OARSI) working group concluded that radiographic JSW is still the recommended option for trials of structure modification (Conaghan et al. 2011). However, both clinicians and researchers need to be aware of the most important drawback of radiography, which is its inability to directly visualize most OA features (Fig. 5.4). Also, one should understand that the concept of JSW represents a number of pathologies including cartilage and meniscal damage. For these reasons, other imaging modalities, especially MRI, are becoming increasingly more important (Guermazi et al. 2011a).
Fig. 5.4
Inability of radiography to visualize most of the OA-associated pathologic features that are detectable by MRI. (a) Anteroposterior radiograph of the right knee shows the presence of osteophytes at the femoral and tibial margins (arrows). There is no obvious joint space narrowing in the lateral compartment, while the medial compartment shows mild joint space narrowing. (b) Coronal proton density-weighted MRI with fat suppression demonstrates several pathologic features that were not detected by radiography. There is a full-thickness focal cartilage defect in the lateral femur (gray arrowhead) and diffuse full-thickness cartilage loss in the lateral tibia (gray arrows). Also, there are multiple sites of partial-thickness cartilage loss of the medial femoral condyle (white arrowheads) and a full-thickness focal cartilage loss at the medial tibial plateau, underneath which is a subchondral bone marrow lesion (white arrow). Comparing a and b, it is evident that the medial joint space narrowing seen in a is mainly due to a partially macerated and extruded medial meniscus (thick white arrow). MRI also demonstrates attrition of the medial and lateral tibial plateaus and osteophytes at the margins of femur and tibia
5.3 Magnetic Resonance Imaging
MRI is seldom used in routine clinical assessment or initial diagnosis of OA despite its ability to detect early OA changes. In comparison to radiography, MRI has a number of advantages for imaging of OA. First, MRI has a tomographic viewing perspective and thus provides cross-sectional images of the anatomy free of the projectional limitations of radiography. Second, MRI is uniquely able to directly depict all components of the joint and their pathology. For the knee joint, these include the articular cartilage (Roemer et al. 2009d; Crema et al. 2011c), menisci (Englund et al. 2008; Crema et al. 2011b), intra-articular ligaments (Huetink et al. 2010), synovium (Baker et al. 2010; Fotinos-Hoyer et al. 2010; Guermazi et al. 2011c; Hayashi et al. 2011a), effusion (Roemer et al. 2010b; Habib et al. 2011), bone attrition (Neogi et al. 2010), bone marrow lesions (Roemer et al. 2009a, 2010a; Hayashi et al. 2011b), subchondral cysts (Crema et al. 2010a, b), and intra- and periarticular cystic lesions (Guermazi et al. 2010; Hayashi et al. 2010b) (Figs. 5.5, 5.6, 5.7, 5.8, 5.9, 5.10, 5.11, 5.12, 5.13, 5.14, and 5.15). This ability allows the joint to be evaluated as a whole organ and provides a much more detailed picture of the changes associated with OA than is possible with other techniques. Third, MRI detects pathology of pre-radiographic OA and possible complications of the disease at a much earlier stage than is possible with radiography (Javaid et al. 2010).

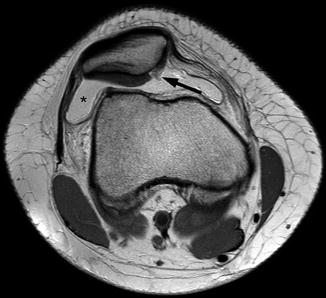
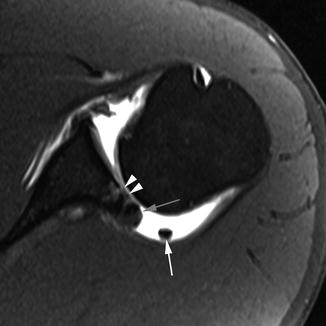
Fig. 5.5
Delineation of synovitis associated with OA using contrast-enhanced MRI. (a) Sagittal fat-suppressed proton density-weighted image shows no joint effusion or signal changes suggestive of synovitis within the infrapatellar fat pad. There is an ill-defined area of hyperintensity in the femoral trochlear, consistent with a bone marrow lesion (arrow). (b) Sagittal contrast-enhanced fat-suppressed T1-weighted MRI reveals the strong enhancement of suprapatellar synovium, consistent with synovitis. This was overlooked on non-enhanced MRI. The bone marrow lesion depicted in a is clearly seen here and shows enhancement (arrowhead)
Fig. 5.6
Ability of MRI to detect early damage and complications of osteoarthritis. (a) Axial proton density-weighted fat-suppressed image shows very early cartilage damage in the medial patellar facet, depicted as intrachondral hyperintensity (arrows). (b) Coronal intermediate-weighted image shows osteonecrosis and consequent fracture (arrows) of the lateral femoral condyle. Note also moderate-sized osteophytes (large arrowheads) and complete cartilage denudation in the lateral tibial plateau (small arrowheads)
Fig. 5.7
Incident meniscal tear found during a long-term follow-up. (a) Sagittal intermediate-weighted MRI of the medial tibiofemoral compartment at baseline shows no meniscal damage. The anterior and posterior horns of the medial meniscus are visualized as hypointense triangular structures. (b) At 24 months, an incident horizontal tear reaching the undersurface of the posterior horn is observed (arrows). Note also a susceptibility artifact in the metaphyseal tibia at the bottom part of images, due to a tibial screw after ACL reconstruction, a known risk factor for tibiofemoral osteoarthritis (no arrows)
Fig. 5.8
Meniscal root tear, extrusion and diffuse cartilage loss. (a) Coronal proton density-weighted image shows a tear of the meniscal root (arrow) in the posterior aspect of the knee. (b) Another coronal proton density-weighted image shows meniscal extrusion (black arrow) and diffuse femoral cartilage loss (white arrowheads) at the weight-bearing part of the tibiofemoral joint
Fig. 5.9
Incident meniscal extrusion. (a) Coronal DESS MRI at 3 T shows normal alignment of the medial meniscus with the tibial plateau (vertical line). (b) Corresponding sagittal intermediate-weighted fat-suppressed MRI shows normal articular cartilage and subchondral bone. Note intrameniscal high signal at posterior horn of medial meniscus consistent with intrameniscal mucoid degeneration (no arrow). (c) Follow-up image at 24 months shows incident meniscal extrusion with the meniscal body now protruding 4 mm beyond the margin of the tibial plateau (white line and arrowheads). (d) Corresponding intermediate-weighted fat-suppressed image shows incident tibial BML in the same compartment (arrow). Also note the presence of joint effusion in the suprapatellar bursa (*)
Fig. 5.10
Incident meniscal root tear. (a) Baseline coronal DESS image shows normal posterior horn of the medial meniscus in the correct anatomical position. (b) At 24 months, there is an incident meniscal tear of the posterior root of the medial meniscus (arrow). Note consequent meniscal extrusion medially (arrowheads)
Fig. 5.11
Focal cartilage loss and joint effusion. Axial proton density-weighted image clearly depicts a focal cartilage loss (black arrow) in the medial facet of the patella and joint effusion (*)
Fig. 5.12
Rare case of spontaneous regression of a focal full-thickness cartilage defect. (a) Baseline intermediate-weighted 3 T MRI shows a focal full-thickness defect at the central, weight-bearing part of the lateral femoral condyle (arrow). (b) At 24 months, the defect is much smaller and definitely only partial-thickness (arrowhead). It has spontaneously filled with cartilage repair tissue. (c) At 48 months, a morphologically normal articular surface is depicted (no arrows). The cartilage ultrastructure is likely to differ from surrounding non-repaired tissue although visually identical (no images)
Fig. 5.13
Fluctuation of bone marrow lesions.(a) Sagittal baseline intermediate-weighted fat-suppressed image shows a large bone marrow lesion in the central weight-bearing portion of the medial femoral condyle (arrows). Note the adjacent small full-thickness cartilage defect (arrowhead). (b) At 12 months, marked regression of BML is observed (arrows). (c) At 36 months, there is an increase in femoral BML (arrows) and marked adjacent cartilage loss (arrowheads)
Fig. 5.14
Shoulder OA after posterior dislocation 5 years prior and an untreated inverse Bankart lesion at the posterior labrum. Axial T1-weighted fat-suppressed MR-arthrography image shows diffuse cartilage damage at the posterior inferior glenoid (arrowheads) and a calcified posterior labrum that exhibits osteophytic changes (gray arrow). In addition, a loose body is depicted in the posterior axillary pouch (white arrow). Note also posterior subluxation of the humeral head due to the missing posterior labrum and capsular laxity
Fig. 5.15
MRI of femoroacetabular impingement. (a) Coronal proton density-weighted MR-arthrography image shows several OA features: a subchondral cyst (small arrow), diffuse cartilage thinning (arrowheads), and labral hypertrophy and an intralabral cystic lesion (large arrow). (b) Paraaxial T1-weighted image along the course of the femoral neck shows an osseous bump at the femoral head-neck junction leading to clinical and structural manifestations of femoroacetabular impingement (arrow)
The following paragraphs will focus on recent advances in MR technology and on semiquantitative whole-organ assessment of OA. Subsequently, we will describe techniques for assessing the biochemical composition of cartilage, such as T2 relaxation, T1rho, sodium MRI, and proton-based delayed gadolinium-enhanced MRI of cartilage (dGEMRIC). Finally, we will briefly describe quantitative cartilage morphometry.
5.3.1 Methodological Aspects
Several MR systems are commercially available for use in the assessment of OA in a clinical and research setting. Most widely applied are 1.5 T large-bore MR systems. The knee is usually imaged using a dedicated knee coil. The patient is supine as static images are acquired. Examination times vary depending on the purpose of the exam but usually last between 20 and 40 min including patient positioning. Novel coil technology such as commercially available 8-channel multi-array coils improves image quality for 1.5 T systems.
High-field MRI of 3 T was introduced for clinical application several years ago and experience has shown that these systems can be applied to knee OA in a clinical and research environment (Fig. 5.16). A higher signal-to-noise ratio is its definitive advantage, but disadvantages include increased artifacts, high costs, and limited commercial availability of coils at present. Due to their wide availability and reliable image quality, most OA studies that include MRI are using 1.5 MR systems. The OAI is one of the few large studies using a 3 T system.
Fig. 5.16
Differences in how cartilage damage and bone marrow lesions appear when different MR pulse sequences are used. (a) Sagittal dual echo steady state (DESS) sequence shows discrete retropatellar cartilage damage (white arrow) and a small subchondral cyst (arrowhead). (b) Corresponding sagittal intermediate-weighted fat-suppressed image shows true extent of cartilage lesion due to arthrographic effect of joint fluid (black arrow) and also depicts a large ill-defined subchondral bone marrow lesion (arrowheads) in addition to the small cystic lesion depicted in a. These images were taken using a 3 T MRI system
The role of contrast-enhanced MRI (CE-MRI) in clinical and research settings remains to be fully established. Visualization of synovitis in OA is superior on contrast-enhanced scans using the intravenous paramagnetic agent gadolinium (Grainger et al. 2007) and recent studies have shown that CE-MRI-detected synovitis is associated with knee pain (Guermazi et al. 2011c).
5.3.2 Choice of Pulse Sequences for OA Imaging
Since different tissues are involved in OA and both morphologic and quantitative analyses are needed, a variety of different sequences have been developed for “whole-organ” assessment of OA. It is critically important to select the appropriate MR pulse sequences to study specific features in OA. In general, fluid-sensitive fat-suppressed sequences (e.g., T2-weighted, proton density-weighted, or intermediate-weighted spin-echo sequences) are useful to evaluate cartilage, bone marrow, ligaments, menisci, and tendons (Link 2009). It is of particular importance to use these sequences for the assessment of focal cartilage defects (Hayashi et al. 2010a) and bone marrow lesions (BMLs) (Crema et al. 2011a). Gradient-recalled echo (GRE)-type sequences (e.g., 3D spoiled gradient echo at steady state (SPGR), double echo steady state (DESS), and fast low-angle shot (FLASH)) are not suitable for marrow or focal-defect assessment as they are prone to susceptibility artifacts, which hinder the accurate interpretation of images (Peterfy et al. 2006). Also, GRE-type sequences usually require a fairly long imaging time, and motion artifacts can degrade image quality (Link 2009). A recent study demonstrated that focal cartilage lesions were larger and more conspicuous on the intermediate-weighted fast spin-echo sequence with fat suppression compared to the DESS sequence (Roemer et al. 2011a) (Fig. 5.16). It was also shown that GRE-type sequences demonstrate limited sensitivity to BMLs compared to fast spin-echo sequences (Hayashi et al. 2011b) (Fig. 5.16). For the assessment of synovitis, CE-MRI is preferable to non-CE-MRI, but if only non-CE-MRI is available, gradient echo-type sequences again should be avoided because they are prone to chemical shift artifacts, making accurate assessment of synovium difficult (Roemer et al. 2009b).
In contrast, GRE-type sequences provide high spatial resolution, excellent contrast of cartilage to subchondral bone and are well suited for quantitative measurement of volume and thickness (Eckstein et al. 2005, 2008; Link 2009). Clinicians embarking upon clinical OA research with MRI as an outcome parameter should consult experienced musculoskeletal radiologists for guidance on which pulse sequences are best suited to their study.
5.3.3 Semiquantitative MRIWhole-Organ Scoring
Semiquantitative whole-organ scoring has been applied to a multitude of OA studies (Figs. 5.17 and 5.18). Analyses based on semiquantitative scoring have added greatly to the understanding of the pathophysiology and natural history of OA as well as the clinical implications of structural changes. Examples are the associations of subchondral BMLs with cartilage loss in the same subregion cross-sectionally and longitudinally (Felson et al. 2007).
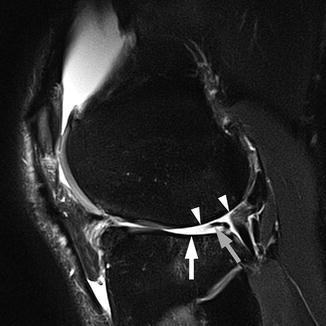
Fig. 5.17
Multi-feature assessment in semiquantitative whole-organ scoring using intermediate-weighted fat-suppressed sequences. Sagittal intermediate-weighted fat-suppressed image of lateral tibiofemoral compartment in a 50-year-old man shows diffuse cartilage denudation of the lateral femoral condyle (arrowheads) and the tibial plateau (arrow). Increased concavity of the tibia is scored as WORMS grade 3 for the bone attrition of the central and posterior parts of the lateral tibial plateau. In addition, the posterior horn of the lateral meniscus is macerated (gray arrow)
Fig. 5.18
Definite progression of medial tibiofemoral OA depicted by MRI and assessed semiquantitatively. (a) Coronal intermediate-weighted MRI at baseline depicts moderate-sized osteophytes at the lateral tibiofemoral joint line and the medial femoral notch (arrows). (b) At 24 months, there is marked progression of medial tibial and femoral cartilage loss (arrows) and progressive meniscal extrusion of the body of the medial meniscus (arrowheads)
To date three semiquantitative scoring systems based on non-CE-MRI for the assessment of knee OA have been published and have been applied in epidemiological studies: the Whole-Organ Magnetic Resonance Imaging Score (WORMS) (Peterfy et al. 2004), the Knee Osteoarthritis Scoring System (KOSS) (Kornaat et al. 2005), and the Boston-Leeds Osteoarthritis Knee Score (BLOKS) (Hunter et al. 2008).
Inter- and intra-reader reliability results have been published for all three systems. However, one should be aware that these numbers are highly dependent on the specific MRI protocol used and on the experience of the individual readers. When estimating the time needed to apply any of these semiquantitative systems, the imaging protocol and the quality of images as well as the degree of joint abnormalities due to OA have to be taken into account. Lastly, reader experience and manual or electronic documentation of the scoring are very important. Useful MRI protocols for whole-organ assessment of knee OA have been published (Peterfy et al. 2006).
Recent studies compared the performance of the WORMS and BLOKS scoring systems (Felson et al. 2010; Lynch et al. 2010) both cross-sectionally and longitudinally, using a subcohort from the OAI. In this comparative study, neither system showed definite superiority over the other. Based on the strengths of both systems and to alleviate their weaknesses, a novel scoring system called the Magnetic Resonance Imaging Osteoarthritis Knee Score (MOAKS), was developed (Hunter et al. 2011). Notable changes include that “synovitis” and “effusion” were renamed “Hoffa synovitis” and “effusion synovitis,” as current data suggests that effusion assessment on water-sensitive sequences always reflects a combination of both synovial thickening and joint fluid (Roemer et al. 2009c, 2010b, 2011c).
Semiquantitative MRI scoring systems are also available for OA of the hip (Hip Osteoarthritis MRI Scoring System, HOAMS) (Roemer et al. 2011b) and the hand (Oslo Hand Osteoarthritis MRI score, OHOA-MRI) (Haugen et al. 2011). Although the use of such systems is so far not as common in the hip or the hand as the knee, OA researchers can now utilize these potentially useful tools for clinical or epidemiological studies involving hip and hand OA.
5.3.4 Cartilage Compositional Imaging
One of the promising aspects of MRI for OA research and clinical practice is its capability to assess biochemical properties of different joint tissues and thus to be very sensitive to early, pre-morphologic changes. The vast majority of studies applying compositional MRI have focused on cartilage, although there also seems to be a possible role for compositional techniques in the assessment of other tissues such as the meniscus or the ligaments (Krishnan et al. 2007; Rauscher et al. 2008; Li et al. 2011).
Possibly the most studied parameter for molecular imaging of cartilage is T2 mapping. T2 reflects the interactions between water molecules and surrounding macromolecules which are affected by the many physiologic and pathophysiologic processes within cartilage. Focal increase in T2 relaxation time has been associated with cartilage matrix damage, in particular with loss of collagen integrity and an increase in water content (Dunn et al. 2004; Menezes et al. 2004). In contrast, other data demonstrate unchanged or decreased T2 with in vitro degeneration (Li et al. 2007) and in clinical T2 images (Burstein 2006). These studies were limited by reporting of a bulk T2 value from heterogeneous areas of T2 in cartilage. Thus, more sophisticated T2 analysis tools, as well as larger and long-term studies, will be needed to better evaluate the overall diagnostic and prognostic power of T2.
A second parameter that has been investigated in depth for biochemical imaging is T1rho MRI, or T1 in the rotating frame. T1rho is similar to T2 in that it is sensitive to interactions of water with macromolecules. T1rho has been shown to correlate with the proteoglycan concentration in cartilage (Borthakur et al. 2006) and is also sensitive to collagen (Menezes et al. 2004). Although T1rho has been shown to have a larger dynamic range than T2 (Li et al. 2007), it is more complex to implement and is limited by radiofrequency power deposition. A recent study demonstrated thatT1rho and T2 values show different spatial distributions and may provide complementary information regarding cartilage degeneration in OA (Li et al. 2009). Current pulse sequence development is ongoing to enable more widespread implementation (Pakin et al. 2006), allowing larger and longer-term studies to better delineate its utility in the study of OA.
Sodium MRI and the dGEMRIC technique are designed to measure fixed charge density in cartilage, adapting established biochemical and histological approaches for measuring proteoglycan content (Gray et al. 2008) (Fig. 5.19). In the MRI implementation of this principle, the mobile ions are the naturally abundant sodium or the MRI contrast agent Gd(DTPA)2− (Magnevist, Berlex, NJ).
Get Clinical Tree app for offline access
Fig. 5.19
Compositional MRI. (a) Baseline proton density-weighted fat-saturated image shows an oblique-horizontal meniscal tear at the posterior horn of the medial meniscus (arrow). (b) Corresponding dGEMRIC image shows normal color coding of articular surface at medial femur and tibia. Note physiologically higher dGEMRIC values in the center of the meniscus (arrows). (c


Related posts:
Stay updated, free articles. Join our Telegram channel
Full access? Get Clinical Tree
