Breath-hold acquisition
Free-breathing/respiratory-triggered acquisition
Sequence
SE
SE
Field of view (cm)
37.5 × 30
37.5 × 30
Matrix
152 × 120
124 × 120
Repetition time (TR)
≥980
≥1,230
Echo time (TE)
Minimum (~34)
Minimum (~59)
EPI factor
63
53
Number of averages
2
4
Slice thickness (mm)
7
5
Number of slices
25
25
Slice orientation
Axial
Axial
Direction of motion probing gradient
Phase, frequency, and slice
Phase, frequency, and slice
Fat suppression
Yes
Yes
b-Values (s/mm2)
One or more
3 or more
Acquisition time
15
2–3 min (free-breathing), 4–5 min (respiratory-triggering)
Breath-holding DWI is the simplest method. One or two breath holds are required for about 20 s. This is done with a single acquisition to obtain maximum anatomical coverage. The advantage of breath-holding DWI is the minimal acquisition time. The disadvantages include low SNR, low spatial resolution, and high sensitivity to distortion.
Free-breathing multiple averaging DWI was first described by Dr. Takahara and is also known as DWIBS. In this technique, signal averaging is performed more than 4 times to obtain a sufficiently high SNR. ADC measurement is possible in this technique because the respiratory motion is bulky and slow that it can be considered as a coherent motion.
The advantages of free-breathing DWI are the high SNR, ability to obtain multiple b-values that enables ADC measurements, high spatial resolution, and thin slice sections. It can be performed even for uncooperative patients including pediatric cases. The disadvantages include long acquisition times, usually requires more than 3 min, and image blurring. Another disadvantage is that it is suboptimal for assessing small lesions.
Respiratory-triggered DWI is the most sophisticated method. Multiple averaging of 3 or 4 times is essential to obtain a sufficiently high SNR. Respiratory-triggered DWI shares all of the advantages of the free-breathing method. Additionally, minimal motion artifacts in this technique enable assessments of small lesions. Minimal slice misalignment is useful for preparing a fusion image. Accurate ADC measurements can be performed by eliminating the signal drop due to respiratory motion. The main disadvantage is the long acquisition time. It may take more than 5 min if the breathing of the patient is irregular. The time-consuming nature of this method limits the number of slices and anatomical coverage.
Signal intensity of both liver lobes is affected by cardiac motion in DWI. The signal loss ratio is more on the left lobe than right lobe (25.5 % vs. 17.3 %) [1].
Fat Suppression
Fat suppression is essential to reduce chemical shift-induced ghosting in EPI-based DWI. Short tau inversion recovery (STIR) has several advantages including complete fat suppression. STIR also suppresses signals from materials with short T1-relaxation times, for example, feces in the colon or rectum. Low SNR is a disadvantage. Chemical fat-selective saturation (CHESS) is more commonly used for abdominal DWI to obtain high SNR.
Choice of b-Values and Sequence Optimization
The choice of b-value is a matter of great importance and depends on the purpose of the DWI.
When DWI is performed for lesion detection, an image with b = 0 is not required. A single or two b-values, including low and high b-values, are enough for this purpose. However, two or more b-values including b = 0 may be the most common choice, yielding both detection and ADC measurements. If 3 or more b-value images are obtained, the ADC measurement is more accurate.
When 8 or more b-values are used, a more complicated and sophisticated analysis can be performed, which is known as intra-voxel incoherent motion (IVIM) imaging.
Low b-value (b = 20–150 s/mm2) suppresses the intrahepatic blood vessels signal yielding a black blood images, which improve focal liver lesion detection.
High b-values (≥600 s/mm2) are considered appropriate to reduce T2 shine-through ghosting, minimize the perfusion, and suppress unfavorable background signals. Of course, SNR is a key parameter to be considered when increasing the b-value. Disadvantage of high b-values is low SNR. In routine clinical practice obtaining two b-values, including one low and one high, is necessary to improve lesion detection and characterization.
Qualitative and Quantitative Assessment
Trace DWI for each b-value and ADC map is displayed. Visual assessment of DWI trace images is useful for focal liver lesion detection and characterization. Low b-value images are evaluated for lesion detection, whereas high b-value images are assessed for lesion restricted diffusion and characterization. The signal observed on DWI is related to tissue diffusion, perfusion, and tissue T2 relaxation time. Therefore DWI has some T2 weighting and lesions such as cysts or hemangiomas, which have long T2 relaxation time, usually show high signal (T2 shine-through). To reduce T2 shine-through, high b-value images and ADC maps should be assessed. On high b-value images cyst and hemangiomas show signal drop, whereas on ADC maps these lesions return high signal and high ADC values.
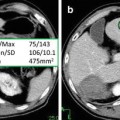
The ADC value of the liver can be calculated by drawing a region of interest (ROIs) on the ADC maps. ADC value is usually expressed in (×10−3) mm2/s and is strongly depends on the b-value chosen for its calculation. With mono-exponential fitting, two b-values are chosen for ADC calculation. The ADC value is overestimated when b = 0 s/mm2 is chosen as the first value, because of the effect of microperfusion [2]. ADC calculated with b > 50 s/mm2 as the first value (not b = 0) is more reproducible and represents pure diffusion [2]. ADC is more reproducible and represent pure diffusion when b-values >50 s/mm2 are used, but a substantial variations in ADC exist even when these b-values are used. The greater the b-value, the greater the noise and the lower the SNR.
Bi-exponential fitting requires 8 or more b-values and produce IVIM DWI. In addition to ADC, other diffusion parameters can be calculated with IVIM DWI including perfusion-related diffusion (D* or Dfast), pure diffusion (D or Dslow), and perfusion fraction (f). For more accurate and reproducible calculation of D* very low b-values (between 0 and 20 s/mm2) are necessary [2].
Applications of Liver DWI
DWI proved to be useful for liver lesion detection and characterization. DWI has the potential for the diagnosis of liver cirrhosis and for staging of fibrosis. Furthermore, it can be used for assessment of tumor treatment response.
Liver Lesion Detection and Characterization
DWI for Characterization of Focal Liver Lesions
Both direct visual assessment of DWI and ADC calculation could be used for lesion characterization. Visual assessment using low and high b-values and ADC map images could distinguish solid from cystic lesions (Table 2). Cystic lesions display significant signal drop on high b-values, whereas solid lesions usually retain high signal on high b-values (Figs. 1 and 2).
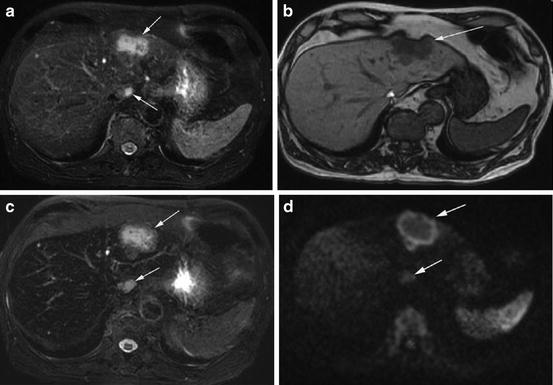
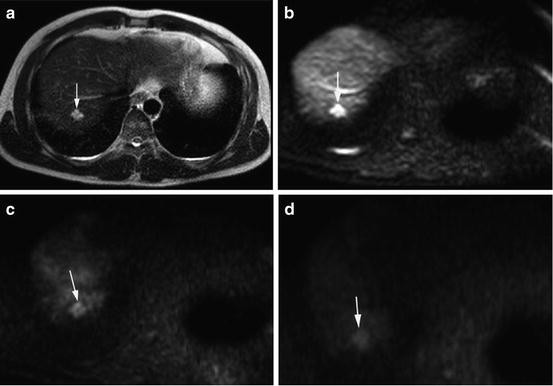
Table 2
Characterization of focal liver lesions by visual assessment of low b-value, high b-value, and ADC maps
Low b-value | High b-value | ADC map | |
|---|---|---|---|
Simple cyst | Hyperintense | Hypointense | Iso- to hyperintense |
Malignant lesions (HCCs, metastases) | Hyperintense | Iso- to hyperintense | Hypointense |
Hemangioma, FNH, adenoma | Hyperintense | Iso- to hyperintense | Iso- to hyperintense |
Necrotic HCC or metastasis | Hyperintense | Peripheral hyperintensity | Peripheral hypointensity |
Fig. 1
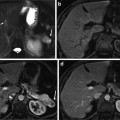
A 71 years old male patient with metastases from colon cancer at left lobe of liver (arrows). (a) Axial fat-saturated T2WI shows tumors as heterogeneous intermediate signal intensity. Small cysts were noted as bright lesions in left and right lobes of liver. (b) Tumors and cysts display low signal intensity compared to liver on axial T1WI. (c) The tumors show heterogeneous intermediate signal and the cysts show high signal intensity on axial SPIO-enhanced T2WI. (d) Axial DWI (b = 1,000 s/mm2) shows tumors as hyperintense relative to the liver, whereas cysts display isointense signal
Fig. 2
A 31 years old male with hepatic hemangioma (arrow). (a) Axial T2-weighted images shows high signal intensity lesion at the right lobe liver. (b) The lesion appears hyperintense on axial DWI (b = 0 s/mm2). (c, d) The lesion shows decrease signal on moderate and high b-values (b = 400 and b = 800 s/mm2) consistent with benign lesion
Several publications used ADC measurement for discriminating malignant from benign lesions with acceptable diagnostic accuracy (Table 3) [3–15]. Most malignant tumors show high signal intensity on DWI (both low and high b-values) and low signal on ADC map (Figs. 3, 4, and 5). This finding may be due to increase cellular density, complex histological architecture, or increased nuclear/cytoplasmic ratio of malignant tumors which impair the diffusion of protons.
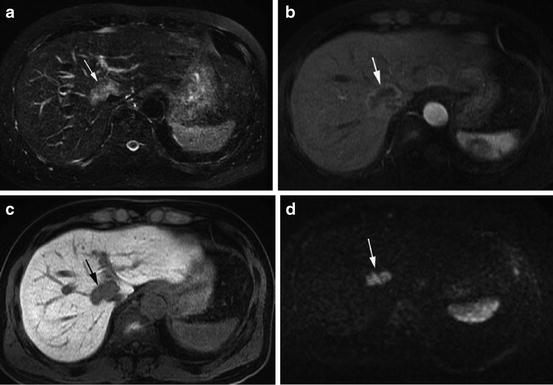
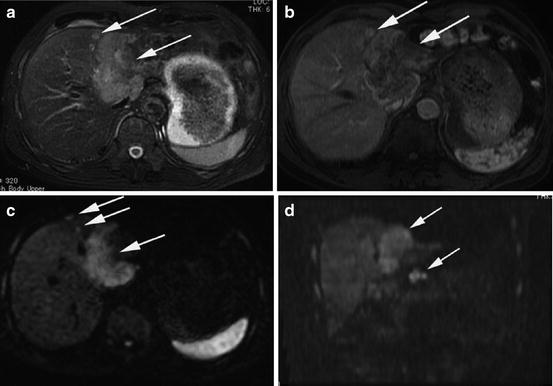
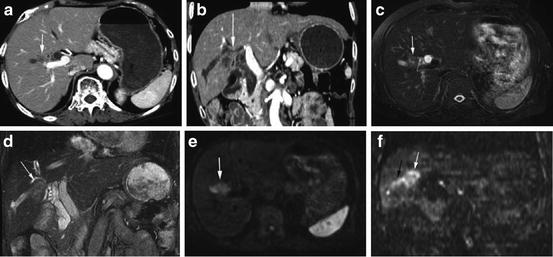
Table 3
Mean apparent diffusion coefficients (ADCs) of focal liver lesions, ADC cutoff, sensitivity and specificity for diagnosing malignant lesions
Cieszanowski | Miller | Namimoto | Battal | Parikh | Bruegel | Gourtsoyianni | Kim | Holzapfel | Taouli | |
|---|---|---|---|---|---|---|---|---|---|---|
Number of lesions | 215 | 542 | 59 | 143 | 211 | 204 | 37 | 79 | 185 | 52 |
b-Values (s/mm2) | 50,400,800 | 0,500 | 30,1200 | 0,800 | 0,50,500 | 50,300,600 | 0,50,500,1000 | ≤846 | 50,300,600 | ≤500 |
ADC (mm2/s) | ||||||||||
Metastasis | 1.05 | 1.50 | 1.15 | 1.50 | 1.22 | 0.99 | 1.06–1.11 | 1.08 | 0.94 | |
HCCs | 0.94 | 1.54 | 0.99 | 1.31 | 1.05 | 1.38 | 0.97–1.28 | 1.12 | 1.33 | |
Hemangiomas | 1.55 | 2.26 | 1.95 | 2.04 | 1.92 | 1.90 | 2.04–2.10 | 1.69 | 2.95 | |
Cysts | 2.45 | 3.40 | 3.05 | 2.54 | 3.02 | 2.55 | 2.91–3.03 | 2.61 | 3.63 | |
FNH-Adenomas | 1.18 | 1.79 | 1.20 | 1.49 | 1.40 | 1.43 | 1.75 | |||
Benign lesions | 2.50 | 1.95 | 1.94 | 2.19 | 2.55 | 2.49 | 2.36 | 2.45 | ||
Malignant lesions | 1.52 | 1.04 | 0.86 | 1.39 | 1.04 | 1.01 | 1.09 | 1.08 | ||
Abscess | 1.50 | 1.97 | 1.20 | |||||||
Cutoff ADC for differentiating of malignant lesions | 1.25 | 1.5 | 1.21 | 1.60 | 1.63 | 1.47 | 1.60 | 1.41 | 1.50 | |
Sensitivity | 79 | 57 | 100 | 74 | 90 | 100 | 98 | 91 | 84 | |
Specificity | 83 | 91 | 89 | 77 | 86 | 100 | 80 | 90 | 89 | |
Fig. 3
A 61 years old male with peripheral cholangiocarcinoma at the right lobe of liver anterior to IVC (arrows). (a) Axial T2-weighted images well-circumscribed lobulated mass with intermediate signal intensity. (b) Axial arterial phase of gadoxetic acid-enhanced MRI shows moderate rim enhancement with central heterogeneous poor enhancement. (c) Axial hepatobiliary phase image at 20 min shows tumor as hypointense mass. (d) The tumor displays high signal intensity on axial DWI (b = 1,000 s/mm2)
Fig. 4
A 74 years old male with pathologically proved peripheral cholangiocarcinoma with LN metastases (arrows). (a) Axial T2-weighted images show large well-circumscribed lobulated mass with intermediate signal intensity at the left lobe of liver with satellite lesion around the lesion. (b) Axial arterial phase of CE-MRI shows moderate rim enhancement with central heterogeneous minimal enhancement. (c, d) The tumor displays high signal intensity on axial and coronal DWI (b = 1,000 s/mm2). Note satellite lesions around the tumor on axial image and lymph nodes metastases inferior to the left lobe of liver on coronal images
Fig. 5
A 76 years old female with periductal-infiltrating cholangiocarcinoma of right lobe of liver. (a, b) Axial and coronal T2WI show poorly defined mass with intermediate signal intensity with dilatation of bile duct due to obstruction by tumor. (c, d) Axial and coronal arterial phase of CECT shows minimal enhancement. (e, f) Axial and coronal DWI (b = 1,000 s/mm2) shows the tumor as hyperintense with tumor growth along bile duct appears as speculation or branch-like on coronal DWI (arrow)
However, considerable overlap in ADC exists between malignant lesions and benign lesions, particularly solid benign lesions such as adenoma or FNH (Fig. 6) [14, 16]. The decrease in ADC in solid benign lesions may be related to increase cellularity that restricts diffusion.
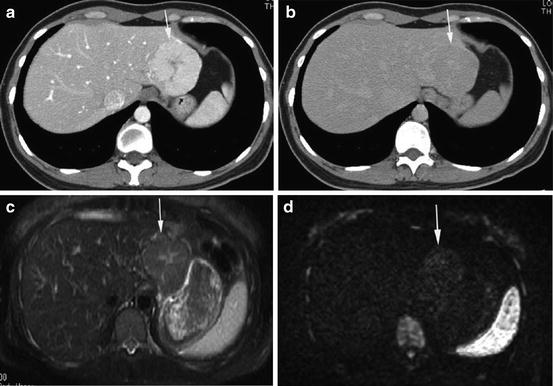
Fig. 6
A 31 years old female patient with hepatic FNH (arrow). (a) Axial arterial phase CECT shows a bright homogeneous enhancement of the mass with a central scar. (b) Axial delayed phase CECT shows the mass as isodense to the liver. (c) Axial T2WI shows the mass as slightly hyperintense with hyperintense central scar. (d) Axial DWI (b = 1,000 s/mm2) shows the mass as slightly hyperintense
Benign lesions such as hemangiomas or simple cysts which are the most common lesions observed in clinical practice appear high signal on low b-value DWI and usually return iso to low signal on high b-values. These benign lesions usually return high ADC (Fig. 7). On the other hand cystic (mucinous) or necrotic tumor tends to return high ADC, and could be falsely diagnosed as benign.

Fig. 7
A 47 years old male patient with colon cancer and hepatic hemangioma (arrow). (a) Axial T2-weighted images show a high signal intensity lesion at the right lobe of liver. (b) Axial T1WI shows the lesion as low signal. (c, d) The lesion shows high signal intensity relative to the liver parenchyma on both DWI (b = 400 s/mm2) and ADC map, respectively. The tumor showed peripheral nodular enhancement with centripetal filling on dynamic CT images (not shown)
Haradome et al. reported that combined interpretation of T2WI and DWI yielded better diagnostic accuracy for discrimination benign from malignant focal liver lesions than each sequence alone [17]. DWI was superior to T2-weighted images for the detection of malignant hepatic lesions; however no difference was observed for characterization of focal hepatic lesions or for detection of benign lesions [18]. DWI, especially with a low b-value 20 s/mm2, was superior to T2-weighted images for detection of hepatic metastases, particularly for small lesions less than 10 mm [12].
Inan et al. reported that DWI could help in the differential diagnosis of hydatid and simple cysts of the liver. Most hydatid cysts (95 %) were hyperintense, whereas most simple cysts (93 %) were isointense with the liver. ADC was 2.9 for hydatid cyst vs. 3.5 (×10−3 mm2/s) for simple cyst [19]. Fruehwald-Pallamar et al. suggested that DWI could be added to the conventional MRI to increase diagnostic confidence for differentiation between pseudolesions and other focal hepatic lesions. In this study, all hepatic pseudolesions were invisible on DWI [20].
In conclusion, a substantial overlap exist in ADC between malignant and solid benign lesions particularly adenomas and FNH. This overlap in the reported ADC may be due to difference in b-value used or type of acquisition technique (breath hold, free-breathing, or respiratory-triggered technique). DWI and ADC should be used as ancillary to conventional MRI (i.e., unenhanced conventional MRI or dynamic contrast-enhanced MRI) for lesion characterization.
Diagnosis and Detection of HCC
HCCs tend to develop in patients with cirrhosis or chronic liver disease. The diagnosis of HCC depends on observation of increased vascularity (hypervascular) on arterial phase and washout on portal venous or equilibrium phase (AASLD criteria). Dynamic contrast-enhanced CT or MRI has reached a high standard for diagnosis of HCC. With the introduction of liver-specific contrast agent (such as gadoxetic acid), MRI proved to be the best imaging modality for the detection of HCC and for characterization of hepatic nodules in cirrhosis and is superior to CT. Most HCCs show high signal intensity on DWI (both low and high b-values) and low signal on ADC map (Figs. 8, 9, 10, 11, and 12).
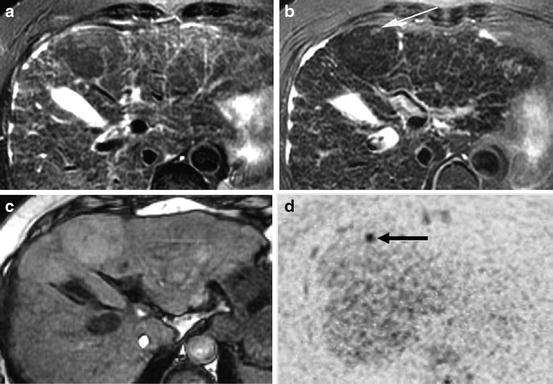
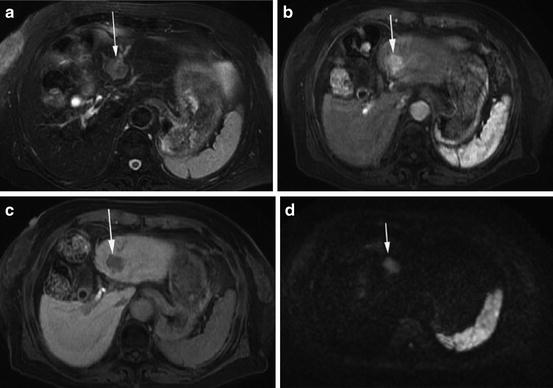
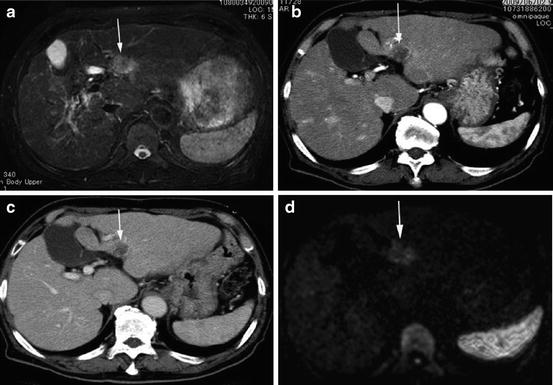
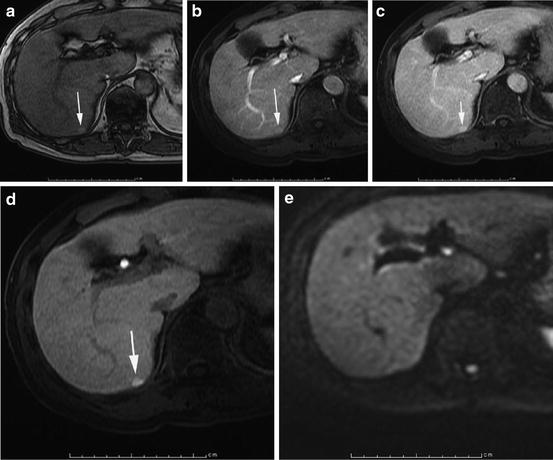
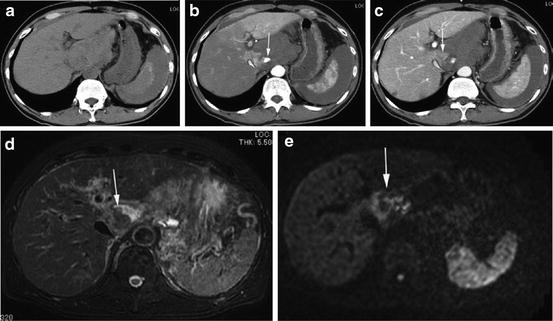
Fig. 8
A 66 years old female with a small HCC within large dysplastic nodule at the left lobe of liver (Nodule-in-nodule pattern). (a) Axial T2WI shows dysplastic nodule as large mass with low signal intensity. (b) HCC appears as small focus of increased signal intensity within hypointense dysplastic nodule on axial superparamagnetic iron oxide (SPIO)-enhanced T2WI. (c) Axial T1WI shows dysplastic nodule as slightly hyperintense mass relative to the liver. (d) Axial DWI (b = 1,000 s/mm2) with black and white inversion shows HCC as small focus of increased signal intensity within isointense dysplastic nodule
Fig. 9
A 63 years old female with moderately differentiated HCC at left lobe of liver (arrow). (a) Axial fat-saturated T2WI shows tumor as heterogeneous intermediate signal intensity mass. (b, c) Tumor displays hypervascularity on arterial phase and washout on delayed phase of dynamic CE-MRI. (d) The tumor appears as hyperintense on axial DWI (b = 1,000 s/mm2)
Fig. 10
A76 years old male with NBNC liver cirrhosis and poorly differentiated HCC at left lobe of liver (arrow). (a) Axial fat-saturated T2WI shows tumor as heterogeneous intermediate signal intensity mass. (b, c) Tumor displays hypovascularity on arterial phase and delayed phase of dynamic CECT. (d) The tumor appears as hyperintense on axial DWI (b = 1,000 s/mm2)
Fig. 11
A 60 years old male with early HCC at right lobe of liver (arrow). (a) Axial opposed-phase T1WI shows tumor as hyperintense nodule. (b, c) Tumor displays subtle hyperintensity on arterial phase and delayed phases of dynamic CE-MRI. (d) Tumor shows hyperintensity on hepatobiliary phase image (20 min) of gadoxetic acid-enhanced T1WI. (e) The tumor appears as isointense on axial DWI (b = 1,000 s/mm2). Tumor shows no enhancement on dynamic CECT (not shown)
Fig. 12
 Approach to Detection and Characterization of Hepatic Hemangiomas
 Resonance Imaging of Adenocarcinoma of the Pancreas
 Imaging Characteristics of Hepatocellular Carcinoma
 Cortex Segmentation on Computed Tomography
 Liver Segmentation Without Prior Statistical Models
 Surface Registration Using Ricci Flow


Related posts:
Approach to Detection and Characterization of Hepatic Hemangiomas
Resonance Imaging of Adenocarcinoma of the Pancreas
Imaging Characteristics of Hepatocellular Carcinoma
Cortex Segmentation on Computed Tomography
Liver Segmentation Without Prior Statistical Models
Surface Registration Using Ricci Flow
Stay updated, free articles. Join our Telegram channel
Full access? Get Clinical Tree
