Fig. 14.1
(a) The leading circle concept: Activity establishes itself in the smallest pathway that can support reentry, shown as a large black arrow. Inside the leading circle, centripetal wavelets (small arrows) emanating from it constantly maintain the central core in a refractory state. (b) Spiral wave model: Schematic diagram of a spiral wave with the activation front shown in black and the repolarization front in red. The point at which the red and black curves meet has an undefined voltage state and is usually referred to as the phase singularity point. Modified from Comtois et al. (2005)
3 Imaging of Fibrillation
3.1 Electrical Mapping
On the electrocardiogram, ventricular fibrillation presents as irregular and random waveforms with no clearly identifiable QRS complexes or P waves. Therefore, the electrocardiogram cannot be used for understanding the underlying mechanism of fibrillation. To study the re-entrant activation patterns, underlying local ventricular activation needs to be recorded. In the explanted perfused heart, multi-electrode grids enable the simultaneous recording of local extracellular electrograms at multiple locations. In a clean unipolar local electrogram the minimal dV/dt of the RS complex corresponds to the local time of myocardial activation under the electrode (Spach et al. 1972; Dower 1962). From these local times of activation a map can be generated, which reveals the activation sequence and the possible re-entrant pathway as shown in Fig. 14.2. Multi-electrode grids can be placed on the endocardium and the epicardium in order to simultaneously measure the activation pattern on both sides. Needle electrodes can be use to record the transmural activation patterns (Pogwizd and Corr 1987).
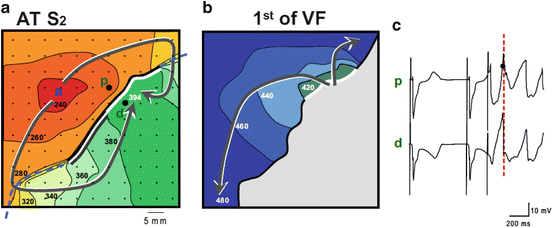

Fig. 14.2
Electrical mapping of ventricular fibrillation. At the right, an activation map is reconstructed of a premature beat (following S2). In the middle, the activation pattern is reconstructed VF is induced, because local distal activation coincided with local proximal repolarization. The dashed line indicates the epicardial interface between the perfusion beds. Small dots indicate electrode positions. Bold dots indicate positions from which electrograms (right panels) were recorded (p, proximal; d distal). Lines are 20 ms isochrones. Red dotted vertical line in the electrograms indicate the moment of distal activation. This figure is a courtesy of Dr. Ruben Coronel (Coronel et al. 2009)
In the clinic, catheter mapping is used to record activation times (Shenassa et al. 2013). For monomorphic arrhythmias, a single roving catheter can be used, which will be sequentially placed on numerous sites (for instance the CARTO system (Biosense-Webster, Baldwin Park, CA, USA)). The position of the electrode is monitored using a heterogeneous magnetic field of which the strength can be detected by a sensor at the tip of the catheter. This enables the 3D reconstruction of the activation pattern. However, this technique is not suitable for mapping irregular arrhythmias because it is based on sequential recordings. Newer CARTO mapping systems use catheters with multiple electrodes and begin to circumvent this problem. Another often-used system is EnSite (St. Jude Medical, Inc., St. Paul, MN, USA), which is based on multi-electrode non-contact mapping. With this method the inverse solution is used to calculate the local moments of activation on the endocardium (Taccardi et al. 1987). The introduction of catheter non-contact and contact mapping has improved diagnosis and led to treatment of arrhythmias by ablation or antitachycardia pacing (Josephson et al. 1978; Durrer et al. 1967). However, electrical mapping techniques are not suitable for recording the tissue response directly after defibrillation because the overwhelming shock-induced artifacts mask the signal.
3.2 Optical Mapping
Electrical mapping has been a useful tool for studying the mechanisms of arrhythmia origin and perpetuation and even led to a variety of therapies. However, there are shortcomings of electrical mapping. The spatial resolution is limited and it is not possible to measure local electrical activity during or after a defibrillating shock (for reasons that will be discussed in detail later). Optical mapping provides an alternative method for measuring cardiac electrical activity and addresses the aforementioned shortcomings of electrical mapping (Boukens and Efimov 2014). Since optical mapping requires the use of fluorescent dyes the method is currently restricted to the experimental ex vivo settings.
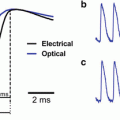
Cardiac electrical activity can be transduced into fluorescent signals by using voltage sensitive dyes that bind to the membrane of cardiomyocytes. When a dye molecule binds to the membrane, emitted fluorescence can be recorded upon excitation of the dye. The wavelength of the emitted light depends on the membrane potential of the cardiomyocyte. When the membrane potential changes (i.e. during the action potential), the dynamic wavelength of the emitted light can be recorded as a loss in fluorescence with appropriate filter settings on the acquisition hardware. Filters are specific for particular dyes (e.g. excitation 520 ± 20 and emission >650 nm for di-4-ANEPPS). The change in emitted light is linearly related to the membrane potential, which enables the recording of “optical action potentials”. This mechanism is illustrated in Fig. 14.3. The number of myocytes that give rise to an optical action potential signal depends on the type of the dye, the optical magnification, the focal plane and the pixel size of the sensor that is used for recording. Optical action potentials are not only derived from fluorescence collected from the surface of tissue but also of fluorescence from deeper layers (Bishop et al. 2007). Therefore, the optical action potential is an underestimation of the transmembrane potential on the surface and should be compared with transmembrane potential averaged over depth (Janks and Roth 2002). Commonly used sensors for recording optical action potentials are photodiode arrays, CCD and CMOS cameras (Efimov and Salama 2012).
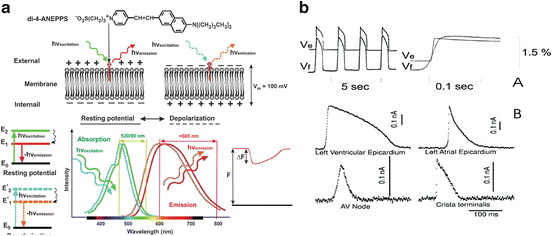

Fig. 14.3
Optical recording of cardiac action potentials using fluorescent dyes. (a) The upper panel illustrates the conformation change of di-4-ANEPPS upon a change in membrane potentials. The lower panel shows the shift in emission spectrum results in a change in the amount of recorded fluorescence. (b) The upper panel, Simultaneous fluorescent (Vf) and microelectrode (Ve) recordings of action potentials in the frog heart stained with Merocyanine-540. The lower panel, Optical recording of action potentials from different regions of the heart stained with di-4-ANEPPS: ventricular and atrial working myocardium, AV node, and Crista terminalis. Modified from Boukens et al. and Efimov et al. (Boukens and Efimov 2014; Efimov et al. 2004)
Although, optical mapping is often the method of choice in experimental cardiology there are some disadvantages of this technique that need to be considered. Excitation of the fluorescent dye has been shown to produce toxic free radicals and may cause death of cardiomyoctyes. This side effect is most prominent when single myocytes or monolayers are measured. Also, the excitation of deeper located layers cause light scattering and distortion of the optical signal (Bishop et al. 2007; Ramshesh and Knisley 2003). Another disadvantage is that contractions of the heart lead to changes in emission intensity related to motion artifacts not the membrane potential. Therefore, in order to accurately measure the shape of optical action potentials, the excitation and contraction must be pharmacologically uncoupled. A common uncoupler agent is blebbistatin (Fedorov et al. 2007), but cytochalasin D and 2,3-butane-dion monoxime have also been used.
3.3 Panoramic Imaging
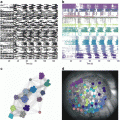
Although optical mapping and, to a lesser extent, conventional multi-electrode grids, increases spatial resolution, neither can track conduction when the activation front propagates outside the limited field of view. This hampers the reconstruction, and thereby interpretation, of the activation sequence, especially during complex re-entrant patterns. Panoramic imaging refers to optical imaging using multiple cameras or mirrors to measure from at least three different angles. This technique allows reconstruction of complete epicardial activation patterns (Kay et al. 2004) and has given insight into complex activation patterns during ventricular fibrillation. Figure 14.4 is an example of a re-entrant activation pattern of a rabbit heart using panoramic optical mapping (Ripplinger et al. 2009; Rogers et al. 2007).
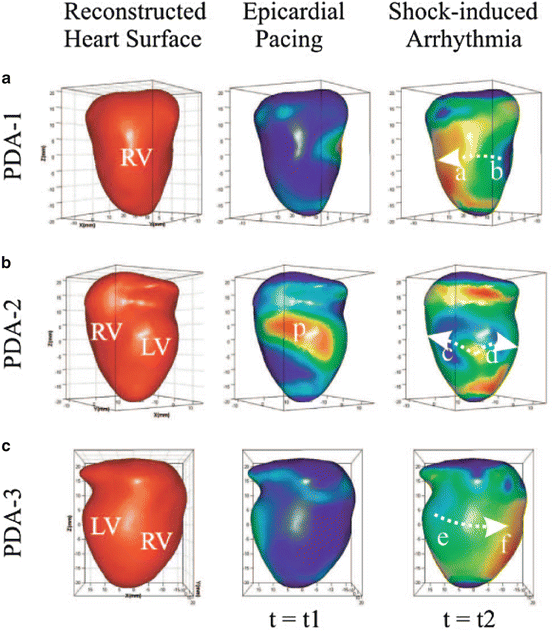

Fig. 14.4
Reconstructed heart surface and epicardial action potential texture mapping. Left: reconstructed heart surface visualized from 3 projections (a–c) of PDA arrays. Middle: epicardial action potential texture mapping during epicardial pacing (p in PDA-2 projection is the pacing site). Right: epicardial action potential texture mapping during shock-induced ventricular tachycardia. Modified from Qu et al. (Lou et al. 2008)
Another problem with conventional optical mapping is that a curved epicardial surface is projected onto a 2-dimensional sensor. This means that distance in the “Z” direction is not taken into account. This is a limitation, when conduction velocity is calculated, because it leads to underestimation of conduction velocity, especially near the edges of the field of view. Panoramic imaging enables the projection of a 3-dimensional conduction pattern on the surface of the heart (Lou et al. 2012). Conduction velocity can be more precisely measured thereby improve our understanding of conduction during normal and re-entrant activation patterns.
3.4 Optical Imaging of Ventricular Fibrillation
As mentioned above the optics of a set-up can be fined tuned to specific applications, providing control over the spatial resolution and depth of the recorded signals. The fine spatial resolution of optical mapping makes it an ideal platform for tracking the dynamics of ventricular fibrillation, pinpointing focal discharges and the critical points of reentrant wavefronts as well as the critical points that are created when energy is applied during electrotherapy. Chapter 13 (Gray et al.) outlines how optical mapping can be used to study the mechanisms that maintain ventricular fibrillation including phase singularity tracking.
4 Bidomain Model of Cardiac Muscle
Activation of a myocyte causes passive flow of current into an adjacent quiescent myocyte through gap junctions. This leads to membrane depolarization of the adjacent myocyte and, when threshold is reached, activation of the sodium channels causing excitation. Since an electrical circuit needs to be closed in order to let current flow the intracellular current that flows from cell 1 to cell 2 leads to extracellular flow of current from cell 2 to cell 1. A schematic representation of the relation between intra and extra cellular potentials is shown in Fig. 14.5. This mechanism underlies propagation of the activation front in the myocardium (Kleber and Rudy 2004). Thus, propagation can be sub-divided to an intracellular domain, representing activation of myocytes and passive conduction through gap junction, and an extracellular domain, composed of all other tissue components. The Bidomain Model of Cardiac Muscle is based on this concept and was first published in the late 1970s (Miller and Geselowitz 1978). The bidomain model describes the relation between intra and extracellular potentials thereby contributing to the understanding of unipolar electrograms and the simulation of the body surface electrocardiogram (Potse 2012). Current bidomain models use multiple membrane models to compute the intracellular domain and allow to simulate complete ventricular activation based on up to 100 million elements (Niederer et al. 2011). These so-called “Reaction-Diffusion” models make it possible to study the effect of a single ion current on local propagation and even on the body surface electrocardiogram. It is also possible to inject extracellular current and study the effect on intracellular electrophysiology. This approach was used by many groups to study the mechanism of defibrillation computationally (Trayanova et al. 2006).
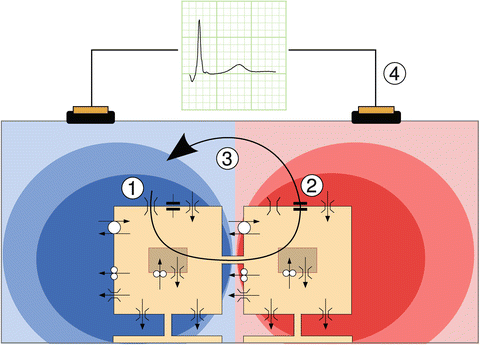

Fig. 14.5
Principle underlying membrane-based heart models. Two model cells are depicted schematically, with their ion channels, pumps, and exchangers. Gap junctions connect the cells. In depolarizing cells, a large inward sodium current flows along its electrochemical gradient (1). This current passes through gap junctions to neighboring cells. There, part of it serves to charge the cell membrane (2) represented by a capacitor symbol, and another part leaks through potassium channels that are still open (3). The two parts form an outward current in this cell, and the current loop is closed in the interstitium and outside the heart (4), where it generates a potential field, schematically indicated here in red for positive potentials and blue for negative potentials. This potential field is picked up as an ECG. This figure is a courtesy of Dr. Mark Potse (Potse 2012)
5 Virtual Electrodes
5.1 Electrical Stimulation
Programmed electrical stimulation is essential for studying electrophysiology of the intact myocardium. Stimulation is established by generating a potential difference between two electrodes, causing electrons to flow between the negative (cathode) and the positive (anode) electrode. If the two electrodes both make contact with the cardiac tissue and are in close proximity, this is called bipolar stimulation. If one electrode makes contact with cardiac tissue and the other (indifferent) electrode makes contact elsewhere, ground or the bath solution, it is called unipolar stimulation. When a unipolar cathode is used for stimulation then the tissue under the electrodes depolarizes, which leads to excitation. Adjacent virtual anodes hyperpolarize tissue and transiently slow activation in lateral directions. Anodal stimulation causes hyperpolarization under the electrode and depolarization under two virtual cathodes, which stimulate the tissue at the lateral borders of the hyperpolarized tissue. The current flow during anodal and cathodal stimulation will be discussed in more detail in the Sect. 5.3.
The method of stimulation may influence stimulation threshold or refractoriness of the tissue. For instance, the repolarizing effect of anodal stimulation may shorten action potential duration and lead to short refractory periods or even completely de-excite the tissue restoring full excitability (Mehra et al. 1977). During bipolar stimulation refractory periods are shorter than during cathodal stimulation as well due to anodal stimulation at the proximal electrode (Mehra and Furman 1979). However, the incidence of inducing arrhythmias is not different between bipolar or unipolar stimulation, (Stevenson et al. 1986) unless anodal and cathodal shocks are considered, which do have significant differences in arrhythmogenic potential.
5.2 Virtual Electrodes
During cathodal stimulation the cardiac tissue right under the electrode depolarizes. However, the myocardium adjacent to the depolarized myocardium hyperpolarizes due to virtual anodes. Thus, the “real” cathode generates two “virtual” anodes. This phenomenon is referred to as “virtual electrodes” (Sepulveda et al. 1989; Furman et al. 1975). To avoid confusion in the nomenclature, often investigators refer to all areas of positive and negative polarizations as “virtual electrodes”, regardless of their proximity to real stimulation electrodes. We will follow this convention. Figure 14.6a shows a computed (passive bidomain model) potential field during central anodal stimulation in a two-dimensional cardiac tissue sheet. The center is highly hyperpolarized (red) whereas the lateral adjacent sides are highly depolarized (blue). In this example the fiber direction is diagonal. The depolarized field expands up and down and shows a “dog-bone-like” morphology. The morphology of the virtual electrode depends on the stimulus strength, fiber direction, and both extra and intracellular resistance (Wikswo et al. 1991). A higher stimulus current causes an increase in the amplitude of positive and negative polarization of corresponding regions. Inversion of the current (i.e. cathodal stimulation) leads to the inverse potential field and virtual electrode pattern. Bipolar stimulation generates virtual electrodes as well (Nikolski and Efimov 2000). The number of virtual electrodes that is generated depends on the location and spacing of the bipole with respect to the fiber direction under the electrodes. When the anode and the cathode are positioned perpendicular to the fiber direction a total of six virtual electrodes will be generated (Fig. 14.6b). If the electrodes are positioned in parallel with the fiber direction a total of four virtual electrodes are observed (Fig. 14.6c) (Nikolski et al. 2002). For comparison, the unipolar stimulation produces a total of three virtual electrodes.
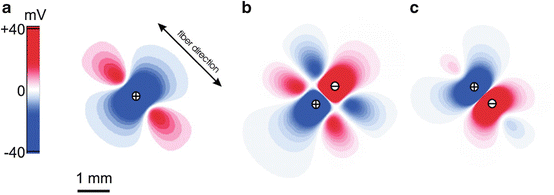

Fig. 14.6
Numerically simulated virtual electrode patterns for an interelectrode distance of 0.8 mm. Results were obtained from the passive two-dimensional bidomain model with unequal anisotropy ratios. (a) 40 mA/cm anodal current applied to the center of the 8 × 8-mm square sheet; (b) bipolar stimulation with the two electrodes located perpendicular to the direction of the fibers; (c) bipolar stimulation with the electrodes located along the direction of the fibers. Zero level corresponds to the resting transmembrane potential (white). This figure is modified from Nikolski et al. (2002)
Optical imaging enables experimental testing of the virtual electrode hypothesis in ex vivo heart preparations. Figure 14.7 shows the transmembrane potential during stimulation of rabbit epicardium. The measured potential field closely resembles the expected morphology based on the computer simulation.


Fig. 14.7
Virtual electrode patterns optically recorded from a 4 × 4-mm area of the rabbit anterior epicardium during unipolar and bipolar stimulation. (a) Conventional “dogbone”-shaped virtual electrode polarizations (VEP) during unipolar cathodal stimulation. (b) VEP during bipolar stimulation with a pacing dipole placed perpendicular to myocardial fibers. (c) Results of bipolar stimulation with electrodes along the fibers. The interelectrode distance was 0.8 mm. Images were collected in the middle of a 2-ms diastolic stimulus. This figure is modified from Nikolski et al. (2002)
5.3 Virtual Electrode Make and Break Excitation
During electrical stimulation not only the “real” electrode can cause excitation but the simultaneously generated surrounding virtual electrodes can produce wavefronts as well. The wavefront will propagate from the virtual cathode to the virtual anode. The direction and lifetime of the induced wavefront is directly dependent of the specific VEP pattern. In this section we will only discuss unipolar cathodal and anodal stimulation, because it is directly relevant for understanding the mechanism of defibrillation, which will be reviewed below. There are four mechanisms of unipolar electrical stimulation: cathode make, anode make, cathode break and anode break (Dekker 1970). The “make” excitation occurs just after the beginning of the stimulus pulse, whereas “break” excitation happens after the end of the pulse.
Cathodal make stimulation resembles normal activation of the cardiac tissue during direct injection of depolarizing current via a microelectrode. The negatively charged real cathode causes depolarization of the myocardium right under the electrode. This depolarization causes the membrane to reach excitation threshold and initiates an activation front. Depending on the stimulus current the activation front will start directly under the electrode or from a point farther from the electrode. Nearby negative virtual anodes will slow the conduction but ultimately will be depolarized by the actively propagating wavefront.
The mechanism of excitation during anodal make stimulation resembles that of cathode make stimulation. However, the positively charged real anode causes hyperpolarization of the myocardium right under the electrode. This means that excitation starts at the lateral sides near the virtual cathode. The amplitude of depolarization near virtual cathode during anodal stimulation is lower than near real cathode during cathodal stimulation. Therefore, the threshold of excitation is lower during cathode make than for anode make stimulation.
As mentioned above, break excitation happens at the end or break of the stimulus. Cathode break stimulation occurs when the myocardial tissue directly under the electrode is refractory and unexcitable. However, the shock does still de-excite the tissue at the virtual anodes, rapidly repolarizing the membrane potential even if the tissue was refractory. At the end of the stimulus the current diffuses to the hyperpolarized tissue, exiting to the myocardium through the virtual anodes. This leads to excitation. The path that is created by the shock is parallel with the fiber direction, and the propagation direction into excitable tissue is different than cathode make excitation. The virtual anode is usually much weaker than the real cathode and therefore cathode make excitation will occur over cathode break excitation.
During anodal break excitation the hyper excitable path is perpendicular to the fiber direction. Thus, after the stimulus pulse, the tissue at the virtual cathode repolarizes slowly allowing current to flow into the tissue directly under the anode, which was rapidly de-excited during the shock. This will lead to excitation and a wave front that will propagate transversely before conducting into the normal myocardium.
6 Mechanisms of Defibrillation
As a therapy, defibrillation has a simple objective: restore a synchronized rhythm to the entire myocardium by terminating fibrillation and allowing restoration of normal sinus rhythm. A large electrical shock has been known to successfully achieve this objective for over a century with a long history of clinical use (Gutbrod and Efimov 2013). However, the precise physiological mechanism of the electrical requirements for success has proven to be a much more complex problem. Across decades the principle hypotheses have been shifting and sometimes even contradictory. Optical mapping has played, and continues to play, a critical role in the evolution of the mechanistic hypotheses for successful defibrillation. Before the development of this technique, investigators were hindered by limitations in available recording instrumentation. Electrical shocks of near defibrillation threshold strengths produce large artifacts in signals recorded with both extracellular and intracellular electrodes. These artifacts overwhelm all intrinsic electrical activity in the presence of the applied electric field and blind investigators to the immediate post-shock tissue interactions. The polarization of the electrodes delays the recovery of the recording integrity even after the shock is completely delivered. Figure 14.8 shows an example of this phenomenon from an ex vivo rabbit heart study. The optical and electrical signals are recorded simultaneously when the shock is delivered at the lightning bolt. Both the local bipolar electrogram in contact with the tissue and the far field bath electrode require >1,000 ms to recover with this instrumentation amplifier. Meanwhile the immediate shock-induced depolarization is visible in the optical signal as well as the delay until the arrhythmia resumes.
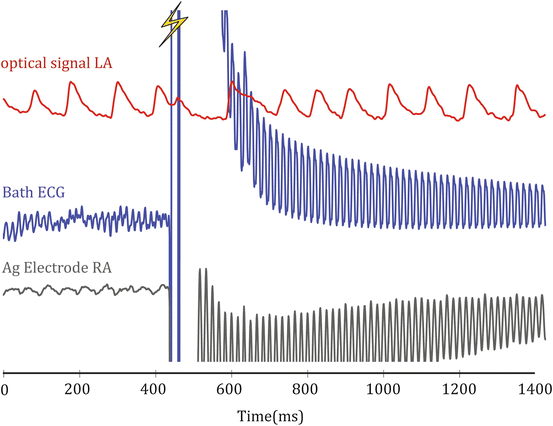

Fig. 14.8
Example of shock-induced artifact on simultaneously acquired electrical and optical signals. These artifacts can be reduced with changes to the instrumentation but cannot be eliminated
Some researchers developed creative attempts to minimize the time that the electrical signal was overloaded, including using a non-polarizable reference electrode (only useful if both the tissue and the field are uniform) or by switching amplifier gains or connectivity on the acquisition systems during shock delivery (Chattipakorn et al. 1998). These techniques decreased the recovery lapse in recording time down to 20 ms but it was still too long to observe the immediate shock response. Membrane bound potentiometric dyes translate the intrinsic electrical signal into an optical signal, which is isolated from the applied electric field but reflects the tissue’s response. In so doing optical mapping allows for the uninterrupted exclusive visualization of the electrical activity of the tissue before, during, and immediately after the shock application. The path of current from an externally applied field flows through the extracellular and intracellular subdomains of the myocardium differently, creating voltage gradients that result in changes in transmembrane potentials. The transmembrane changes are the driving forces of the shock-induced restoration of sinus rhythm through initiated wavefronts. Membrane potential dyes measure the electrical activity with specificity for the signal that is mechanistically determining a successful defibrillation that cannot be achieved with extracellular electrodes.
Stay updated, free articles. Join our Telegram channel

Full access? Get Clinical Tree


