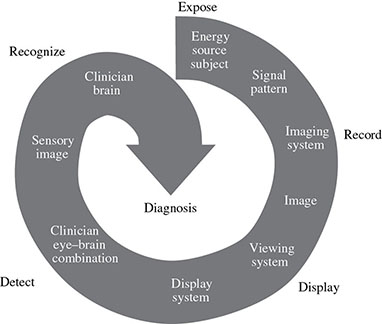
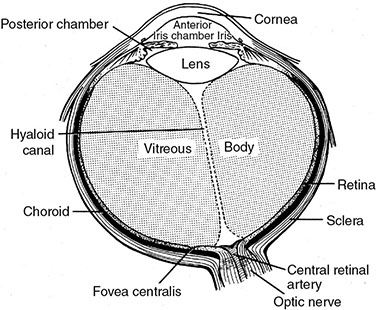
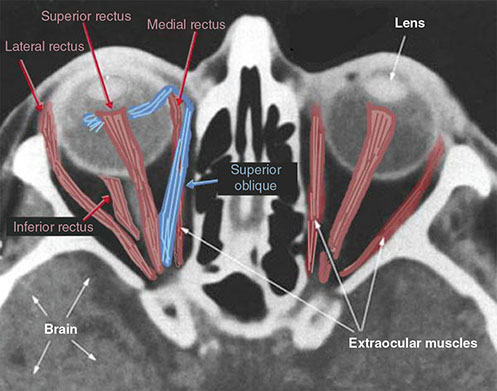
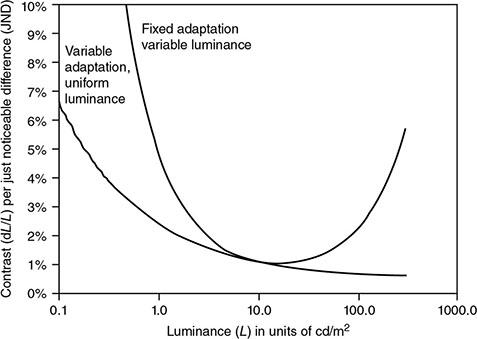
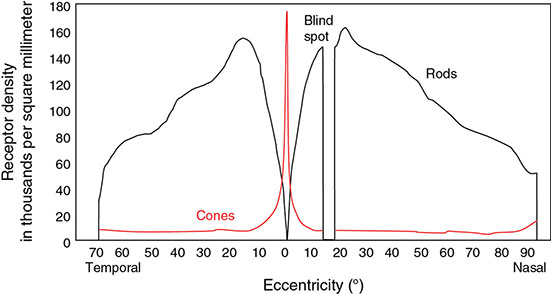
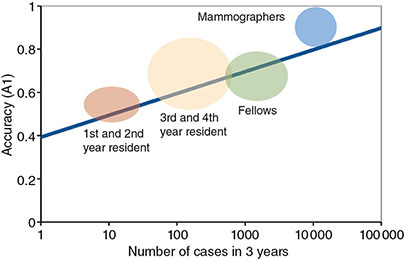
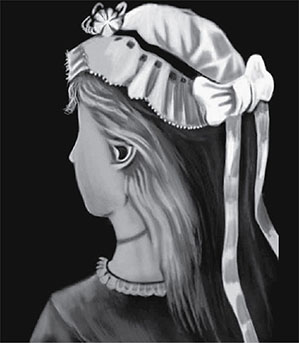
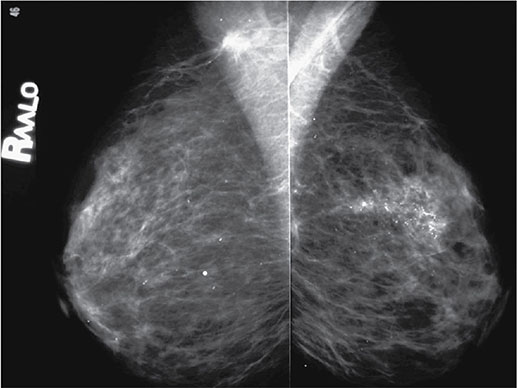
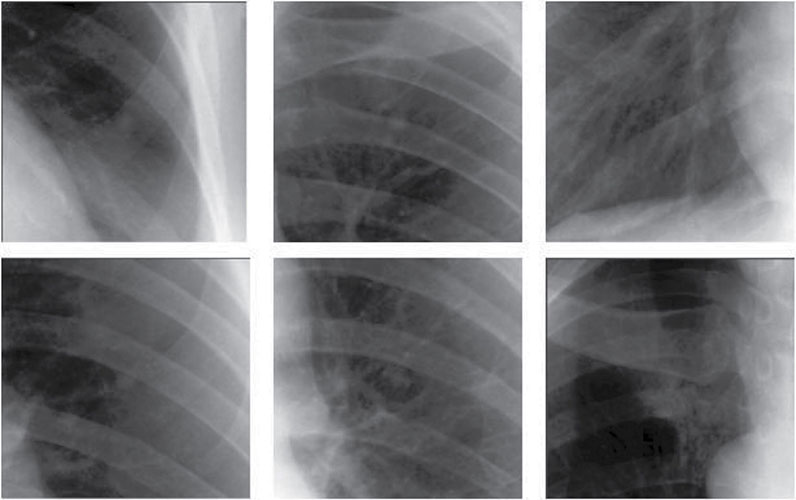
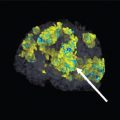
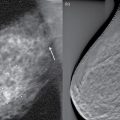
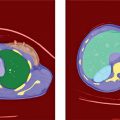
5 All complex endeavors rely on a multiplicity of foundational principles and practices, which may seem to be disparate subjects at first glance but are actually all indispensable components of the overall function and value of the enterprise. Medical imaging, for example, would not be useful without the successful often unacknowledged interplay of four important features: the technologies enabling the image display, the capabilities and limitations of human visual perception in seeing and analyzing the images for key information, the organization and processing of the imaging information, and the continual maintenance/audit of the entire medical imaging system to ensure the accuracy and consistency. These features are independently valuable, and the individual performance of each is important, but they manifest fully when combined into the medical imaging process. The following sections explain these four components and their roles in accomplishing diagnostic and therapeutic tasks. Medical image interpretation is a key component of medical imaging practice. This arises from the fact that a medical image is not self-evident – the interpretation renders a decision about its “meaning” in the context of clinical need. In spite of decades of advancement, medical image interpretation has remained a primarily human task prone to errors. Medical imaging interpretation errors are mostly attributed to the limitation of the human visual perception. A large number of psychophysical and cognitive factors impact the interpretation process. Those include the inherent visual acuity of the human eye as well as basic perceptual processes such as the foveal and peripheral visions, visual search, satisfaction of search (SOS), and the involvement of expertise. With the introduction of intelligent interpretation aids, additional human–machine interaction factors come into play. Radiology is the medical discipline primarily responsible for producing and interpreting most medical images. Consequently, an understanding of the detection and interpretation of visual information has become an essential part of the radiologist’s education. However, the principles apply to any clinical service relying on medical image interpretation. The perception of visual information consists of the three sequential processes illustrated in Figure 5.1. The first process is the detection of visual signals by the observer (Figure 5.2). If visual information is not detected, it cannot be integrated into the perceptual process for its correct interpretation. Important information is sometimes overlooked in radiological images for reasons that are not well understood. Experiments have revealed that radiologists miss 20–30% of the visual clues present in diagnostic images [1–4]. In 10–20% of instances, radiologists detect different signals (interobserver variation) in the same images. Even disagreement with a previous reading by the same radiologist (intraobserver variation) occurs in 5–10% of images. These undetected signals and inconsistencies reflect the tendency of all observers to miss important visual information present in images. Figure 5.1 The perception of visual information. Figure 5.2 Example of a detection challenge; the Dalmatian is difficult to see against the particular background. Even if visual signals are detected, they may be ignored because they are considered inconsequential. The tendency to dismiss information implies a problem of recognition. The observer simply does not appreciate the importance of the information. Eye-tracking experiments performed on radiologists reading diagnostic images have revealed that radiologists frequently look at visual clues that are important to the diagnosis but fail to incorporate them into the interpretive process, indicating that the visual clues are detected but not recognized for their diagnostic value. Visual signals may be detected and their importance recognized, but the diagnosis reached by the radiologist may still be incorrect. This error occurs in the interpretation phase of information gathering and processing, the third step in the model of radiological diagnosis. Error at this level may reflect inadequate training, inexperience, prior conditioning, fatigue, poor judgment, or simply a difficult case in which the wrong option is chosen. Reasonably good models exist to describe the process of detecting visual signals. Paradigms to explain how these signals are recognized as normal and abnormal, important or unimportant, and expected or unexpected are more rudimentary. The greatest enigma of all is understanding how detected and recognized visual signals are woven into an interpretation that leads to a correct medical diagnosis of the patient’s condition [5]. Images are the product of the interaction of the human visual system with its environment. The process of human vision is beyond the scope of this text; detailed treatments are available in texts on human physiology. The human eye is diagrammed in Figure 5.3. It is an approximate sphere that contains four principal features: cornea, iris, lens, and retina. The retina contains photoreceptors that translate light energy into electrical signals that serve as nerve impulses to the brain. The other three components serve as focusing and filtering mechanisms to transmit a sharp, well-defined light image to the retina. Figure 5.3 Horizontal section through the human eye. The wall of the eye consists of three layers (tunics) that are discontinuous in the posterior portion where the optic nerve enters the eye. The outermost tunic is a fibrous layer of dense connective tissue that includes the cornea and the sclera. The cornea comprises the front curved surface of the eye, contains an array of collagen fibers and no blood vessels, and is transparent to visible light. The cornea serves as a coarse focusing element to project light onto the observer’s retina. The sclera, or white of the eye, is an opaque and resilient sheath to which the eye muscles are attached. The second layer of the wall is a vascular tunic termed the uvea. It contains the choroid, ciliary body, and iris. The choroid contains a dense array of capillaries that supply blood to the tunics. Pigments in the choroid reduce internal light reflection that would otherwise blur the images. The ciliary body contains the muscles that support and focus the lens. It also contains capillaries that secrete fluid into the anterior segment of the eyeball. The iris is the colored part of the eye that has a central aperture called the pupil. The diameter of the aperture can be altered through the action of muscles in the iris to control the amount of light entering the eye. The aperture can vary from about 1.5 to 8 mm. The anterior and posterior chambers of the eye are filled with fluid. The anterior chamber contains aqueous humor, a clear plasma-like fluid that is continually drained and replaced. The posterior chamber is filled with vitreous humor, a clear viscous fluid that is not replenished. The cornea, aqueous and vitreous humors, and the lens serve collectively as the refractive media of the eye. The lens of the eye provides the fine focusing of incident light onto the retina. It is a convex lens that can change in thickness by the action of the ciliary muscles. The index of refraction of the lens is close to that of the surrounding fluids in which it is suspended, so it serves as a fine-focusing adjustment to the coarse focusing function of the cornea. The process of accommodation by which near objects are brought into focus is achieved by contraction of the ciliary muscles. This contraction causes the elastic lens to bow forward into the aqueous humor, thereby increasing its thickness. Accommodation is accompanied by constriction of the pupil, which increases the depth of the field (the range of distances over which the eye can form a sharp rendition of details). The ocular accommodation has a mean latency temporal response of about 400 ms. In conjunction with the accommodation, the eyes also undergo a vergence process by which the orientation of each eye is directed toward a point of focus in space (Figure 5.4). The vergence tends to be a faster process than the accommodation with a typical latency time frame of about 200 ms. Figure 5.4 The cross section of the eye system enabling the vergence process. With age, the lens loses its flexibility and is unable to adapt so that near objects can be focused onto the retina. This is the condition of presbyopia, which can be treated with reading glasses to supplement the focusing ability of the lens. Clouding of the lens with age causes a diminution in the amount of light reaching the retina. This condition is known as a lens cataract, which can make the individual a candidate for surgical replacement of the lens, often with an artificial lens. The innermost layer of the eye is the retina, which is composed of two components: an outer monolayer of pigmented cells and an inner neural layer of photoreceptors. As considerable processing of visual information occurs in the retina, it is often thought of more as an outpost of the brain rather than as simply another component of the eye. There are no photoreceptors where the optic nerve enters the eye, which creates a blind spot. Near the blind spot is the macula lutae, an area of about 3 mm2 over which the retina is especially thin. Within the macula lutae is the fovea centralis, a slight depression about 0.4 mm in diameter. The fovea is on the optical axis of the eye and is the area where the visual cones are concentrated to yield the greatest visual acuity. The retina contains two types of photoreceptors: rods and cones. Rods are distributed over the entire retina, except in the blind spot and the fovea centralis. The retina contains about 125 million rods, or about 105 mm−2. Active elements in the rods (and in the cones as well) are replenished throughout an individual’s lifetime. Rods have a low but variable threshold to light and respond to very low intensities of incident light. Vision under low illumination levels (e.g. night vision) is attributable almost entirely to the rods. Rods contain the light-sensitive pigment rhodopsin (visual purple), which undergoes a chemical reaction (the rhodopsin cycle) when exposed to visible light. Rhodopsin consists of a lipoprotein called opsin and a chromophore (a light-absorbing chemical compound called 11-cis-retinal) [6]. The chemical reaction begins with the breakdown of rhodopsin and ends with the recombination of the breakdown products back into rhodopsin. The recovery process takes 20–30 minutes, which is the time required to acclimatize to low levels of illumination (dark adaptation). The rods are maximally sensitive to light of about 510 nm, in the blue-green region of the visible spectrum. Rods cannot discriminate different wavelengths of light, and vision under low-illumination conditions is essentially colorblind. More than 100 rods are connected to each ganglion cell, and the brain cannot discriminate among these photoreceptors to identify the origin of an action potential transmitted along the ganglion. Hence, rod vision yields relatively low visual acuity, in combination with a high sensitivity to low levels of ambient light. The retina contains about 7 million cones, packed tightly in the fovea and diminishing rapidly across the macula lutae. The density of cones in the fovea is about 140 000 mm−2. Cones are maximally sensitive to light of about 550 nm, in the yellow-green region of the visible spectrum. Cones are much less sensitive than rods to light (1/104), but in the fovea, there is a one-to-one correspondence between cones and ganglions, so the visual acuity is very high. Cones are responsible for color vision through mechanisms that are imperfectly understood at present. For two objects to be distinguished on the retina, light rays from the objects must define at least a minimum angle (the visual angle) as they pass through the optical center of the eye. The visual angle, expressed in units of minutes of arc, defines the visual acuity of the eye. An individual with excellent vision and who is functioning in ideal viewing conditions can achieve a visual angle of about 0.5 minutes of arc, which is close to the theoretical minimum defined by the packing density of cones on the retina [7]. The eye is extremely sensitive to small amounts of light. Although the cones do not respond to illumination levels below a threshold of about 0.001 candela/m2, the rods are much more sensitive and respond to just a few photons. For example, as few as 10 photons can generate a visual stimulus in an area of the retina where the rods are present at high concentration [8]. Differences in signal intensity that can just be detected by the human observer are known as just noticeable differences (JNDs). This concept applies to any type of signal, including light, that can be sensed by the observer. The smallest difference in signal that can be detected depends on the magnitude of the signal. For example, the brightness difference between one and two candles may be discernible, whereas the difference between 100 and 101 candles probably cannot be distinguished. This observation was quantified by the work of Ernst Heinrich Weber, who demonstrated that the JND is directly proportional to the intensity of the signal. This finding was quantified by Gustav Theodor Fechner as where I is the intensity of stimulus, dS is an increment of perception (termed a limen), and k is a scaling factor. The integral form of this expression is known as the Weber–Fechner law: The Weber–Fechner law is similar to the expression for the intensity of sound in decibels, and it provides a connection between the objective measurement of sound intensity and the subjective impression of loudness [9]. The contrast sensitivity of the human eye is dependent on the level of luminance in the scene. In general, higher contrast is needed to perceive objects or image features in low brightness conditions. A higher contrast is needed for features in the dark regions of an image compared to that in a bright region as shown in Figure 5.5 (the variable adaptation state curve). Furthermore, the contrast sensitivity of the human visual system changes depending on the scenery and the adaptation state of the eyes. If a scene contains a relatively uniform luminance (e.g. an average gray with small low-contrast features), the eye gets fully adapted to that luminance level performing optimally to discern contrast in that scene. If the average luminance of such a scene is changed, that forces the eyes to adapt to a newer luminance state, again providing optimum contrast perception. This condition where the eyes are fully and optimally adapted to a relatively uniform but changeable luminance level is the so-called variable adaptation state where contrast sensitivity is considered at its ideal maximum (Figure 5.5). Medical images, however, are highly nonuniform, offering a range of luminance values from dark to bright within a single scenery. In that situation, the eyes get adapted to an “average” luminance level representative of the overall brightness of the image. This condition is the so-called fixed adaptation state (Figure 5.5). The contrast sensitivity in that state is optimum at the representative “average” luminance to which the eyes are adapted but is notably degraded in the brighter and darker regions of the image. Figure 5.5 The sensitivity of the human visual system described in terms of contrast needed for differentiating a just noticeable difference (JND) in the image as a function of luminance. The two curves represent the response associated with variable adaptation state and the fixed adaptation state at 10 cd/m2. Given the uneven distribution of cones and rods in the retina, the human visual system has a very narrow angular range for high-fidelity vision. Defined by the high concentration of cones in the fovea, this narrow angular range is referred to as foveal vision. It subtends an angular range of about 1–2°. That corresponds to an area of 1–2 cm in diameter on the image when viewed from a typical viewing distance of 60 cm. The wide distribution of rods similarly defines the peripheral vision that spans an angular range of nearly 170°. This wide range includes the high-sensitivity peaks of the peripheral vision at about ±20° and the blind spot, a ∼5° zone of the visual field located about 17° nasally associated with the optical nerve and a lack of visual acuity (see Figure 5.6). Figure 5.6 Distribution of rods and cones in the retina informing the foveal and peripheral vision. Visual acuity describes the ability of an observer to extract detailed information from a small region of an image. In tests of visual acuity, high-contrast images are used to ensure that results are not compromised by the inability of the observer to distinguish subtle differences in brightness (density) in the image. Although visual acuity can be evaluated in several ways, the most common method is the use of the ubiquitous Snellen eye chart, which consists of rows of letters that diminish in size from top to bottom. Results of Snellen tests are often expressed as the ratio of the maximum distance that an observer can just see an object divided by the distance that most people can see the same object. A measure of visual acuity of 20/40 simply means that the individual barely sees letters at 20 ft that the average person would see at 40 ft. Radiological diagnosis is a more complex process than simply detecting visual signals in a relatively uniform background, but how these signals are recognized and interpreted and how this interpretation is woven into a radiological diagnosis are poorly understood phenomena. Several vision scientists have proposed that an experienced observer first looks quickly at an image and compares it with a template of remembered images that represent normal structures similar to those in the image. In effect, the observer performs a quick mental subtraction to leave only those items in the perceived image that differ from the normal template. These differences are then examined more closely, and decisions are made about their significance. If the observer decides that they are acceptable deviations from normal, they receive no further attention. However, if they are judged to be unusual, they are integrated into an interpretation of the image that reflects an abnormal condition in the patient. Thus, the interpretation of a medical image is believed to consist of four sequential steps [10]. The first two steps are primarily visual in nature while the latter two are more cognitive: This cognitive model of image perception is a tempting explanation of the way visual information is detected, recognized, and interpreted. However, several experiments with human observers suggest that it may be overly simplistic [11–14]. As noted earlier, the human visual system cannot instantly form a high-resolution picture of the visual scenery as the high-definition foveal vision has a very limited angular coverage of 1–2°. The only exception is when the displayed scene is limited to the fovea such as in retinal projection displays. In normal viewing, however, this limited angular extent necessitates the visual search process by which the high-resolution foveal vision is moved from place to place across the image being interpreted. Up to now, visual search studies have not revealed any a priori patterns that can be generalized across different individuals. However, the following conclusions have been drawn: Expertise plays a definite role in the interpretation process, echoing the fact that radiology education by and large involves development of interpretation expertise that provides for accurate medical image interpretation. Expertise is defined as the ability to efficiently use contextual knowledge toward accurate and consistent diagnosis. In the context of image interpretation, expertise is the ability to perform perceptual and cognitive analysis of image features to render the diagnosis accurately. The hallmarks of radiology expertise are a rich structured knowledge of normalcy and “perturbations,” an efficient hypothesis-driven search strategy, and the ability to generalize visual findings to idealized patterns. Any expertise has two components: computable and spontaneous (talent). The latter obviously cannot be gained, but the radiology education is focused on the former and is trusted on the fact that interpretation expertise can be gained by training and effort. Studies show that expertise can be gained by motivated effortful study, preferably supervised, and by sheer reading of cases: accuracy is shown to increase linearly with the logarithm of number of cases read (Figure 5.7). Figure 5.7 An example showing how interpretation accuracy in mammography is changed across different groups of radiologists with varying number of cases read per each group. Referencing the four perceptual steps noted above, different interpretation errors occur corresponding to the stage of interpretation. Errors are equally attributed to visual and cognitive elements. About half of the errors (55%) tend to be visual in nature, reflective of recognition errors. They come from the incompleteness of the visual search, influenced by perceptual as well as psychological factors. Among those, in about half of the cases (30%), the interpreter fails to look at the lesion location with high-resolution foveal vision. In the other half (25%), the interpreter does not fixate on the location for at least a dwell time of approximately 0.3 seconds (this time signature is somewhat task dependent). The other component of the errors is cognitive, reflective of decision errors. In about half of the cases of interpretation errors (45%), the interpreter’s fixation time is greater than approximately 0.3 seconds. In other words, the abnormality is duly visualized. However, the interpreter makes a decision-making error in recognizing its importance calling the case negative. In addition to the detection errors of the visual or cognitive nature, there are also classification errors, calling a nodule benign when it is malignant or calling a pneumonia atelectasis. These types of errors are less extensively studied. SOS is a psychophysical factor that influences the interpretation process. Its effect can be appreciated by recognizing the fact that medical image interpreters are tasked to identify a possible abnormality in an image or image set. Once an abnormality is found, there is a likelihood that the interpreter might overlook another abnormality in the image that might be more subtle (and even sometimes less subtle) in nature or otherwise not be indicated from the previous history. This effect is called SOS. To minimize this effect, the interpreter needs to exercise additional diligence to find any secondary abnormalities that might be present if one is already identified (Figures 5.8 and 5.9). Figure 5.8 An illustration of a phenomenon similar to satisfaction of search. Once the viewer recognizes the profile of the young lady (viewing from a posterior perspective), it takes additional diligence to see the overlapping side view of the old lady. Figure 5.9 An illustration of satisfaction of search in mammography. Bilateral MLO view mammogram in a 46-year-old woman demonstrates obvious segmental calcifications in the superior left breast. Biopsy confirmed the presence of locally advanced invasive ductal carcinoma and DCIS. Less obvious is the 1.2 cm mass in the right axilla that may be mistaken for an axillary lymph node and is somewhat concealed by an overlapping blood vessel. This mass was proven to represent a synchronous primary breast cancer of the right breast and was not a lymph node despite its location. Image quality can have a profound effect on the interpretation process. In that regard, three components of the image quality can be recognized: inherent attributes, presentation attributes, and anatomical noise. The inherent attributes of image quality include factors such as contrast, sharpness, and noise, as discussed in Chapter 3. Depending on the indication and the imaging modality, clinicians expect a certain level of image resolution and noise for confident interpretation. Additional levels of blur or noise (possibly because of image degradation processes or low exposure) is believed to lead to low accuracy, equivocal decisions, inconsistent decisions, or lack of efficiency to be able to reliably render a diagnosis. In addition to resolution and noise, the way an image is rendered via post-processing (see Chapter 3) and displayed can influence the image quality. Again, different modalities and indications have different norms in terms of what is clinically expected for a given interpretation. For example, mammograms are generally expected to be presented at a display contrast significantly higher than that for a chest radiograph. Deviation from that expectation can lead to interpretation error and variability. Finally, apart from the physical and rendition attributes, each medical image presents a variable anatomical or functional scenery, the complexity of which is a strong element of image quality. Abnormalities need to be found in the midst of very complex anatomical background with variable presentation from case to case. This attribute of image quality is sometimes referred to as anatomical noise. Anatomical noise can both mask an abnormality through camouflaging and create false abnormalities through confluence of overlapping normal anatomy (Figure 5.10). Figure 5.10 An example of the impact of anatomical noise on image quality. An identical lesion is embedded in six different anatomical chest radiography backgrounds against each one of which the lesion looks dramatically different. Various models have been developed to describe how observers detect visual signals in images. These models can be categorized into three approaches to understanding visual detection: signal-to-noise, computational, and signal–channel models. The signal-to-noise model describes the ability of an observer to detect simple visual signals embedded in a noisy background. Noise in the image (e.g. quantum mottle, extraneous structures, and receptor artifacts) is referred to as external noise [15]. The model characterizes an ideal observer who detects signals with a certain likelihood whenever their amplitude differs from background by some prescribed threshold, usually a multiplicative factor of 2–5. The inability of a real observer to detect visual signals as well as the ideal observer is said to be caused by internal noise in the real observer. Sources of internal noise include distraction of the observer, preconditioning of the observer by the presence or absence of signals in previously viewed images, reduced intrinsic sensitivity to visual signals in some observers, and a myriad of other possible causes. The performances of ideal and actual observers are compared in the margin for the simple case in which actual observers are asked to state whether a simple signal is present or absent in an image. The index of detectability on the ordinate (y-axis) is the inverse of the size of subtle lesions that can be detected with reasonable assurance. As shown in the illustration, the performance of the human observer usually falls short of that for the ideal observer. This difference may be due in part to selection by the human observer of a visual threshold different from that assumed for the ideal observer. It may also be caused by internal noise (unpredictability) in the observer. Wagner and Brown have suggested that the performance of an imaging system can be characterized quantitatively by describing the ability of an ideal observer to detect simple visual signals provided by the system [16]. They have proposed this approach for evaluation and comparison of imaging systems used in clinical radiology. The computational model of visual detection has evolved from experience in designing computer programs to extract information from images. The model proposes that the first step in detecting visual information involves the rapid identification of brightness (density) changes in the image, together with properties such as orientation, location, depth, and spatial frequency of these changes. This “primal sketch” of the image is obtained by a simple psychophysical reaction to the image without the use of a priori knowledge of the structure and function of the object represented in the image. That is, visual signals are extracted from the image without any assumptions about the nature of the image and the type of visual scene portrayed [17]. Initial applications of the computational model were promising; however, it has largely been revisited [18] by more current understanding of psychophysical properties of human vision as delineated below. In this model of visual detection, the human visual system is characterized as a series of parallel vision channels, with a specific frequency range of visual information assigned to each channel. Several studies suggest that the frequency range of each channel is on the order of ±1 octave of spatial frequency information and that the visual system as a whole functions essentially as a frequency analyzer [18–20]. Many different types of observer models have been devised, some based on achieving the best possible classification accuracy given the statistics of the image data (e.g. the Bayesian ideal observer), whereas other models attempt to be more anthropomorphic (e.g. mimic the human visual system). The models also differ in how much prior information they have about the size, shape, and locations of the signals to be detected and also the noise statistics of the images. This section will focus on the simplest situation, the signal-known-exactly (SKE) paradigm. In this paradigm, the observer knows the size, shape, contrast, and location of the signal to be detected. Given an image, the observer is tasked to decide if the signal is present or not. All observer models can be mathematically described as some operator that transforms the image data, g, into a scalar test statistic, λ, in a similar manner as described in the section on the receiver operating characteristic (ROC) analysis (see Chapter 3). Here, g is vector containing all the image pixels (i.e. for an N × N image or region of interest, g is an N2 × 1 vector). The model then compares λ to a threshold, τ, to make a final binary decision (if λ > τ, then the signal is present, otherwise the signal is absent). As such, observer models lend themselves to ROC analysis, and the area under the curve (AUC) of the observer model is often used as the final image quality figure of merit. Alternatively, consider the two distributions of the test statistic under signal-present and signal-absent conditions. Let Essentially, d′ is a scalar measure of the amount of separation (or overlap) between the decision variable’s distributions under each condition, normalized by the average variance of the distributions. Note that d′ is specific to the imaging task and to a given observer model. The most well-known observer model is the Bayesian ideal observer. This model uses all available statistical information about the image to make its decision. Specifically, the ideal observer uses the likelihood ratio, L(g), as its test statistic. This ratio compares two conditional probabilities: It can be shown that using the likelihood ratio (or any monotonic function thereof) maximizes the classification accuracy, and thus, the ideal observer represents the upper limit of detectability given the statistics of the images. However, to compute the test statistic for the ideal observer, one needs to know both the signal-present and signal-absent probability density functions. For real-world medical images, these high-dimensional functions are not known, can be difficult to empirically estimate, and are often highly nonlinear. Further, it has been shown that human observers are not ideal, and thus, the detection accuracy derived from the ideal observer will always outperform what would be expected of human observers. Traditionally, the ideal observer has been used in designing and optimizing the hardware/geometry of an imaging system in order to maximize the amount of information that is output by the imaging system. However, optimizing the clinical use of a system is better done with anthropomorphic observer models that better simulate the way humans perceive images. One such model, which has been shown to correlate strongly with human observers, is the non-prewhitening (NPW)-matched filter observer. This model belongs to a family of models known as linear observers, meaning that they form their test statistic as a linear combination of the image data with a vector of template weights. Using linear algebra/matrix multiplication notation, the test statistic, λ for linear observers is computed as the inner product of the template, ω, with the image data, g, over a image of N pixels, as Linear observer models differ in the template used, but all follow this equation to form their test statistic. The NPW observer uses the expected (i.e. average) difference between the signal-present and signal-absent images as its template, ωNPW = ∆g = E[gSP − gSA]. Here, gSP and gSA are random vectors representing the signal-present and signal-absent images, respectively, E[] is the expectation operator. The “NPW” part of the model refers to the fact that the model does not attempt to account for noise correlations. It turns out that for a linear shift invariant (LSI) system with wide-sense stationary noise statistics, the detectability index for a NPW model can be calculated in the spatial frequency domain as a function of the system noise power spectrum (NPS) and modulation transfer function (MTF) as where u and v are spatial frequencies in the x and y directions, respectively, and W(u, v) is the task function (i.e. the Fourier transform of the signal to be detected). This can be directly extended to higher dimensional images as well. The NPW observer model can be extended to include an eye filter, E(u, v), that describes the frequency response of the human visual system. This modified model observer is called the non-prewhitening matched filter with eye filter (NPWE) observer. The d′ for the NPWE observer is given as
Imaging Operation and Infrastructure
5.1 Introduction
5.2 Image Perception

5.2.1 Human Vision
5.2.1.1 Anatomy and Physiology of the Eye
5.2.1.2 Visual Contrast Sensitivity
5.2.1.3 Roles of Foveal and Peripheral Vision
5.2.2 Visual Acuity
5.2.3 Recognition and Interpretation of Visual Information
5.2.3.1 Visual Search
5.2.3.2 Role of Expertise
5.2.3.3 Nature of Interpretation Errors
5.2.3.4 Satisfaction of Search
5.2.3.5 Role of Image Quality
5.2.4 Modeling Image Interpretation
5.2.4.1 Signal-to-Noise Model
5.2.4.2 Computational Model
5.2.4.3 Signal–Channel Model
5.2.4.4 Observer Models
 ,
,  ,
,  , and
, and  be the means and variances of λ under signal-present and signal-absent conditions, respectively. Another common figure of merit is the detectability index (also called d-prime) d′, which is defined as
Related posts:
![]()
Stay updated, free articles. Join our Telegram channel


Full access? Get Clinical Tree


