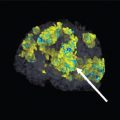
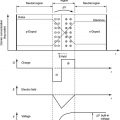
8 Although functional applications are gradually making their way into most imaging modalities, many of them are structural or anatomic in nature. Conversely, nuclear medicine is distinctly different in that all nuclear studies are functional or physiological. Nuclear medicine involves imaging γ-ray emitting radionuclides distributed within the body. Nuclear medicine instrumentation is used to image and/or quantify radiopharmaceutical uptake to infer certain physiological or molecular processes. Because of this, nuclear medicine studies are often referred to as molecular imaging. Most nuclear medicine studies require the use of a detector outside the body to measure the rate of accumulation, release, or distribution of radioactivity in a particular region inside the body. The rate of accumulation or release of radioactivity may be measured with one or more detectors positioned at fixed locations outside the body. Two-dimensional (2D) or three-dimensional (3D) images are then formed from the detector data, reflecting the distribution of the radioactive source inside the body. The signal source in nuclear medicine is radioactivity that is injected, inhaled, or ingested by the patient. The use of radioactivity requires a balance between the energy and amount of radioactivity administered, and the required imaging duration. The energy of γ-rays used in nuclear imaging need to be high enough so that the γ-rays have a reasonable probability to exit the body, yet low enough to enable its efficient and practical detection once outside of the body. These two considerations are held in balance in the design of the detector instrumentation and procedures. The majority of nuclear medicine procedures use γ-rays in the 100–511 keV energy range. These energies are equal to or greater than the highest values used for X-ray imaging systems with the highest energy, i.e. 511 keV, associated with positron emission imaging. The high energy absorption and timing requirement of positron imaging devices make them the most sophisticated of nuclear imaging sensors. The rate of signal detection from radiation exiting the body is significantly lower than that used in X-ray imaging. This is due to need to minimize the radiation dose to the patient from the internalized radioactivity, limiting the amount of radioactivity that can be used. In addition, the amount of time the radiation is in the body is governed by the radioactive decay of the radionuclide and biological elimination from the organs or regions of interest within the body. These processes are governed by the radionuclide decay half-life, t1/2 (see Chapter 1), and a calculated biological half-life, tb. The combination of these can be used to define an effective half-life, te, as the time the radionuclide is available for imaging. The effective half-life of a radionuclide in the organs or regions of interest within the body is given by Because of the use of a minimal amount of radioactivity to reduce the dose and the effective half-life of the radionuclide within the body, the overall duration of nuclear imaging exams is longer than most other imaging modalities. As in all imaging, a long acquisition time can extend the acquisition beyond being practical because of voluntary and involuntary motion. Although this is undesirable, in general, it offers nuclear imaging a unique advantage, i.e. the detection of photons is at a low-enough rate such that the photons can be individually counted as opposed to being integrated in nearly all other X-ray imaging modalities. This, in combination with the fact that the γ-rays are largely monoenergetic, makes energy-sensitive photon counting the routine detection process in nuclear imaging. This has several advantages, including an efficient elimination of scattered photons by the virtue of their energy being lower and readily distinguishable from the primary photons from the radionuclide being used. Nuclear medicine uses radionuclides as its source of signal. Radionuclides used in nuclear medicine are bound to chemical complexes, so they are delivered to a particular organ or tissue according to a specific physiological process. These radiolabeled chemical complexes are called radiopharmaceuticals. Radiopharmaceuticals are generally divided into multiple classes: those that emit photons primarily of one or multiple energies, those emitting beta rays (β−) or charged particles used in therapeutic applications, and those that emit positrons (β+). Radiopharmaceuticals that are labeled with radionuclides that decay with primarily a single photon emission tend to have half-lives on the order of hours to days. They are also higher atomic number nuclides that are not naturally found in the body and, as such, need to be bound to a carrier that will take it to the organ of interest. Nearly all radionuclides used in nuclear medicine are man-made. This is due to the fact that naturally occurring radioactivity either has very slow decays (i.e. long half-lives) inconsistent with the timing requirement of an imaging exam, rarely decay to stable radionuclides, have unfavorable chemical properties, or a combination of the above. There are four general methods to generate radionuclides for nuclear medicine (see Chapter 1). In the first method, the desired radionuclide is formed as a by-product of nuclear reactions within a fission reactor. The radionuclides are separated, purified, and processed for medical use. The most common radionuclide generated by this method is 99Mo, which is the parent to the most commonly used radionuclide, 99mTc, in nuclear imaging today. Other medically used radionuclides that are the by-products of nuclear reactions include 131I and 133Xe. The second method generates radionuclides through neutron activation, with a substance subjected to a neutron flux from a nuclear reactor. The reactions of either The last method of nuclear radionuclide formation is an on-site supply, through radionuclide generators. A generator is an apparatus that has a radioactive parent that decays to a progeny that is the desired radionuclide for imaging. The parent and progeny have half-lives that form secular or transient equilibrium (see Chapter 1). The progeny can be extracted from the parent providing a repeated supply of the progeny. This provides a convenient means for a facility to have ready access to certain radionuclides of interest without the issues associated with continuous radioactive shipments or the cost of maintaining a cyclotron. Radionuclides such as 99mTc, 68Ga, 82Rb, 87mSr, and 113mIn can be formed and supplied through radionuclide generators. 99mTc is the most common radionuclide used in nuclear medicine today. This is due to multiple factors, chief among them the widespread availability of 99mTc through the 99Mo to 99mTc generator. Further, 99mTc can be bound to a host of compounds and drugs. This radionuclide emits a γ-ray of 140 keV, an ideal energy for scintillation camera detection, with only slight contamination by particles and photons of undesired energies. In addition, 99mTc has a short half-life (i.e. six hours) permitting administration of large amounts of the radioactive material without excessive radiation doses to patients. Compared to 99mTc, positron-emitting radionuclides such as 15O, 13N, 11C, and 18F are of lower atomic number and are either components of compounds found in the body or as in the case of 18F can be readily substituted for elements of organic substances such as 18F-fluorodeoxyglucose (FDG), an analog of glucose. 18F-FDG is the most common positron-emitting radiopharmaceutical in use today, and because 18F has about a two-hour half-life it can be shipped from an external production site on the day of an exam. Although the positron-emitting isotopes 11C, 13N, and 15O also have significant physiological potential to replace atoms in molecules that are essential for metabolism, their very short half-lives (e.g. 2–20 minutes) require the production of these in a cyclotron that needs to be located in or near the imaging facility so that the nuclides can be used before they decay. Thus, the facilities and support personnel required for positron emission tomography (PET) imaging with these radionuclides requires a major financial investment. The availability of positron sources such as 68Ga that can be produced in radionuclide generators and advances in miniaturization and simplification of cyclotrons decreases site planning and facilities support requirements are stimulating the development of more clinical sites for PET imaging. Point measurement of radioactivity before the administration of the radiopharmaceutical is an essential component of the nuclear operation to ensure that a precise amount of prescribed activity is administrated. The measurements are made in a dose calibrator or well chamber (see Sections 8.2.1 and 8.2.3). Measuring the accumulation of radioactive iodine in the thyroid gland was the first routine clinical use of a radioactive nuclide. The rate of accumulation (i.e. uptake) of iodine in the thyroid gland may be estimated from the measurements of the radioactivity in the thyroid at specified times (usually 6 or 24 hours) after a selected amount of radioactive iodine (e.g. ∼10 MBq of 123I or 131I) has been administered orally. The radioactivity in the thyroid is usually measured with a single NaI(Tl) scintillation crystal called an uptake probe (see Section 8.2.4) positioned 20–30 cm in front of the patient and in line with the isthmus of the thyroid. Planar nuclear imaging is commonly deployed in a variety of applications where a single or double detector is placed as close as possible to the body part. 99mTc is the most common radionuclide used in planar imaging. Imaging time is typically in tens of minutes providing adequate signal-to-noise ratio to reveal the areas of concentrated activities. Common planar applications include imaging bones (e.g. for metastasis), cardiovascular, gastrointestinal (GI) systems, urinary system, and thyroid. Planar positron imaging is also used in the context of positron emission mammography (PEM) where the breast is imaged between two coincidence nuclear detectors. Nuclear imaging can be performed volumetrically through emission computed tomography. There are two such modalities in use today: single photon emission computed tomography (SPECT) and PET. The advantages for tomography were considered early on in nuclear medicine. David Kuhl and Roy Edwards developed a SPECT scanner in the early 1960s [1]. Gordon Brownell and his colleagues in Boston constructed a camera-based PET scanner also in the 1960s [2]. Both technologies continued to progress through the late 1980s along with CT and magnetic resonance (MR) imaging. By that time, practically, all gamma camera systems were capable of acquiring SPECT data. Clinical PET scanners were also being marketed, although it would be another 10 years before 18F FDG scans were routinely reimbursed for certain oncological applications leading to a more widespread clinical implementation of the technology. Since that time, emission tomography, both PET and SPECT, has become an essential component of medical imaging providing functional and molecular image data that complement the anatomical information provided by CT and MR. Both SPECT and PET, as with transmission tomography, rely on the reconstruction of projection data into a 3D representation of the object. The most important advantage provided by any tomography reconstruction is that it removes the ambiguity arising from the signal in overlying and underlying tissue around the features of interest. However, in SPECT and PET, the image consists of the spatial in vivo distribution of the administered radiopharmaceutical [1]. This allows the application of pharmacological and physiological models that can yield functional parameters such as regional blood flow and metabolism of a molecule at a specific receptor site. Alternatively, the values can be used to provide a quantitative value, such as the percent-injected dosage or the standard uptake value (SUV), offering unique applications such as myocardial perfusion and oncological staging. Nuclear medicine is also used as a therapeutic procedure where the radiopharmaceutical is used to target a tissue for treatment. Compounds that have strong affinity to malignancies are tagged to alpha or beta emitting radionuclides, and thus, the same distribution that is reflected in a γ-ray emitting version of the radiopharmaceutical becomes a distribution of radiotoxicity used in cancer therapy. One of the most common nuclear therapy procedures is the 131I therapy for thyroid cancer. Therapeutic procedures through radioactive monoclonal antibodies are also being used and continually under development. In another form of nuclear therapy, radiopharmaceuticals are not injected into the blood stream, rather small sealed sources are inserted into the tissue with the use of applicators or catheter-directed interventional procedures (e.g. radioembolization) [3]. The radionuclides used in nuclear medicine generally emit photons of discrete energies that are ideal for energy selective counting (vs. high-rate, polyenergetic X-ray imaging where energy-integrating sensors are used). A general purpose counting system is outlined in Figure 8.1, illustrating the components that are common to all nuclear counting systems. Below we provide a brief review of the counting system components specifically as they are applied in nuclear medicine; a more detailed review of the detector technology is in Chapter 1. Figure 8.1 Components of a general purpose counting system. The three most common types of radiation detectors used in nuclear medicine are gas detectors, semiconductors, and scintillators. Gas detectors consisting of ionization chambers and Geiger–Mueller detectors are used routinely for a variety of purposes in the nuclear medicine clinic. The dose calibrator is an ionization chamber operating in the current mode and is used for assaying vials and syringes typically containing radioactivity to be administered to patients. It has controls that allow the selection of specific radionuclides and can report levels of radioactivity from 300 kBq to 30 Gbq. The ionization survey meter also operates in current mode and is used to measure the exposure rate under certain radiation safety circumstances. For example, it is used to measure the exposure rate at 1 m from a patient who has been administered 131I for therapy or on the other side of a barrier separating the general public from an area used for the administration of radiopharmaceuticals. The Geiger–Mueller survey meter can detect small amounts of radioactivity. It cannot assess the exposure rate accurately or energy distribution of the radioactive source, so it is typically used for measuring potential radiopharmaceutical spills or personnel contamination. Semiconductor radiation detectors demonstrate superior energy resolution compared to other radiation detectors and thus have been used for decades to accurately measure the energy distribution from mixed radiation sources. This is particularly true for semiconductor detection materials such as lithium-drifted germanium (e.g. Ge(Li)) or high-purity germanium. One operational limitation for semiconductor detectors using materials such as Ge(Li) is that the energy gap between the valence and conduction bands in these devices is quite small, leading to response even in the absence of radiation. This “dark current” leads to the necessity for these devices to operate at cryogenic temperatures. This limitation has made it difficult to utilize this technology in a large field of view radioisotope imaging device. More recently, semiconductors based on cadmium telluride (CdTe) or cadmium zinc telluride (CZT) have been used for radiation detection and imaging in nuclear medicine. In these devices, the energy gap between the valence and conduction bands is larger allowing for operation at room temperature. As a result, the energy resolution for CdTe or CZT is not quite as good as that for Ge(Li), but it is still substantially better than that for most scintillator-based detectors. The most common detector used in nuclear medicine consists of a scintillator and a photomultiplier tube (PMT) in combination. The scintillator converts the energy emitted from the radioactive material into light. The photomultiplier tube converts the light into current and then amplifies the current over a series of dynodes. Scintillators can be solid or liquid and can be inorganic such as sodium iodide (NaI(Tl)) or organic such as anthracene. The most common scintillator used in nuclear medicine counting systems is NaI(Tl). The advantage of NaI(Tl) is that it can be easily machined, and it has excellent light output for fast electrons and γ-rays. Scintillation detectors used for PET include lutetium oxy-orthosilicate (LSO) and lutetium-yttrium oxyorthosilicate (LYSO). The use of scintillation radiation detection requires a method of detecting the light photons emitted subsequent to the detection event. For decades, the PMT has been the method of choice in this regard. A fraction of light photons striking the photocathode of the PMT will lead to electrons drifting toward the first dynode of the PMT. Each electron reaching the first dynode, in turn, will lead to a number of electrons drifting to the subsequent dynode. This continues for each dynode until the cascade of electrons reaches the anode of the tube. In typical PMTs, approximately, 106 electrons reach the anode for each electron reaching the first dynode. PMTs continue to be used regularly as they provide a relatively low-cost approach that has high gain and low noise. However, PMTs are large and have low detection efficiency as only about one in five photons striking the photocathode leads to an electron reaching the first dynode and the subsequent, amplified electrical pulse. Also, as hybrid imaging involving MR imaging continues to grow, PMTs cannot operate in a significant magnetic field as they rely on drifting electrons. Alternatives to PMTs for light collection include the use of photodiodes. Photodiodes are semiconductor devices that detect light and directly convert it to electrical signal. They have high detection efficiency (e.g. 60–80%) but little inherent amplification, and, as a result, electronic noise can be substantial when using this technology. As a result, a number of investigators and manufacturers have turned to the use of avalanche photodiodes (APDs). In these devices, the primary electrons lead to an electronic cascade similar to that in a proportional counter. The subsequent signal gains are on the order of 100–1000. Although this gain level is much less than the 106 provided by PMTs, it is still sufficient for gamma spectroscopy and imaging. APDs are compact and can operate in the magnetic field associated with a clinical MR scanner. The drawbacks to this technology include the relatively slow readout, which limits its use in time-of-flight (TOF) PET where timing is critical, and this technology is reasonably expensive when compared to PMTs. In the past decade or so, the technology referred to as silicon photomultiplier tubes (SiPMTs) has emerged. These devices consist of a large array of very small (e.g. 30 × 30 μm) APD channels. Typically, the SiPMT may consist of thousands of such APD channels where each channel operates in a YES/NO detection mode for light photons. In this way, each channel may be thought to operate similarly to a Geiger–Mueller detector where each detection is a YES with no useful information as to the magnitude of the interaction. The SiPMT signal is defined by the number of channels that interact. If there is a high light flux, more channels will be struck, leading to a higher signal. These devices provide high gain (e.g. ∼105), moderate detection efficiency (e.g. ∼40%, better than PMTs but still less than single APDs), and high-enough speed to be used within a TOF PET scanner. The specifications for a high-voltage supply for a counting system vary with the detector used. In a scintillation detector, the high-voltage supply provides the potential difference across the PMT or other light detection component. Conversely, the high voltage for a CZT or a gas detector provides the potential difference between the anode and cathode of the detector. The signal from a scintillation detector may vary by as much as 10% for a 1% change in high voltage. The stability of a high-voltage supply may be affected by changes in temperature, fluctuations in line voltage, or variations in the impedance (i.e. load) across the output terminals. The output current from the detector passes to a pream-plifier. Almost all radiation detectors exhibit low capacitance and high impedance. The purpose of the preamplifier is to match the high impedance of the detector to the low impedance of the connection leading to the amplifier. The preamplifier may also perform some pulse shaping to meet the specifications of the amplifier. A preamplifier is typically placed near the detector. This prevents the distortion and attenuation that can occur when the distance between the detector and the amplifier is large. After the signal is processed by the preamplifier, the connection to the amplifier may be several feet long. An amplifier is used to increase the size and vary the shape of signals from the detector and preamplifier. An amplifier may be either voltage sensitive or charge sensitive, depending on the type of signal received at the input terminal. The increase in signal size is described as the amplifier gain, which is the ratio of the height of the pulse leaving the amplifier to the size of the signal received at the input terminal of the amplifier. Depending on the type of detector and the characteristics of circuits in the counting system, an amplifier gain of 1000–10 000 may be required. The pulse furnished by a typical amplifier is shown in Figure 8.2. The pulse rise time (tr) is the time required for the pulse amplitude to increase from 10% to 90% of its maximum amplitude. The pulse decay time (td) is the time required for the pulse to decrease from maximum amplitude to 10% of maximum. The rise time of an amplifier should be less than the time required to collect the light produced during an interaction of a particle or photon in the detector. The pulse should be terminated rapidly to prevent the amplifier from summing successive pulses from the detector. The integration time of an amplifier is the time required to form an output pulse. The integration time is significantly less than 1 μs for amplifiers used with NaI(Tl) scintillation detectors, which have a decay time of about 0.23 μs. Figure 8.2 Pulse delivered by an amplifier. Amplitude may be either voltage or instantaneous current. Pulse rise time tr and pulse decay time td are shown. The integration time is a compromise between the time required for complete collection of a signal from the detector and the time when a significant number of successive pulses combine, which is known as pulse pile-up. Pulse pile-up, or count rate overloading, causes pulse-shape distortion by the delivery of pulses to the amplifier at too high an input rate when a new pulse is received before the complete resolution of the previous pulse. In addition, large input pulses or high rates of reception of input pulses may cause the characteristics of an amplifier to change. For example, output pulses may be distorted after a very large pulse has been received by the amplifier (e.g. a pulse produced by the interaction of a cosmic ray). This distortion of output pulses is termed pulse amplitude overloading. Pulse amplitude overloading and count rate overloading may severely distort the data displayed by the output device. The height of the pulse from the detector and amplifier is proportional to the energy deposited in the detector by a charged particle or an X- or γ-ray. Pulse-height analyzers are used to determine which signal from the amplifier will be recorded by the counting device. Analyzers that are set to record pulses in a single pulse-height range or channel are called single-channel analyzers (SCAs). Analyzers that sort each output into assigned channels according to their pulse heights are called multichannel analyzers (MCAs), and allow data to be recorded from several channels simultaneously. A typical series of pulses from an amplifier connected to a scintillation detector is seen in Figure 8.3. These pulses may be evaluated using a SCA to determine which pulses are in the desired pulse-height range and will be recorded. A SCA is also known as a differential discriminator. Two techniques, integral and differential sorting, are used for pulse-height analysis. Figure 8.3 Diagram of a series of voltage pulses impinging on discriminators V1 and V2 of a single-channel pulse-height analyzer. The height of each pulse reflects the energy deposited in the detector during the interaction of an incident photon or particle. For integral sorting, all pulses with a voltage greater than V1 would be counted. For differential sorting, pulses with height between V1 and V2 are counted. For integral sorting, pulses with height less than V1 are rejected, and for differential sorting, pulses with height greater than V2 and less than V1 are rejected. For integral sorting, a single discriminator in the pulse-height analyzer is set at an energy (voltage) level and all counts above that level are counted. This type of counter configuration is frequently used for counting wipe tests where there could be a variety of radionuclides present. The differential discriminator is set at voltage where the energy that produced the pulse is below the lowest energy expected. For instance, in a typical nuclear medicine department where 210Tl, 99mTc, and 131I are used, the integral discriminator in a well counter used for wipe tests would be set at 50 keV. As the energy of the photons produced by these radionuclides is above 50 keV, all events for each of these radionuclides would then be detected. An SCA used as a differential sorting system is composed of two discriminators connected to an anticoincidence circuit. The discriminators transmit pulses above a certain minimum size but are below a maximum size. In Figure 8.3, for example, the lower discriminator transmits pulses larger than size V1 to one terminal of the anticoincidence circuit. Pulses too small (less than V1) to be transmitted are rejected and are not transmitted to the anticoincidence circuit. Pulses large enough (greater than V2) are delivered simultaneously to both input terminals of the anticoincidence circuit. The anticoincidence circuit will only forward a pulse to the system when the pulse is received at only one input terminal. A pulse is not transmitted to the system for further processing when signals are received simultaneously at both input terminals. Consequently, the system registers only the number of pulses of size between V1 and V2. The range of pulse sizes registered by the system may be varied by changing the settings V1 and V2, i.e. the lower and upper discriminators. These settings may be labeled on the pulse-height analyzer as “lower discriminator” and “upper discriminator, “E1” and “E2,” or “lower level discriminator” and “upper level discriminator.” The settings are frequently calibrated so that they correspond to photon energy, and they may be labeled to define a lower and upper energy threshold that is used to define an “energy window” to be recorded. One may want to look at the entirety of the energy spectrum of a given radionuclide. This may be for the identification of an unknown or to be able to count multiple photopeaks simultaneously. To plot the pulse-height spectrum of a radionuclide using a single-channel pulse-height analyzer, counts are recorded for selected intervals of time while a narrow window of the analyzer is moved incrementally from the smallest to the largest pulse size encountered. This procedure results in a single plot of the pulse-height spectrum. This is useful if one wishes to identify the radionuclide of interest, but it cannot be used to count events for multiple windows. In addition, this procedure is time consuming. A SCA and a counting time of 1 minute per channel, more than 100 minutes, are required to sample a pulse-height distribution that is divided into 100 parts. With a 100-channel analyzer, the same data may be collected in less than one minute. MCAs used in nuclear medicine today typically have at least 1000 channels. In the MCA, a pulse from the amplifier is fed to an analog-to-digital converter (ADC). After a photon is detected, the event is assigned to a specific channel according to its pulse height and the current value in that channel is incremented. As a result, the number stored in each channel reflects the number of pulses of specific amplitude received during the counting period. These numbers can be displayed graphically as the pulse-height spectrum for the radionuclide (Figure 8.4). Figure 8.4 Pulse-height spectrum where the pulse x-axis is the pulse-height or energy and the y-axis is the number of events that occurred at that energy. The linearity of a pulse-height analyzer describes the relationship between the photopeak energy recorded in the pulse-height analyzer and the energy deposited in the detector. Modern pulse-height analyzers are typically linear over a wide range of radionuclides. As a result, the pulse-height spectrum is sometimes referred to as the energy spectrum. The pulse-height spectrum in nuclear imaging is directly related to the interaction of the γ-rays with the detector material (see Chapter 1). As the most common detector in nuclear medicine, the attenuation coefficients for photoelectric, Compton, and pair-production interactions of γ-rays in NaI(Tl) are plotted in Figure 8.5. For γ-rays with energy less than about 200 keV, photoelectric absorption is the most probable interaction in NaI(Tl). Compton scattering is the dominant interaction between about 200 keV and 7 MeV, and pair production is most important at energies greater than 7 MeV. Figure 8.5 Linear attenuation coefficients of NaI(Tl) for photoelectric absorption, Compton scattering, and pair production as a function of γ-ray energy. A γ-ray that interacts in a NaI(Tl) crystal may deposit part or all its energy in the crystal. The size of the resulting pulse from the photomultiplier tube coupled to the crystal is proportional to the energy deposited in the crystal by the γ-ray. The pulse-height spectrum that is recorded by a MCA for a radioactive source thus consists of peaks and valleys that reveal the energy of the γ-rays from the source. The spectrum also reflects interactions that occur before the photons reach the scintillation detector, interactions in the detector, and the operating characteristics of components of the counting system (e.g. electronic noise). The plot of the number of events recorded vs. the energy from a given radionuclide using a MCA is the pulse-height spectrum (Figure 8.6). As can be seen in Figure 8.6, the components of this energy spectrum include the photopeak, peaks relative to Compton interactions within the scintillation crystal and other interactions [4]. Figure 8.6 Pulse-height spectra obtained for 137Cs in a well counter. The emissions from 137Cs are a 662 keV γ-ray and approximately 30 keV barium (Ba) X-rays. A photopeak on a pulse-height spectrum involves pulses produced by total absorption of γ-rays of a particular energy in the scintillation crystal. The energy of the γ-ray may have been deposited in the crystal during one interaction or a series of interactions. The photofraction or peak-to-total ratio for a photopeak is the area enclosed within the photopeak divided by the total area enclosed within the pulse-height spectrum. The intrinsic peak efficiency is the fraction of the γ-rays of a particular energy impinging upon a detector that produces pulses enclosed within the photopeak. The energy resolution of a pulse-height spectrum is often parameterized as the full width at half-maximum (FWHM) of the photopeak and reported as the percent of the photopeak energy (Figure 8.7). The FWHM is a function of the amount of energy deposited in the detector. The more energy deposited per γ-ray, the greater the number of light photons produced. This in turn will produce more electrons at the photocathode and less relative variability. For example, the energy resolution for 99mTc (140 keV γ-ray) in a NaI(Tl) detector is about 10%, whereas the energy resolution for 137Cs (662 keV γ-ray) is about 7%. The improvement in energy resolution for 137Cs is a result of more energy being deposited in the detector-incident γ-ray. Figure 8.7 The energy resolution is measured as the full-width at half maximum of the photopeak. Compton interactions of incident γ-rays in a NaI(Tl) crystal, with the escape of the scattered photons from the crystal, result in the formation of pulses smaller than those enclosed within a photopeak. The valley just below a photopeak is referred to as the Compton valley (see Figure 8.6). The Compton edge is the portion of the pulse-height spectrum just below the Compton valley where the height of the spectrum increases rapidly. The portion of the pulse-height spectrum below the Compton edge is termed the Compton plateau. The relative heights of the photopeak and the Compton edge vary with the energy of the incident photon and the size of the NaI(Tl) crystal. In a larger crystal, more scattered photons interact before they escape from the crystal. Hence, the height of the photopeak is increased and the height of the Compton plateau is reduced. If a photon with energy greater than 200 keV is scattered at a wide angle during a Compton interaction, then the scattered photon has an energy of about 200 keV irrespective of the energy of the primary γ-ray. For this reason, photons scattered at wide angles during Compton interactions in the detector shield produce a peak at about 200 keV on the pulse-height spectrum. This peak is referred to as the backscatter peak. A γ-ray that interacts photoelectrically in a NaI(Tl) crystal usually ejects an electron from the K shell of iodine. As the vacancy left by the photoelectron is filled by an electron from the L shell, a characteristic X-ray is released with an energy equal to the difference (i.e. 28 keV) in the binding energy of L and K electrons in iodine. If the 28 keV X-ray interacts in the scintillation crystal, then the light released during this interaction would appear 28 keV below the photopeak. This peak is referred to as an X-ray escape peak. X-ray escape peaks are not observed for γ-rays with energy greater than about 200 keV because the lateral spread of the photopeak for photons of higher energy obscures the presence of the X-ray escape peak. Also, characteristic X-rays released during the interactions of higher energy γ-rays have a lower probability of escape from the crystal because more energetic γ-rays tend to penetrate farther into the crystal before interacting. As noted in Chapter 1, the detection efficiency is defined as the number of events recorded by a detector divided by the number of charged particles or high-energy photons (X- or γ-rays) emitted by the radiation source. In nuclear medicine detectors the detection of high-energy photons is of most interest and is dependent on the detector material, size of the detector, source to detector configuration, and the recorded fraction of the pulse-height spectrum. The detection efficiency can thus be calculated as where Ei is the intrinsic efficiency of the detector, Eg is its geometric efficiency, and f is the fraction of the signal that is within the photopeak. The intrinsic efficiency is the fraction of the radiations striking the detector that are detected. It is dependent on the thickness and composition of the detector as well as the energy of the photon interacting in the detector. For photons on the central axis of the detector, the intrinsic efficiency Ei equals 1 − e−μ(E)⋅x, where μ(E) is the linear attenuation coefficient for photons of energy E and x is the thickness of the detector. The geometric efficiency is the fraction of the radiations emitted by the source that strike the detector and is determined by the area of an isotropic sphere of radioactivity that is covered by the detector. For a detector that is small in relation to the sphere of radioactivity, the geometric efficiency Eg is given by a/4πr2, where a is the area of the detector and 4πr2 is the surface area of the isotropic sphere of radiation at distance r from the radioactive source. Figure 8.8 shows the geometric relationship for a detector–source combination for the instance where the detector is small in relation to the surface area of the isotropic sphere of radiation and for well counter. At distances where the size of the detector is comparable or larger than the distance, the geometric efficiency is estimated by Eg = ½(1 + cos θ). Figure 8.8 Geometric efficiency (Eg) for different detector configurations. (a) A normal imaging system detector in relationship to an isotropic sphere of radioactivity from a source. For example, a 50 cm × 40 cm gamma camera and a source distance of 20 cm results in Eg = 0.4. (b) The geometry for a well counter where the source is placed inside. In a well counter, there is only one region where the radiation does not intersect the detector (i.e. entrance to well). If it is assumed that the angle of the entrance is 30°, the resulting Eg = 0.93. The photopeak fraction, f, is the fraction of events detected that are actually counted. Where a pulse-height analyzer is used in conjunction with energy-selective counting, not all the events that interact in the detector are counted. This reduces the detection efficiency. When energy-selective counting is not used, i.e. all events that interact in the detector are counted, the photopeak fraction is equal to one. Counting systems used for the measurement of radiation in vitro and in vivo in nuclear medicine without the generation of images are the well counter and uptake probe. Both instruments consist of a NaI(Tl) detector interfaced to a PMT, preamplifier, amplifier, and a SCA or MCA. The well counter is a cylindrical NaI(Tl) detector with a well in the center (Figure 8.9) that is used for counting biological samples and for wipe tests. The typical well crystal has a diameter of 4.5 cm and a length of 5 cm, surrounding a well of 1.6 cm diameter and 3.8 cm length. For a sample that is in the bottom of the well, the geometric efficiency for the well counter is greater than 90% (see Figure 8.7). The intrinsic efficiency is more difficult to estimate because of the variable paths the photons will take through the crystal. For energies less than 150 keV, the overall efficiency for a well counter is close to 100%. Figure 8.9 A well counter uptake probe. The well counter, labeled “A,” is used for counting small activity (<1 μCi) such as contamination wipe tests and biological samples. The uptake probe, labeled “B,” is used for measuring the radioactivity in small organs such as the thyroid. The uptake probe consists of a NaI(Tl) crystal that is typically 5 cm in diameter and 5 cm thick. It is used for the in vivo measurement of radioactivity. Although historically it has been used to measure tracer concentrations in various organs such as the kidney and spleen, it is used today almost exclusively for the measurement of the uptake of radioactivity in the thyroid. The uptake probe has a long cylindrical collimator to minimize radiation from locations outside the area of interest to reach the crystal and to ensure that successive counts of radioactivity are made with the same geometry. The scintillation (gamma) camera is the most common piece of equipment used in nuclear medicine. This piece of equipment allows for the acquisition of 2D images of the distribution of radioactivity within a patient, whereas gamma cameras may have one, two, or three scintillation detectors, by far the most common configuration is the dual-detector design. These cameras have two detectors that are generally in a 180° opposed detector configuration but can be reconfigured into the 90° relative angle configuration (Figure 8.10) that is used for cardiac SPECT. These cameras consist of four components: collimator, detector, signal-processing electronics, and a computer that controls the acquisition parameters and stores the acquired data. Figure 8.10 SPECT camera with the heads oriented at 180° opposed position that is used for acquiring images over 360° and at 90° relative angle that is used specifically for cardiac imaging where the heads rotate only over 180°. The scintillation detector in a gamma camera is typically rectangular with dimensions of about 50 cm by 40 cm. The crystal of the scintillation detector is commonly made of NaI(Tl) and is typically 9.5–12.7 mm thick. Other types of crystals have been used, but NaI(Tl) has been found to be ideal in terms of the light produced by photon interactions. The downside with NaI(Tl) is that it is hygroscopic and relatively fragile. Therefore, the crystal is maintained in a container that is hermetically sealed to eliminate the possibility of exposure to water. The crystal is enclosed in aluminum on three sides and the fourth surface is glass. The inside of the aluminum is coated with a reflective material to improve the collection of light. Attached to the glass surface of the detector are the PMTs. The PMTs will convert the light emitted from the crystal to a current that will then be passed to the processing electronics. PMT sizes are approximately 5 cm in diameter and cameras will use from 30 to 100 PMTs. The PMTs are surrounded by a magnetic shield (i.e. mu-metal) to prevent any interference in the detection and amplification of the signal from the earth’s magnetic field as well as any other magnetic field sources (e.g. MR systems). Without this shielding, even the small changes in the earth’s magnetic field as the camera position is changed can produce large changes in the function of PMTs. As the size of each PMT can be 5 cm, without any processing provision, no photon interaction can be localized within the crystal with a resolution better than 5 cm. Thus, a position coding method is used to more accurately define where a radiation event is occurred within the scintillator crystal. Position coding for events detected in the crystal is done by determining the weighted sum of the amount of light received by each PMT (see Figure 8.11). The collection of light by a single PMT is greater when an event happens directly under or near the PMT, but the light emitted is also “seen” by several PMTs surrounding the event. Using the amount of light received by each PMT, the location of the radiation event within the crystal can be estimated more precisely than afforded by the PMT size alone. Figure 8.11 Representation of a radiation event within a scintillator crystal and the recorded signals in the surrounding PMTs. When a source is moved from the edge of a PMT to the center, the light collected by the PMT increases in a nonlinear manner with the distance the source is moved. This causes the appearance of each PMT in the image when the detector is exposed to a uniform source of radioactivity requiring correction for these nonlinearities (see Section 8.3.3). In addition to localization, summing the signal from all PMTs provides the estimate of the energy deposited by the incident radiation. However, this can also be nonlinear and is spatially varying as well. Consequently, corrections also need to be applied to this energy signal. When working properly, the scintillation camera can localize a detection event to within 3–4 mm referred to as the intrinsic spatial resolution of the device. Cameras that use many small scintillators have been available for many years. These cameras were historically used for data acquisitions where high count rates are required such as first-pass cardiac studies. More recently, small pixelated detectors have been developed for breast imaging where the detector size and configuration are similar to mammography. These cameras have the advantage that they are generally not count rate limited and can be positioned more easily where the size of a typical scintillation camera would be too cumbersome. The disadvantage is that the reduced size makes applications for which they can be used limited. Nuclear cameras that employ solid-state detectors are readily available for many applications. CZT detector elements are currently used in molecular breast and cardiac imaging systems, and one manufacturer recently introduced a CZT-based, dual-head SPECT camera. The advantages of the CZT detectors are that they have a smaller pixel size (∼1.6 to 2.5 mm). The pixels are arranged in a 16 × 16 pixel grid, and the grid is attached to an application-specific integrated circuit (ASIC). The CZT detector has better intrinsic efficiency, and the spatial resolution is determined by the detector size. In addition, the energy resolution for current CZT detectors is about 5–6% in terms of FWHM. This improved energy resolution has the potential for better scatter rejection and leaves open the possibility of dual-isotope imaging with radionuclides that are close in energy such as 99mTc and 123I. To produce an image of the distribution of radioactivity in a patient, the sites of absorption of γ-rays in the scintillation camera crystal must be related clearly to the origin of the γ-rays within the patient. This requires the use of a collimator to define the angular sensitivity of the camera. Unlike in X-ray imaging where collimators are used to reduce scatter radiation reaching the detector, in gamma camera imaging the collimators enable spatial registration of where the radioactivity is positioned in the patient. The cross section and characteristics of several collimators used with gamma cameras are shown in Figure 8.12. Figure 8.12 Different types of collimators used in gamma camera systems. The most commonly used collimator is the parallel-hole collimator. This collimator is composed of small, straight cylindrical holes separated by lead or tungsten septa. A γ-ray moving from the patient toward the crystal in a direction in line with one of the collimator holes can easily pass through the hole and interact in the crystal. However, a γ-ray emerging obliquely must traverse one or more of the lead septa in the collimator before reaching the crystal. Hence, γ-rays emitted obliquely have a much lower probability of reaching the detector. By this mechanism, γ-rays interacting in the crystal can be related spatially to their origin for discrete volumes of tissue directly in front of the collimator. Parallel-hole collimators are described by the hole diameter, the septal thickness, and the hole length or collimator thickness. The septa are designed to limit the potential of photons traversing to the next hole to 1–5%. Parallel-hole collimators are named by the resolution and the energy that they are optimal for imaging. A collimator with many holes of small diameter is termed a high-resolution collimator. A collimator with fewer holes of larger diameter, or with shorter lengths of the same diameter, allows more photons to reach the crystal and is termed a high-sensitivity collimator. Relatively thin septa are used in low-energy collimators designed for use with radionuclides emitting low-energy photons (e.g. less than 160 keV). Thicker septa holes are required for collimators used with nuclides emitting higher energy photons. In the selection of collimators, there is typically a trade-off between sensitivity and resolution because collimators always reduce the amount of radiation that passes through them. For parallel-hole collimators, a gain in sensitivity is always accompanied by a loss of resolution and vice versa. The spatial resolution of a parallel-hole collimator is best at the surface of the collimator. As the distance is increased between the face of the collimator and the patient, the resolution decreases because each open cylinder in the collimator views a larger cross-sectional area of the patient. Although resolution decreases with the distance the patient is from the collimator, the sensitivity does not change significantly with the distance for a parallel-hole collimator. This is because although the number of photons collected by each collimator hole from a unit area of the patient decreases with the square of the collimator–object distance (i.e. inverse square law), the number of holes that view the source increases as the square of the distance. These two influences cancel each other so that the sensitivity does not change appreciably with alternations in the collimator–patient distance when using parallel-hole collimators. Other types of collimators used, occasionally with scintillation cameras, include the pinhole-, diverging-, and converging-type collimators (see Figure 8.12). The pinhole collimator consists of a pinhole aperture in a lead or tungsten absorber. The pinhole apertures range in size from 2 to 8 mm. Pinhole collimators are used primarily to obtain high-resolution images of small organs (e.g. the thyroid) that can be positioned near the pinhole. The major disadvantage of the pinhole collimator is its low sensitivity as only a few of the photons emitted by the object penetrate the single hole and are collected to form an image. The diverging collimator permits the scintillation camera to image anatomic regions larger than the dimensions of the crystal. Because of the large crystals available with modern scintillation cameras, (e.g. 40 cm × 50 cm), diverging collimators are no longer used and are mentioned here for historical purposes only. The fan beam collimator is a type of converging collimator that only converges in the X-direction, whereas the holes are parallel in the y direction. This collimator is used for SPECT imaging. The advantage to this design is that the projection data are magnified in the X-direction, thus improving the sensitivity by an amount proportional to the amount of magnification. In addition, the resolution is improved because the object is projected over the entire crystal face rather than onto a limited region of the crystal. Hence, it is possible to have improved sensitivity when compared to a parallel-hole collimator with the same resolution. As noted earlier, the scintillator camera has a nonuniform response requiring signal correction. Early scintillation cameras had light pipes between the crystal and the PMTs to correct for the nonlinear positioning response of the PMTs. The light pipe spreads the light generated in the crystal so that it is detected by more photomultiplier tubes, thus improving the uniformity of the image. Newer methods have been developed to correct for the nonlinear response of the detector with respect to energy, position, and uniformity, all of which are particularly important for SPECT. Each photon that interacts in a crystal produces light that is proportional to the energy deposited in the crystal. However, when these events happen directly under a PMT, more of the light reaches the photocathode than when the event happens between the PMTs. Thus, for example, for a 140 keV photon of 99mTc that interacts directly under a PMT, the resultant photopeak will be at 140 keV. When the photon interacts between PMTs, some of the light is lost and the photopeak registers at slightly less than 140 keV. The energy correction calibration generates a map of photopeak energies and shifts the energy of events based on the position to align the photopeak. Figure 8.13 shows a detector exposed to a uniform source of activity before and after energy correction. The energy resolution from this correction is improved from about 13% to about 10%, thus improving the overall performance of the camera. The image in Figure 8.13b still has extensive nonuniformity because the spatial linearity has not been corrected. Figure 8.13 Images obtained by a gamma camera from a uniform source of activity before and after corrections to the image have been applied. (a) No corrections, (b) energy correction applied, (c) energy and linearity corrections applied, and (d) uniformity correction applied (after energy and linearity corrections were applied). The nonlinear positioning response of the detector was described previously. To correct for this, a lead or tungsten plate with regularly spaced holes is placed on the uncollimated detector. The calibration plate is then exposed to a uniform source of radioactivity, and an image of the orthogonal hole pattern is acquired. A computer algorithm is then used to align the data so that the holes in the image correspond to their actual location. The shift required to place the holes in the correct location is stored and applied to all data acquired with the camera. Corrections of positions between the holes are generated by interpolation. As can be seen in the uniform flood image acquired before and after linearity correction (Figure 8.13b,c), the appearance of photomultiplier tubes has disappeared, and the image looks relatively uniform. The older cameras that made use of a thick light pipe had an intrinsic resolution of 5 mm or greater. Newer cameras that only have a relatively thin piece of glass between the crystal and the PMTs but make use of linearity correction have an intrinsic resolution of about 3–4 mm. The final correction applied to scintillation cameras is uniformity correction. This correction is used to remove the residual nonuniformities in the detector that remain after the energy and linearity corrections are applied. This correction is primarily required for SPECT imaging, but as almost all scintillation cameras used today are capable of performing SPECT acquisitions this is a routine calibration performed on all scintillation cameras. The National Electrical Manufacturers Association defines a method for evaluating uniformity [5]. This is performed by exposing a detector to a uniform source of activity and acquiring an image where each pixel has a relative error of 1%. After uniformity calibration is accomplished the efficacy of the correction should be reevaluated using the National Electrical Manufacturers Association methodology. Figure 8.13d is a flood image that has the energy, linearity, and uniformity corrections applied. The approaches used to reconstruct emission tomography studies are similar to those used in other modalities (see Chapter 3), particularly those of transmission computed tomography, i.e. CT (see Chapter 7). In first-generation CT systems, an X-ray tube was located on one side of the patient and a detector on the opposite side (see Figure 8.14). As the tube emitted X-rays, the detector would collect data for a set amount of time. The data at each point comprised a “ray sum” of detected X-rays along that ray. When this was complete, the tube/detector assembly would translate to the next position and collect another ray sum of data. Once the entire object had been “scanned” at this specific angle, the assembly would rotate to the next angle and a second set of collections would commence. This would continue until the assembly had rotated over 180°, i.e. half way around the patient. Each collection of ray sums across the patient at a particular angle is referred to as a “projection” acquired at that particular scan angle. For a given slice, the complete collection of CT data comprised the collection of projections acquired at each scan angle, typically over a 180° arc about the patient. Figure 8.14 The generation of projections in medical imaging. (a) First-generation CT geometry, (b) single-detector SPECT geometry, and (c) PET geometry. The same is true for emission data except the ray sum represents the total number of γ-rays acquired along a certain “ray” or line through the patient. In SPECT, using a gamma camera with parallel-hole collimation, the counts detected at a particular locus along the projection are assumed to have come from the ray intersecting normally at that point (see Figure 8.14b). This is an over-simplification of the gamma camera detection process as it does not take into consideration γ-ray scattering or the limited spatial resolution associated with the device. However, as we will see, it still can provide a reasonable result, at least to first order. For PET, the two annihilation photons are detected by two detectors in coincidence on either side of the patient. The line connecting the two detectors is called the line of response (LOR). The ray sum consists of the collection of coincidence detection events between those two detectors along the LOR (see Figure 8.14c). The schemes above described the collection of projection data into parallel rays. In many instances, it is more efficient to collect the data into fan or cone beams (see Figure 8.15). In the case of a fan beam, the acquired ray sum data converge at a single point within one collection plane. As a result, the collection of rays can be represented as a fan emanating from the point of convergence (see Figure 8.15b). This allows for more efficient data acquisition within the reconstruction plane while still providing plane-by-plane reconstruction, which is substantially simpler than 3D reconstruction algorithms. Figure 8.15 Acquisition of projections for tomographic reconstruction. (a) Parallel beam, (b) fan beam, and (c) cone beam. There are substantial advantages to acquiring data across planes from both an efficiency and instrumentation point of view. In these instances, the data may be acquired in a cone beam configuration (see Figure 8.15c). As will be discussed, PET and SPECT studies are routinely acquired using parallel, fan, or cone beams depending on the collimation and choice of reconstruction algorithm. Filtered back projection is a foundational process in nuclear imaging reconstruction. As noted in Chapter 3, the application of the ramp filter in filtered back projection (FBP) can lead to a “ringing artifact” and excessive noise, necessitating additional windowing filters. This is particularly the case in nuclear medicine imaging, which uses a number of different windowing functions including the Butterworth, Hanning, Hamming, and Shepp-Logan filters. The frequency values to use to initiate the roll back of the ramp filter to zero can be manipulated by defining the cutoff frequency of the windowing function. Using low-frequency cutoff filters will typically lead to lower noise but may also blur detail in the reconstructed image. Conversely, using high-frequency cutoff filters will retain spatial resolution and high detail but will amplify the noise content in the image. The selection of the proper cutoff frequency to be applied depends on the signal detail and noise content in the underlying projection data. For example, some studies may routinely have a lot of counts and require the retention of spatial resolution, and a higher frequency cutoff filter would be appropriate while other studies may routinely have lower counts and thereby more noise in the projection data, and high spatial resolution may not be as essential and, in these case, a lower frequency cutoff filter might be most appropriate. User preference may also be considered as some clinicians prefer a sharp image that may be a bit noisy while others prefer a smooth, less noisy image. Figure 8.16 shows the same SPECT brain scan reconstructed with the same filter but with a variety of cutoff frequencies. The images using the 0.1 and 0.5 cycles per pixel cutoff frequencies are too blurry and too noisy, respectively. In this example, the image using the 0.2 cutoff may be close to optimal for most uses. Figure 8.16 Reconstruction of a brain SPECT using filtered back projection and a Butterworth filter with varying cutoff frequencies of 0.1, 0.2, 0.3, and 0.5 cycles per pixel. Some windowing filters, such as the Butterworth, also have a parameter that affects the shape of the filtering function. In the case of the Butterworth filter, this is referred to as the “order.” Filtered back projection is referred to mathematically as a linear process, and thereby, the order in which the reconstruction steps occur can be altered while yielding the same result. Thus, the projection data can be prefiltered with the windowed ramp filter and then reconstructed with simple back projection. In most instances, a 3D filter may be applied that also filters across as well as within transverse planes. Because of notable developments and faster computers, iterative and statistical reconstructions have mostly replaced the use of filtered back projection in SPECT and PET. A detailed description of these methods is provided in Chapter 3. A common method used for iterative reconstruction in emission tomography is the maximum likelihood expectation maximization (MLEM) algorithm [6]. This method seeks to reconstruct the object “most likely” in a statistical sense to have resulted in the acquired projections. The algorithm is represented in the following equation:
Nuclear Medicine
8.1 Introduction

8.1.1 Radionuclides
 or
or  form unstable progenies that are purified and processed for medical use. This method generally produces radionuclides that lie above the line of radioactive stability and generally decaying by β− decay. As such, the products are of limited use for imaging purposes. Further, the method has a low yield as many target nuclei do not get activated. Nonetheless, the method is used to produce useful radionuclides including 14C, 24Na, 32P, 51Cr, 125I, and even 99Mo. The third method to produce radionuclides is through bombarding stable nuclei with charged particle accelerators. The most common accelerators are cyclotrons, where protons, deuterium, or alpha particles are accelerated to bombard stable nuclei to form a variety of radioactive atoms. These include many γ-ray emitters as well as β+ emitters with a high production yield, e.g. 67Ga, 111In, 127Xe, 201Tl, and positron emitters 11C, 13N, 15O, and 18F.
8.1.2 Nuclear Medicine Applications
8.1.2.1 Uptake and Point Measurements
8.1.2.2 Planar Imaging
8.1.2.3 Emission Computed Tomography
8.1.2.4 Nuclear Therapy
8.2 Counting Systems

8.2.1 Radiation Detectors
8.2.1.1 Light Detection
8.2.1.2 High-Voltage Supplies
8.2.1.3 Preamplifiers
8.2.1.4 Amplifiers

8.2.2 Pulse-Height Analyzers
8.2.2.1 Single-Channel Analyzers

8.2.2.2 Multichannel Analyzers (MCA)

8.2.2.3 The Pulse-height Spectrum


8.2.2.3.1 Photopeaks

8.2.2.3.2 Compton Valley, Edge, and Plateau
8.2.2.3.3 Backscatter Peak
8.2.2.3.4 X-ray Escape Peaks
8.2.3 Detection Efficiency


8.2.4 Well Counters and Uptake Probes

8.3 Principles of Scintillation Camera

8.3.1 Scintillation Detector
8.3.1.1 Gamma Camera Localization

8.3.1.2 Multiple-Crystal Scintillation Cameras
8.3.1.3 Multicrystal Solid-State Cameras
8.3.2 Collimators

8.3.3 Gamma Camera Corrections
8.3.3.1 Energy Correction

8.3.3.2 Linearity Correction
8.3.3.3 Uniformity Correction
8.4 Emission Computed Tomography
8.4.1 Tomographic Reconstruction


8.4.1.1 Filtered Back Projection

8.4.1.2 Iterative Reconstruction

Related posts:
![]()
Stay updated, free articles. Join our Telegram channel


Full access? Get Clinical Tree


