(3.1)
where ΔF/F is the fractional fluorescence signal per unit change in Vm and Φ is the number of detected photons per unit time (fluorescence intensity expressed as photon flux). This relationship is valid under the shot noise limited conditions fulfilled in most modern fluorescence measurements. Shot noise limited conditions imply that the noise arising from the statistical nature of the emission and detection of photons (shot noise) is the dominant source of noise in the recording system, while the following sources of noise are negligible: (a) the noise in the incident light intensity arising from an unstable light source (50 or 60 Hz and harmonic ripple noise and/or arc-wander noise); (b) noise caused by mechanical vibration of the image projected on the photodetector; (c) electrical noise in the amplifier circuits (dark-noise), and (d) read noise of the CCD camera (see also Chap. 1). Under these conditions, one way to increase the S/N for a given dye is to increase Φ by increasing either the incident light intensity or the detection efficiency, or both. An additional possibility is to increase ΔF/F per unit change in Vm (sensitivity of the dye). Thus, close attention must be paid to these two parameters.
The detected fluorescence photon flux Φ is a function of several parameters. These include: (a) the excitation light intensity; (b) the extinction coefficient of the dye absorption; (c) the quantum yield of a given dye (the efficiency of the fluorescence process defined as the ratio of the number of photons emitted to the number of photons absorbed); (d) the overall light throughput of the optical elements in the light path, including objectives, mirrors, auxiliary lenses and optical filters; (e) the quantum efficiency of the recording device (the ratio between electrons generated to the number of photons absorbed at the photoreactive surface). In addition to these factors that are usually constant for a given experiment, the photon flux will also depend on three additional variables: (f) the number of membrane-bound dye molecules in the light path which will be a function of the amount of staining and the membrane surface area projected onto individual pixels of the recording device; (g) the fraction of the fluorescent dye bound to the external membrane that changes potential and (h) the time interval over which photons are collected for each data point as determined by the imaging frame rate. Thus, the photon flux and S/N will decrease as the spatial and temporal resolutions are increased.
The voltage sensitivity of the dye, expressed as ΔF/F, depends on its chemical structure as described in Chap. 2. In addition, for a given dye, the voltage sensitivity is a function of the excitation wavelength, as demonstrated early in the development of organic probes (Cohen et al. 1974; Loew 1982). The sensitivity increases at extreme wings of the absorption spectrum for charge-shift voltage-sensitive probes. Also, the optimal sensitivity will be reached when all excitation occurs for the wavelength with the best response. In other words, monochromatic illumination at the appropriate wavelength (as opposed to the conventional use of a bandpass interference filter to select a range of wavelengths) will result in optimal sensitivity (Kuhn et al. 2004). These considerations argue that a laser emitting monochromatic light at an appropriate wavelength will be the optimal excitation light source. It should be noted that the advantages of laser illumination are more pronounced in fluorescent voltage-sensitive dye measurements since the loss of coherence introduced by fluorescence emission eliminates the speckle noise that plagues transmission (absorption) measurements using laser sources (Daintry 1984).
3 Foundation of Presently Available Recording Sensitivity
The feasibility of multiple site optical recording from individual nerve cells was initially demonstrated using invertebrate ganglia and monolayer neuronal culture and extracellular application of the voltage-sensitive dye (Salzberg et al. 1977, Grinvald et al. 1981). It was subsequently shown that sufficient sensitivity of recording with subcellular spatial resolution from intact parts of the nervous system can only be achieved if nerve cells are labeled selectively by the intracellular application of the membrane impermeant probe. This section reviews the limits to the sensitivity of recording using extracellular and intracellular application of the voltage-sensitive dyes.
3.1 Extracellular Application of Dyes
3.1.1 Dissociated Neurons in Culture
In 1981 Grinvald, Ross, and Farber demonstrated that voltage-sensitive dyes and multi-site optical measurements can be employed successfully to determine conduction velocity, space constants and regional variations in the electrical properties of neuronal processes in measurements from dissociated neurons in monolayer (Grinvald et al. 1981) culture. Both absorption and fluorescence measurements were used in these experiments and the individual dissociated neurons in a culture dish were stained from the extracellular side by bath application of the dye (Grinvald and Farber 1981). Typical optical recordings obtained from absorption and fluorescence measurements using the most sensitive probes available at the time are shown in Fig. 3.1. It has also been possible, using the same approach, to study synaptic interactions between several interconnected neurons in culture (Parsons et al. 1989, 1991), and the cell-to-cell propagation of the AP in patterned growth cardiac myocytes forming two-dimensional hearts in culture (Rohr and Salzberg 1994). The monolayer neuronal culture is a low opacity system especially convenient for the extracellular selective staining of the outside cellular membrane as well as for both absorption and fluorescence measurements. However, primary cultures are networks of neurons that grow under artificial conditions and are substantially different from intact neuronal networks. Therefore, a number of important questions in cellular neurophysiology can only be studied in intact or semi-intact preparations.
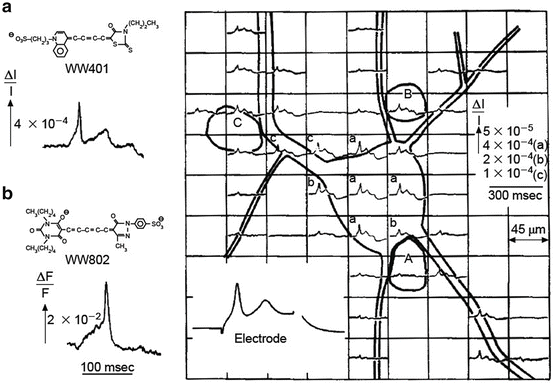

Fig. 3.1
Transmission (a) and fluorescence (b) signals recorded with a single photodiode from extracellularly stained neuroblastoma cells in culture. Multiple site recording using a photodiode array is shown on the right. Adapted from Grinvald et al. (1981)
3.1.2 Invertebrate Ganglia
Extending the same approach to in situ conditions has proven difficult and, hence, slow to develop. In in situ conditions, extracellular application of fluorescent dyes cannot provide single cell resolution because of the large background fluorescence from the dye bound indiscriminately to all membranes in the preparation. Thus, in the first attempt to investigate regional electrical properties of individual neurons in situ, in the barnacle supraesophageal ganglion, (Ross and Krauthamer 1984) transmission (absorption) measurements were used and, as in the experiments on neurons in culture, bath applied voltage-sensitive dyes to record optical signals from processes of individual nerve cells. Because the S/N of these measurements was not nearly as good as in recordings from monolayer culture, extensive averaging (approximately 300 trials) was required to obtain signals from processes of single neurons. The relatively small signal size which requires extensive averaging limits the utility of this approach for studying synaptic interactions and plasticity. Also, when many neurons are active in a densely packed neuropile it is difficult to determine the source of the signal if all the cells and processes are stained by extracellular dye application (Konnerth et al. 1987). Thus, the prospect for using measurement of voltage-sensitive dye absorption or fluorescence with extracellular staining is limited, and no further experiments requiring subcellular resolution have been reported using this type of staining. The limits to the sensitivity in these measurements were determined primarily by: (a) the relatively low voltage sensitivity of the available dyes; and, (b) the large background light intensity inherent to both absorption and fluorescence measurements with extracellular application of the dye, which translates into low fractional change in light intensity (ΔI/I) related to Vm transients (Waggoner and Grinvald 1977).
3.2 Intracellular Application of Dyes
3.2.1 Invertebrate Ganglia
A different approach to optical analysis of electrical events in the processes of individual nerve cells is to stain particular neurons in situ selectively by intracellular application of an impermeant fluorescent voltage-sensitive dye. This approach is based on pioneering measurements, carried out on the giant axon of the squid, which demonstrated that optical signals may be obtained when the dye is applied from the inside (Davila et al. 1974; Cohen et al. 1974; Salzberg 1978; Gupta et al. 1981). In these experiments, optical signals were obtained from the large membrane surface area of the giant axon. Additional efforts were required to demonstrate that the same approach is feasible at the spatial scale of normal size neurons and their processes. The initial experiments using intracellular application of the voltage-sensitive dyes were carried out by Obaid, Shimizu and Salzberg (Obaid et al. 1982) and by Grinvald, Salzberg, Lev-Ram and Hildesheim (Grinvald et al. 1987) on leech neurons. The results demonstrated the essential advantages of using intracellular application of fluorescent potentiometric probes. Fluorescence measurements are more effective than absorption measurements when measuring from a small membrane area (Waggoner and Grinvald 1977), particularly in situations where the image of the object (e.g., thin process) is much smaller than the size of the photodetector picture element (pixel) (Grinvald et al. 1982; Cohen and Lesher 1986). When transmitted light is used, only a small fraction of the total light captured by individual pixels will be modulated by the signal from the neuronal process (dendrite or axon) projected onto that pixel (ΔI). Most of the light will be projected directly and will only contribute to the resting light intensity (I). Thus, the fractional signal (ΔI/I) will be very small. On the other hand, in fluorescence measurements, practically all of the light projected onto individual pixels will come from the object (if auto fluorescence is negligible) regardless of the fraction of the pixel surface area covered by the image of the object. In the experiments on leech neurons (Grinvald et al. 1987), fluorescence measurements were used to record APs and synaptic potential signals from processes of selectively stained single neurons (Fig. 3.2). As predicted, the S/N was substantially improved relative to prior absorption measurements, but it was still too low to be of practical value—the available sensitivity was insufficient for multiple site optical recording of complex electrical interactions at the level of thin neuronal processes. Due to the low sensitivity of the measurements, elaborate correction procedures and extensive temporal averaging were necessary to improve the S/N. Additionally, spatial resolution was sacrificed and the signals reported were recorded from one location with a single photodiode. Moreover, the signals originated from a relatively large region of neuropile containing many processes, albeit from a single identified neuron (Fig. 3.2c). Despite low sensitivity, these experiments clearly showed the advantages of selective staining of individual neurons by intracellular application of the dye. The limits to the sensitivity of these measurements were determined primarily by: (a) the relatively low voltage sensitivity of the available dyes (amino-phenyl styryl dyes, e.g. RH437 and RH461; fractional change in fluorescence intensity per AP, in intracellular application, of the order of 0.01–0.1 %); (b) the choice of the excitation light bandwidth, and (c) the relatively low intensity of the incident light that could be obtained from a 100 W mercury arc lamp.
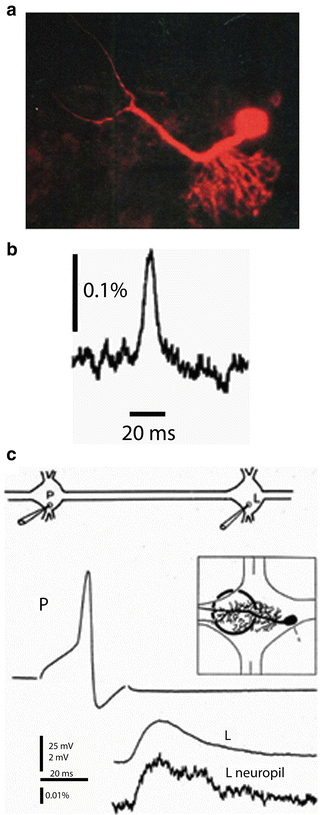

Fig. 3.2
Single photodiode optical recording from a neuron selectively stained by intracellular application of a voltage-sensitive dye. (a) Leech motoneuron following a 20 min iontophoretic injection with the styryl dye, RH-461. The soma, main process and its arborization within the neuropile are all clearly visible. (b) Optical recording of the AP in 175 μm long axonal segment of a P-sensory neuron in the anterior root. 12 trials were averaged. (c) Optical recording of the excitatory postsynaptic potential in the arborization of the L-motorneuron. The experimental arrangement for interganglionic stimulation and recording shown on top. Microelectrode recordings of the presynaptic AP in the P sensory neuron and the postsynaptic potential in the soma of the L motor neuron are shown. The region of the neuropile that was monitored is shown in the inset. The optical recording of the post synaptic potential from the neuropile in the adjacent ganglion is shown at the bottom. Adapted from Grinvald et al. (1987)
At the time, the reported sensitivity was the result of a modest screening effort suggesting that better signals might be obtained by: (a) synthesizing and screening new molecules for higher sensitivity; (b) increasing the concentration of the dye to increase the fluorescence intensity; (c) using an excitation light source capable of providing higher excitation light intensity and better stability and (d) using detector devices with lower dark-noise and adequate spatial and temporal resolution. Following this rationale, the first substantial improvement in the S/N was obtained by finding an intracellular voltage-sensitive dye with sensitivity in intracellular application two orders of magnitude higher than what was previously available. The amino-naphthalene styryl dye JPW1114 synthesized by J. P. Wuskell and L. M. Loew at the University of Connecticut Health Center had the sensitivity expressed as ΔF/F per AP, in intracellular application, of the order of 10 % (Antić and Zecević 1995). The higher sensitivity of this dye translates directly into higher S/N. At this stage, the sensitivity was also improved by using a more powerful excitation light source (Osram, XBO 250 W OFR) powered by a low-noise power supply (Model 1700; Opti-Quip, Highland Mills, NY). The dramatic improvement in sensitivity and the use of 12 × 12 or 24 × 24 element photodiode detector arrays (Centronix, Inc., Newbury Park, CA) allowed simultaneous multiple site monitoring of electrical signals from processes of invertebrate neurons in isolated ganglia (Antic et al. 2000; Antić and Zecević 1995; Zecević 1996). Figure 3.3 shows a diagram of the optical arrangement for epi-fluorescence measurement and a typical multiple site recording from axo-dendritic processes of an individual neuron from the land snail Helix aspersa. This type of recording permitted the analysis of the pattern of initiation and propagation of spikes in neuronal processes and provided direct information about the location and the number of spike trigger zones in a particular nerve cell. Also, it was possible to monitor directly spike propagation failure at axonal branch points (Antic et al. 2000). In all experiments on invertebrate neurons, individual nerve cells in isolated ganglia were observed using wide-field transmission microscopy and selectively stained intracellularly with the voltage-sensitive dye by iontophoresis from beveled sharp electrodes (Obaid et al. 1982; Grinvald et al. 1987; Antić and Zecević 1995).
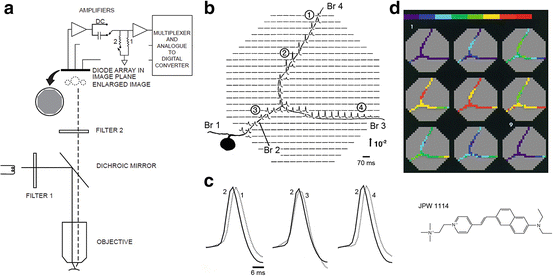

Fig. 3.3
Multiple site optical recording with a photodiode array from a neuron selectively stained by intracellular application of a voltage-sensitive dye. (a) Schematic drawing of the optical apparatus for multiple site epi-fluorescence measurements. The photodiode array was placed at the plane where the objective makes a real, magnified and inverted image. Epi-illumination was provided via a 10×, 0.4 NA, long working distance objective. The preparation was illuminated with the green portion (interference filter 520 ± 45 nm) of the output of a 100 W xenon arc lamp. Fluorescence emission from the preparation was selected by means of a dichroic mirror and an appropriate barrier filter (Schott RG610). The output of each detector was amplified individually, filtered, multiplexed, digitized and stored in a computer also used to analyze and display the data. (b) Optical recordings of AP signals from elements of a photodiode array positioned over the image of the axonal arborization of a Helix metacerebral cell from the left cerebral ganglion. The neuron was injected with the voltage-sensitive dye JPW1114 (structural formula shown in lower right panel). Spikes were evoked by transmembrane current pulses delivered through the recording microelectrode in the soma. The cell was depolarized from the resting Vm of −64 mV. Each optical trace represents 70 ms of recording centered on the peak of the spike. The recordings are shown divided by the resting light intensity. The arrow indicates the direction and the stated value of the relative fluorescence change (ΔF/F). Each diode received light from a 50 × 50 μm area in the object plane. A total of 90 trials were averaged to improve the S/N from distal processes. Optical signals were found in the regions of the array that corresponded closely to the geometry of the cell. Data from the detectors that do not receive light from the cell were deleted to improve clarity and allow color-coded display, shown in (d), based on a relative scale applied separately to each trace. (c) AP signals from four different locations indicated in (b) scaled to the same height, are compared on an expanded time scale to determine the site of the origin of the AP and the direction of propagation. (d) Color-coded representation of the data shown in (b) indicating the size and location of the primary spike trigger zone and the pattern of spike propagation. Consecutive frames represent data points that are 1.6 ms apart. Color scale is in relative units with the peak of the AP shown in red. Adapted from Zecević (1996)
The substantial improvement in the sensitivity of optical recording was accompanied by new demands for increased spatial and temporal resolution. Increased resolution, in turn, tended to diminish the S/N. The invertebrate neuron studies described above required spatial and temporal resolution that could only be achieved by using substantial temporal averaging (from 4 to 100 trials) to improve the S/N. In addition, the spatial resolution was limited by the available S/N to about 20–50 μm long sections of axo-dendritic processes. Clearly, further improvements were needed in order to reduce the temporal averaging and increase spatial resolution. The limits to the sensitivity in these measurements were determined primarily by: (a) the sensitivity of the available voltage dyes; (b) the choice of the excitation bandwidth; (c) the maximum excitation light intensity that could be obtained from a 250 W Xenon arc-lamp; and (d) the dark noise of the photodiode array which was the dominant noise at the fluorescence intensities recorded from individual neurons stained by intracellular application of the dye.
3.2.2 Vertebrate Brain Slices
It was of considerable interest to apply Vm-imaging techniques to the dendrites of vertebrate CNS neurons in brain slices. This possibility was first demonstrated with work on layer V neocortical pyramidal neurons (Antic et al. 1999) that established a basic protocol for intracellular labeling of individual nerve cells in slices and described the method for simultaneous optical recording of electrical signals from multiple sites on apical, oblique, and basal dendrites. In these experiments, individual pyramidal neurons in slices were observed using infrared dark-field video microscopy and stained selectively by intracellular application of the voltage-sensitive dye by diffusion from a patch electrode in a whole-cell configuration. The major problem in injecting vertebrate neurons from patch pipettes was leakage of the dye from the electrode into the extracellular medium before the electrode is attached to the neuron. Patching requires pressure to be applied to the electrode during electrode positioning and micromanipulation through the tissue. This pressure ejects solution from the electrode. To avoid extracellular deposition of the dye that binds to the slice and produces large background fluorescence, the tip of the electrode was filled with dye-free solution, and the electrode was backfilled with dye solution. The amount of dye-free solution in the electrode tip and the applied pressure has to be adjusted empirically to ensure that no dye leaks from the electrode before the seal is formed. Usually, no pressure is applied before the electrode enters the slice. Low pressure (10–20 mBar) is used during electrode positioning in the slice, and the final pressure of 50–100 mBar, necessary for cleaning the surface membrane of the cell, is applied immediately (1 s) before the seal formation. Using this method, it was possible to load neurons routinely without increasing the background fluorescence of the surrounding tissue. At the end of a ~1 h diffusion period, the patch pipette was detached and the injected dye was allowed to spread for an additional 2 h before the start of optical recording. Within this time, dye would reach the apical tuft branches in layer I, ~1 mm from the soma. The results of these experiments demonstrated: (a) that loading vertebrate neurons with a voltage-sensitive dye using patch electrodes was possible without contamination of the extracellular environment; (b) that brain slices did not show significant autofluorescence at the excitation/emission wavelengths used (in contrast with the experience of Grinvald et al. (1987)); (c) that pharmacological effects of the dye were completely reversible; (d) that the level of photodynamic damage was low enough to permit meaningful measurements and could be reduced further; and (e) that the sensitivity of optical recording with a 464 element photodiode array was comparable to that reported for invertebrate neurons. At this level of sensitivity, however, modest temporal averaging in recording AP signals was still required, and spatial resolution was limited by the available S/N to approximately 20 μm long sections of dendritic processes (Antic et al. 1999). The limits to the S/N in these initial measurements from vertebrate neurons were determined by the same factors as described above for invertebrate preparations.
3.2.3 Improvement in Sensitivity with CCD Cameras
The second significant improvement in recording sensitivity in measurements from individual nerve cells (after the synthesis of a dye far more suitable for intracellular application) was the introduction of a cooled, back-illuminated CCD camera in place of the 464-element diode array. Fluorescence measurements from individual neurons have a lower range of intensities (with correspondingly lower absolute amplitude of the shot noise) so that the dominant noise, in recordings with a 464-diode array, was the relatively large dark noise of the amplifier-photodiode circuit. Thus, the dark noise of the photodiode array limited the detection system sensitivity, rendering it significantly lower than the theoretically attainable shot noise limit. It was then realized that in this range of illumination intensities (from 5 × 10³ to 5 × 10⁶ photons/ms) the CCD camera can approach the ideal (shot noise limited) sensitivity (Wu et al. 1999) (see also Chap. 1). The back illuminated CCD camera, because it is cooled and can have about 1,000 times smaller pixel surface area and proportionally smaller dark currents compared to available diode arrays, exhibits substantially lower dark noise. Test measurements performed at low light level (Wu, Cohen and Zecevic, unpublished observations), established that a particular cooled CCD camera (FastOne, Pixel Vision Inc., Beaverton, OR) improved the sensitivity by a factor of approximately 20 (Fig. 3.4a). The upper trace in Fig. 3.4a shows the recording of a step change in light intensity adjusted in amplitude to be at the limit of resolution (S/N = 1) for the photodiode array. The lower trace is the recording of the same steps using the high-speed, cooled CCD camera. This result is a demonstration of the remarkable improvement in S/N resulting from the large reduction in dark noise.
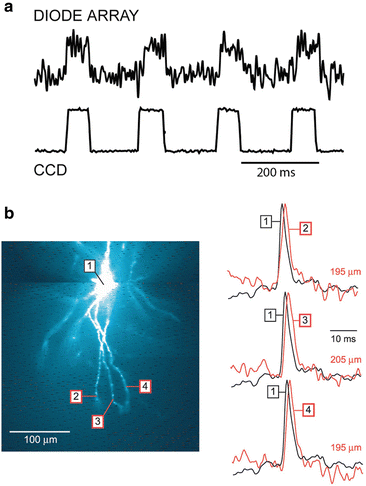

Fig. 3.4
Optical detectors for voltage-sensitive dye recordings. (a) The performance of a 464-element photodiode array and a cooled back-illuminated CCD camera are compared directly using the same preparation. The measurements were done at a relatively low resting light level, comparable to the resting fluorescence intensity in recordings from processes of selectively stained individual neurons. Upper trace: recording of a step change in light intensity adjusted in amplitude to be at the limit of resolution (S/N ≈ 1) for the photodiode array. Lower trace: the recording of the same signals using the high-speed, cooled CCD camera. The improvement in the S/N ratio by a factor of approximately 20 is attributable to the large reduction in dark noise. (b) AP signals in distal segments of basal dendrites of a pyramidal neuron obtained with a cooled CCD camera. A composite fluorescence image of a layer V pyramidal neuron in recording position shown on the left. Optical signals from distal dendritic segments at distances larger than 180 mm, as indicated, shown on the right. Each trace is the product of temporal (four trials) and spatial (6–9 pixels) averaging. Adapted from Antic (2003)
The increase in sensitivity with the introduction of advanced CCD cameras allowed, for the first time, recording of the spatial and temporal dynamics of electrical events in thin, distal dendritic processes that cannot be probed with conventional patch-electrode techniques. The optical approach made possible simultaneous measurements of the Vm transients in basal and oblique dendrites of pyramidal neurons during single APs and trains of APs (Fig. 3.4b; (Antic 2003)), as well as the analysis of synaptic potential initiation and spread in terminal dendrites of the glomerular tuft of individual mitral cells in the olfactory bulb slice (Djurisic et al. 2004).
The optical measurements from basal dendrites (Antic 2003) provided unique evidence that, in contrast to apical dendrites, basal and oblique dendritic processes impose modest amplitude and time course modulation on the backpropagating AP (bAP) and are robustly invaded by the somatic spike even when somatic firing rates reach 40 Hz (Fig. 3.4b). A compartmental model incorporating AP peak latencies and half-widths obtained from optical measurements indicated that the specific intracellular resistance (R i) is less than 100 Ω cm. The data obtained simultaneously from multiple dendritic sites and subsequently linked to a numerical simulation, revealed that all synaptic locations along basal and oblique dendrites, situated within 200 μm of the soma, experience strong and near-simultaneous (latency <1 ms) voltage transients during somatic firing (Antic 2003; Zhou et al. 2008). The continuation of these studies (Acker and Antic 2009) demonstrated that dendritic multi-site voltage sensitive dye recordings can be combined with pharmacological manipulations of membrane excitability to test and optimize multicompartmental numerical simulations. For example, the bAPs in basal dendrites have been monitored before and after blocking the voltage gated sodium channels with tetrodotoxin (TTX), or blocking A-type potassium channels with 4-Aminopyridine, in order to determine the contribution of each membrane conductance to the dendritic AP signal (Acker and Antic 2009).
Experiments on mitral cells (Djurisic et al. 2004) showed that optical data can be used to measure the amplitude and shape of subthreshold excitatory postsynaptic potentials (EPSPs) evoked by olfactory nerve stimulation at the site of origin (glomerular tuft) and to determine its attenuation along the entire length of the primary dendrite. In addition, direct evidence was provided for the number, location, and stability of spike trigger zones, the excitability of terminal dendritic branches, and the pattern and nature of spike initiation and propagation in the primary and secondary dendrites. In a subsequent study (Djurisic et al. 2008), Vm-imaging was used to analyze the electrical properties and the functional organization of the terminal dendritic tuft, which was not accessible to standard electrode recordings (for single site patch-electrode recordings from small dendritic branches see (Nevian et al. 2007; Larkum et al. 2009)). Optical recording provided direct evidence that the dendritic tuft functions as a single electrical compartment for subthreshold signals within the range of amplitudes detectable by voltage-sensitive dye recording. Figure 3.5 illustrates the sensitivity of multiple site optical recordings of AP related signals and subthreshold, EPSP signals from mitral cell tuft dendrites in wide-field epi-fluorescence mode. With this approach, it was possible to record AP signals at a frame rate of 2 kHz in single trial recordings from ~4 μm long sections of terminal dendritic branches less than 1 μm in diameter. As shown in the figure, the modest S/N obtained in single-trial, single-pixel measurements could be further improved by spatial and temporal averaging. A representative optical recording of EPSPs from the site of origin on glomerular dendritic branches is shown in Fig. 3.6. These experiments demonstrated that, at the spatial scale of dendritic processes, 3–5 mV synaptic potentials can be resolved optically in single-trial recordings. The relatively weak S/N in measurements of small, subthreshold Vm transients could be improved by modest temporal averaging (4–9 trials).
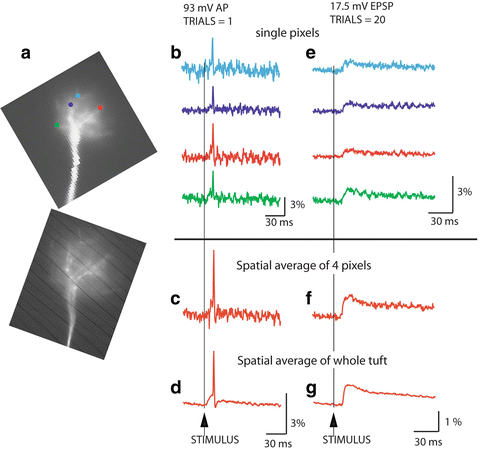
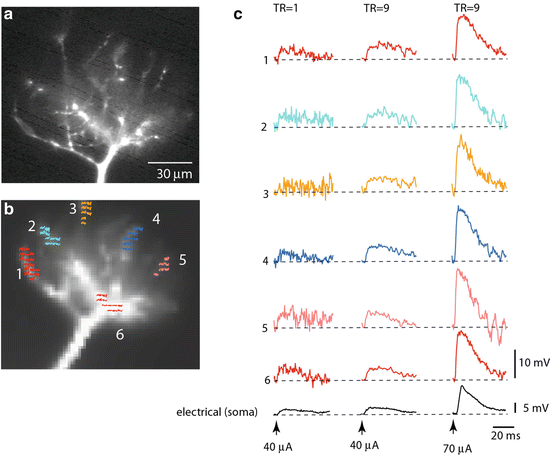

Fig. 3.5
Sensitivity of voltage imaging with low noise CCD camera in recordings from the apical dendritic tuft of a mitral cell of the olfactory bulb. (a) Low resolution (top) and high resolution (bottom) fluorescence images of the terminal dendritic tuft in recording position. (b) Recordings of AP signals from four individual pixels receiving light from four 3.7 × 3.7 μm locations on the dendritic tuft. (c) The S/N ratio with spatial averaging of four pixels marked in (b). (d) The S/N ratio with spatial averaging of the entire tuft area. (e) An evoked EPSP recorded from four individual locations on the dendritic tuft; 20 trials averaged. (f) Spatial average of signals shown in (e). (g) Spatial average of the entire tuft area. Adapted from Djurisic et al. (2004)

Fig. 3.6
Spatial distribution of subthreshold EPSP signals is uniform in thin terminal dendritic branches of a mitral cell dendritic tuft. (a, b) Fluorescence image of a mitral cell tuft obtained with a conventional high-resolution CCD (a) and with a fast, low-resolution (80 × 80 pixels) CCD used for voltage imaging (b). Six color-coded recording locations indicated on the image in (b) correspond to traces shown in (c). (c) Trace display of Vm signals. Traces are spatial averages of colored pixels. Bottom black traces, electrical recordings from soma. Left traces: Single-trial recordings of the small EPSP signal are at the limit of amplitude resolution. Middle traces: Nine averages of the small EPSP signals shown on the left improved the S/N ratio. Right traces: Nine averages of the EPSP four times larger in amplitude. Adapted from Djurisic et al. (2008)
The same methodology based on the use of high-speed, low read noise CCD camera (FastOne, Pixel Vision Inc., Beaverton, Oregon or NeuroCCD-SM, RedShirtImaging LLC, Decatur, Georgia), has been applied to the analysis of dendritic signals from rat hippocampal CA1 pyramidal neurons during coincident pre- and post-synaptic activity using combined voltage- and calcium-imaging from neurons labeled with two indicators (see Chap. 4 and (Canepari et al. 2007)). The combined imaging technique was also applied to the analysis of dendritic Vm and Ca2+ signals associated with parallel fiber and climbing fiber stimulation in cerebellar Purkinje neurons (Chap. 4 and (Canepari and Vogt 2008)), as well as to the study of the correlation between dendritic electrical transients (plateau potentials) and dendritic calcium signals during suprathreshold glutamatergic synaptic input (Milojkovic et al. 2007). In addition, using exactly the same recording apparatus and protocols, similar spatial resolution was reported in recordings from axons and basal dendrites of layer 5 pyramidal neurons (Palmer and Stuart 2006; Kampa et al. 2006). However, in these studies, a significantly lower range of excitation light intensities was utilized, reducing the S/N significantly. The loss in sensitivity was compensated by extensive temporal averaging, which is only possible at reduced light intensity because of reduced photodynamic damage.
The studies described above documented that Vm-imaging is quite efficient at the spatial scale of dendritic branches. Clearly, the sensitivity was adequate to monitor suprathreshold, regenerative AP signals (Figs. 3.3, 3.4, and 3.5) as well as subthreshold, synaptic input signals (Fig. 3.6) from multiple sites on dendritic processes. The available S/N, however, was not adequate to allow multisite recordings from thin axons and axon collaterals at high frame rates (5–10 kHz) without extensive averaging (>100 trials). Such high frame rates are required for monitoring fast axonal APs at physiological temperature. In addition, it was still not possible to monitor Vm signals at the higher optical magnification and finer spatial scale necessary for resolving electrical events at the level of individual dendritic spines. Clearly, further improvements in sensitivity were needed.
3.2.4 Improvements in Sensitivity with Monochromatic, Laser Light Excitation
A possible approach toward achieving high speed multiple site optical recordings of membrane voltage from axons and axonal collaterals as well as from individual dendritic spines in brain slices is wide-field epi-fluorescence microscopy applied at high optical magnification. Several alternative optical approaches to Vm-imaging are also available; these will be discussed in Sect. 3.2.5 below.
The limited sensitivity of available epi-fluorescence Vm-imaging methods required extensive averaging (>100 trials) in recording fast axonal AP signals because these recordings necessitate high frame rates (10 kHz) (Palmer and Stuart 2006). Similar low sensitivity is obtained in recording signals from individual dendritic spines because an order of magnitude higher optical magnification is required to resolve spines (Palmer and Stuart 2009). Because extensive averaging (>100 trials) makes most physiologically relevant experiments very difficult or impossible, a substantial improvement, by a factor of 10–100, in the sensitivity was desirable.
Within the constraints imposed by Eq. (3.1), one way to increase the S/N with a given voltage-sensitive dye is to increase the photon flux (Φ) by increasing the excitation light intensity. Another possibility is to increase the fractional fluorescence change per unit change in Vm (sensitivity of the dye) by choosing the optimal excitation wavelength. Following this rationale, Holthoff et al. (2010) used one of the most sensitive voltage-sensitive dyes in terms of S/N (JPW3028; (Djurisic et al. 2004; Zhou et al. 2008; Acker and Antic 2009)), and improved both the excitation (and, hence, emission) light intensity and the relative fluorescence change in response to Vm change by utilizing a laser as an illumination source in wide-field epi-fluorescence microscopy mode (Holthoff et al. 2010). In measurements from layer 5 pyramidal neurons in rat visual cortex slices, the light from a frequency-doubled 200 mW diode-pumped Nd:YVO4 continuous wave (CW) laser emitting at 532 nm (Excelsior 532 single mode; Newport-Spectra-Physics, Mountain View, CA) was directed to a quartz optical fiber (TILL Photonics GmbH, Gräfelfing, Germany) coupled to the microscope via a single-port epi-fluorescence condenser (TILL Photonics) designed to overfill the back aperture of the objective. In this way, approximately uniform illumination of the object plane was attained. Figure 3.7 depicts the experimental set-up schematically. A stationary stage upright microscope (Model BX51WI Olympus Inc, Japan) equipped with three camera ports was used in these experiments. One camera port had a standard, high spatial resolution CCD camera for infrared DIC video-microscopy (CCD-300-RC, Dage-MTI, Michigan City, IN). The second camera port had a fast data acquisition camera (up to 20,000 frames/s) with relatively low spatial resolution (80 × 80 pixels) but outstanding dynamic range (14 bits) and exceptionally low read noise (NeuroCCD-SM, RedShirtImaging LLC, Decatur, GA). The third camera port had a CCD camera with high spatial resolution (1,392 × 1,024 pixels; Pixelfly-qe, PCO Imaging, Kelheim, Germany) mounted on a Yokogawa spinning-disc confocal scanner used to collect z-stacks of confocal images for detailed morphological reconstruction of the stained cell. The fractional amplitude noise in low-noise solid-state lasers (<0.2 %) did not interfere with recording sensitivity because it was below the typical fractional shot-noise in fluorescence voltage-sensitive dye recordings (Iwasato et al. 2000; Matsukawa et al. 2003; Zhou et al. 2008). The excitation light was reflected to the preparation by a dichroic mirror having a central wavelength of 560 nm, and the fluorescence emission was passed through a 600 nm barrier filter (a Schott RG600). Imaging was performed with a low-noise high-speed CCD camera.
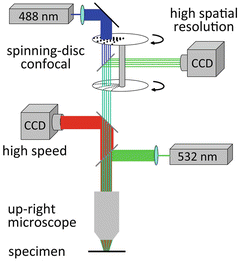

Fig. 3.7
Experimental setup for voltage-imaging from dendritic spines in cortical brain slices. The voltage-sensitive dye was excited using a 532 nm solid-state laser in wide-field illumination mode. Emission light was recorded with a high-speed CCD-camera. A spinning-disc confocal scanner with 488 nm laser was utilized for morphological reconstruction. Adapted from Holthoff et al. (2010)
With this apparatus, a series of control experiments were designed to test three critical methodological parameters: (a) improvement in the S/N; (b) the extent of photodynamic damage at the required excitation light intensity; (c) the limits to the spatial resolution as determined by light scattering in wide-field epi-fluorescence measurements. Robust and unambiguously favorable results were obtained regarding all three parameters (see below).Following these initial measurements, further experiments were carried out to characterize bAP signals in dendrites and spines.
As described above (Fig. 3.7) imaging was performed with a high-speed CCD camera. Neurons with easily discernible dendrites were loaded from a patch-pipette with the voltage-sensitive dye JPW3028. Figure 3.8b shows a composite fluorescence image of a pyramidal neuron labelled with the voltage-sensitive dye.
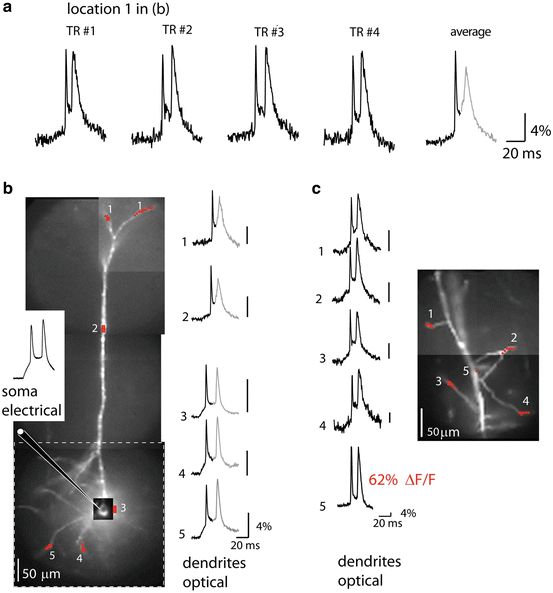

Fig. 3.8
Dendritic bAP signals in apical, basal and oblique dendrites. (a) The bAP signals from the apical terminal tuft 700 μm from the soma (spatial average from location 1 in b). Single-trial recordings and a temporal average of four trials illustrate the sensitivity of recording (S/N ~ 15 and 30 respectively). (b) A composite fluorescence image of a pyramidal neuron. The size of the full frame imaging region is outlined by dashed-line rectangle. Traces on the right are temporal averages of four trials and spatial averages from locations 1 to 5 indicated on the image. The peak of the first bAP was used as a reference point for averaging. Consequently, the second spike shown in gray did not average coherently because of temporal jitter. The electrode recording from the soma is on the left. (c) A composite fluorescence image of a dendritic region from another neuron with several oblique dendrites in focus for voltage-imaging. Single-trial recordings on the left are spatial averages from locations 1 to 4 indicated on the image. Adapted from Holthoff et al. (2010)
Improved Vm-Imaging from Dendritic Branches
In the initial series of experiments, the extent of propagation and the time course of bAP signals were monitored from dendrites at relatively low magnification (the full CCD frame (80 × 80 pixels) corresponded to a 300 × 300 μm area in the object plane). At this magnification the dendritic spines could not be resolved even in principle because their image was smaller than individual pixels. Before optical measurements, the dye-loaded pyramidal neurons were re-patched with a dye-free pipette (Fig. 3.8b). Spikes were elicited by depolarizing current pulses delivered from a patch electrode in the soma and bAPs recorded optically from various dendritic compartments covering the entire dendritic tree (Fig. 3.8a–c). The recordings from different areas were obtained by sequentially repositioning the field of view. As indicated in the figure, at all dendritic sites, including the terminal apical tuft (Fig. 3.8a) as well as the oblique (Fig. 3.8c) and the basal dendrites (Fig. 3.8b), bAPs could be monitored with unprecedented sensitivity by the voltage probe JPW3028 at the laser excitation wavelength of 532 nm in single-trial measurements. The combined effect of an increase in light intensity and the use of a near optimal excitation wavelength was a dramatic improvement in the sensitivity of voltage imaging by a factor that varied from 10 to 50 in recording from different sites on neuronal processes. The single-trial signals (no averaging) from some of the individual pixels (Fig. 3.8c, location 5) yielded fractional fluorescence changes of about 60 % recorded with the S/N of approximately 50. The sensitivity of these measurements is the largest ever obtained from individual nerve cells in slices. Clearly, the amplitude of ΔF/F signals corresponding to the back-propagating spikes varied widely at different locations. This variability corroborates the earlier findings (Djurisic et al. 2004; Canepari et al. 2007) that the sensitivity of the optical measurements from different dendritic regions is not uniform. The sensitivity varied because the ratio of the dye bound to the plasma membrane that changes potential to the dye bound to intracellular membranes varies between different regions on the dendritic arbor as a function of many factors that cannot be determined accurately, including the surface to volume ratio and the amount of intracellular membranes (see Chap. 4 and (Canepari et al. 2008) for more detailed explanation on dye signal calibration). A small number of dendritic regions exhibited extremely large fractional changes (e.g. location 5 in Fig. 3.8c). This result suggest that the intrinsic voltage sensitivity of the dye is very high closely approaching the theoretical sensitivity limit for charge-shift probes excited by a wavelength close to the extreme red edge of the absorption spectrum (Kuhn et al. 2004). The simplest explanation for the large optical signals recorded from a small subset of dendritic regions is that the fluorescence from these sites was largely dominated by the dye bound to the plasma membrane, possibly because of a favorable surface-to-volume ratio and the absence of internal membranes at these locations. Apart from these sites, the optical signals related to bAP from most of dendritic regions were in the range of 10–20 %.
Improved Vm-Imaging from Axons
Another series of experiments was carried out at the same optical magnification to utilize the improved sensitivity of the voltage-imaging technique in the analysis of electrical events in individual axons. Recent experimental and theoretical data (Shu et al. 2007; Bennett and Muschol 2009) indicate that the functional capabilities of axons are much more diverse than traditionally thought. Consequently, the field of axonal physiology is rapidly expanding. At the same time, the traditional tools for analyzing axonal signaling were limited to single site electrode recordings from the cut end of axons. Clearly, new tools to gain a better understanding of signal integration in axonal processes are critical. The first successful attempt to monitor optically AP signals from multiple sites on the axon of a pyramidal neuron (Palmer and Stuart 2006) clearly demonstrated advantages of Vm-imaging by providing direct evidence on the approximate location of the spike initiation site in a vertebrate nerve cell (Fig. 3.9). The sensitivity of these recordings was limited by the amount of light that can be obtained from a 100 W tungsten-halogen bulb as well as by the choice of less favorable wavelengths of the excitation light. Thus, extensive signal averaging (>100 trials) was required to obtain useful information. This amount of averaging makes experiments difficult and prone to errors. A significant improvement in sensitivity brought about by laser excitation facilitated further studies. By using those improvements in imaging technique that provided exceptional temporal resolution, it was possible to analyze the individual Purkinje neurons and resolve the region of spike initiation as well as follow spike propagation into axon collaterals for each action potential initiated in single trials (Fig. 3.10). The results of this study demonstrated that the axon initial segment is a critical decision point in Purkinje cell processing and that the properties of axon branch points are adjusted to maintain faithful transmission (Foust et al. 2010). In another study focused on layer V pyramidal neurons (Popovic et al. 2011), the authors utilized the same refinements of dye-based measurements to elucidate the behavior of cortical pyramidal cell axons and their small, branched collaterals. Figure 3.11 illustrates how multiple site optical recording was used to directly determine the location and length of the spike trigger zone (TZ) as defined in functional terms. The results show that in mature axons of mouse cortical layer 5 pyramidal cells, action potentials initiate in a region ∼20 μm in length centered in the axon initial segment between 20 and 40 μm from the soma. From this region, the AP depolarizing wave invades initial nodes of Ranvier within a fraction of a millisecond and propagates in a saltatory fashion into axonal collaterals without failure at all physiologically relevant frequencies. Optical signal processing that was utilized to generate the kind of results described above is illustrated in Fig. 3.12. More detailed explanation of the limits to spatiotemporal resolution is given below.
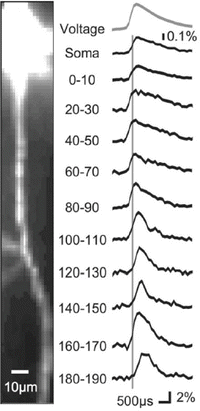
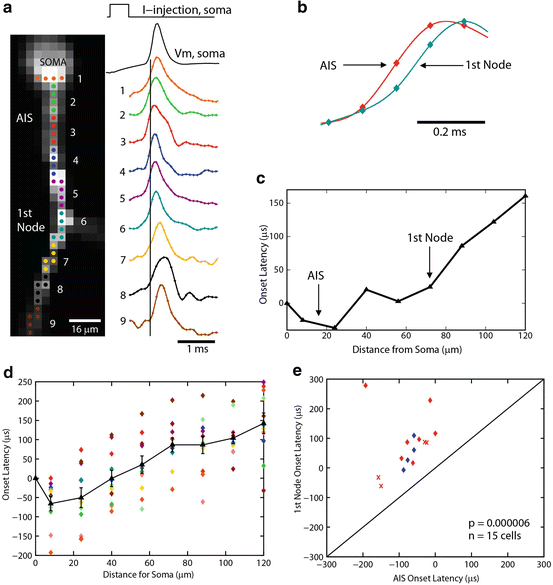
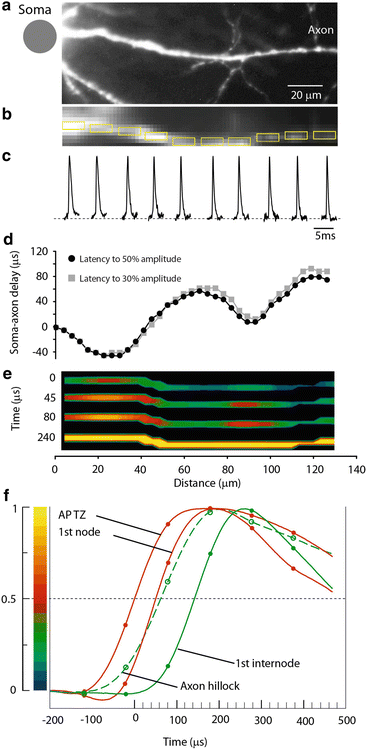

Fig. 3.9
High-speed recording of AP signals from axons of a cortical pyramidal neuron. High-magnification image of the axon of a layer 5 neocortical pyramidal neuron filled with voltage-sensitive dye. Average fluorescence change of 130 individually aligned APs recorded from indicated axonal locations at a frame rate of 10 kHz. APs were evoked by somatic current injection

Fig. 3.10
APs initiate in the Purkinje cell axon initial segment. (a) Voltage-sensitive dye fluorescence image of the soma–axon region in recording position shown on the left. Traces on the right, Single-trial recordings of AP signals, initiated by somatic current injection, from nine locations indicated on the image. Each trace is a spatial average of four to five same-color pixels. Signals are scaled to the same peak height. The symbols represent actual data points; the solid lines are reconstructed signals using cubic spline interpolation. The vertical line denotes the time at half-maximum amplitude at the edge of the soma (location 1). Note that the AIS segment traces (green and red) initiate the action potential first. (b) AP recordings from the AIS and the first node of Ranvier scaled to the same height and compared on an expanded timescale. (c) The time to half-maximum amplitude subtracted from the time at half-max for the edge of the soma (“onset latency”) as a function of distance from the soma. (d) Group data (n = 15) illustrating the level of consistency in the spatial localization of spike onset and the spike propagation velocity across cells. Error bars indicate SEM. (e) Group data statistics. The onset latency is lowest in the axon initial segment, and in all cells preceded the spike in the first node of Ranvier (p = 0.000006; n = 15). The diagonal line represents equity. The diamonds represent spikes initiated with a current pulse. The data obtained from spontaneous spikes are indicated by crosses. The data in red was obtained at 35 °C, whereas the data in blue was obtained at 23 °C

Fig. 3.11


Measurement of the spatial distribution of membrane potential as a function of time along the proximal axon during AP initiation. (a) High resolution confocal image of the axon in recording position. (b) Low spatial resolution fluorescence image of the axon obtained by CCD used for Vm imaging. (c) AP signals from ten locations indicated by yellow rectangles, each 10 μm in length. (d) Soma–axon latency to 30 % (grey) and 50 % (black) AP amplitude as a function of distance from the cell body. The first minimum identifies the location and length of the spike TZ. (e) Time sequence of frames showing spatial profile of color coded relative Vm amplitude in the axon at four characteristic time points: 0 μs—AP initiation at TZ; 45 and 80 μs—invasion of the first node; 240 μs—peak depolarization. (f) Comparison of AP signals from four characteristic locations on an expanded time scale. The measured data points and cubic spline interpolation curves are shown. Red traces—TZ and first node; green dashed trace—axon hillock; green trace—first internodal region. Membrane potential color scale shown on left
Stay updated, free articles. Join our Telegram channel

Full access? Get Clinical Tree


