Fig. 10.1
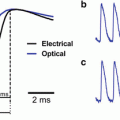
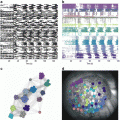
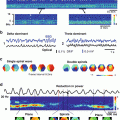
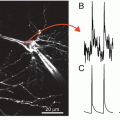
“Blue dyes”: Thirty-fold improvement in the signal-to-noise ratio. (a) Wavelength dependency of heart-beat and respiration signals. The left panel illustrates optical reflectance signals from cat visual cortex measured at several wavelengths. The color of the line schematically represents the wavelength of the illuminating light. The signals were averaged over the entire imaged area. The right panel plots the peak to peak amplitude as a function of wavelength, illustrating the fall off with increasing wavelength in this range. The inset shows the amplitude plot (normalized) on the same axes as the textbook absorption of oxy- and deoxy-hemoglobin, illustrating the close relationship between the two. (b) Time course of the evoked voltage-sensitive dye signals. The left and right top panels illustrate the signals from different experiments using the red dye RH-795 and the blue dye RH-1692 respectively. The curves show the raw fluorescence signals, without subtracting the blank, integrated over the imaged area (cat visual area 18) and averaged over trials. The orange curves are from the stimulated condition and the green lines are the blank data (no stimulus). Data acquisition was synchronized to the heart-beat. The solid black line marks the stimulus period. The circle in the left panel (RH-795) points to the time of the fast evoked signal showing its minute magnitude relative to the heartbeat signal. Note the large amplitude of the evoked signal relative to the heart-beat signal for the blue dye (right). This is true despite the larger total raw signal for the red dye. Note also that the sign of the heartbeat signals from the two dyes are opposite. (c) The same data as (b) but with the heartbeat signal removed by subtracting the blank condition. Note the large heart-beat artifact with the red dye at the time of the second heart-beat. Again the blue dye produces much better signal to noise ratio, allowing examination of small components in the response and longer recording interval that are still reliable. In both cases 16 presentations were averaged
With this advance it has become possible to reveal the dynamics of cortical information processing and its underlying functional architecture at the necessary spatial and temporal resolution in both anesthetized and behaving animals. Furthermore, it finally became possible to obtain good signals without trial averaging, thus facilitating the exploration of neocortical dynamics including spontaneous on-going activity. Additional advances related to the implantation of transparent artificial dura by Arieli et al. (2002) now allow chronic recordings to be taken over a long period of time. Optical imaging has also been performed simultaneously with intracellular recording, extracellular recording, microstimulation and tracer injection due to the development of an electrode assembly attached to a cranial window (Arieli and Grinvald 2002).
2.1 Relationship Between Voltage-Sensitive Dye Signals and Intracellular Recordings In-Vivo
In simple preparations, when single cells or their processes can be visualized, the dye signal looks just like an intracellular recording. Controversies about what the dye signal reflects during in vivo measurements were resolved by combining VSDI with intracellular recordings in vivo, first in cat visual cortex (Sterkin et al. 1998; Grinvald et al. 1999) and in the rat somatosensory cortex (Petersen et al. 2003a). The results established that the dye signal precisely reports changes in membrane potential (red and green traces in Fig. 10.2a, red and yellow in Fig. 10.2b and red and black in Figs 10.2c–f). The tight correlation between the intracellular neuronal recording and the VSD signal also indicates that the contribution of slow glial depolarization to the VSD signal is minimal. The linearity is shown in Fig. 10.2f.
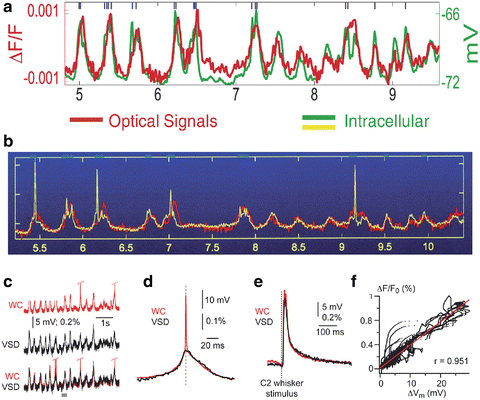

Fig. 10.2
The similarity between the cortical dye signal in-vivo from a small population of neurons and intracellular recording. (a) Two traces showing simultaneous intracellular and optical recording for 5 s, performed in a deeply anesthetized cat, a condition in which spontaneous changes in membrane potential are highly synchronized in a large population of neuron. The intracellular recording is depicted by the green trace and the population signal by the red trace. The action potentials were truncated and occurred at times marked by the short blue lines at the top. (b) The intracellular recording is depicted by the yellow trace. The action potentials were not truncated. One can see that the optical signal from the population next to the electrode is not picking up action potentials, presumably because the membrane area of the dendrites monitored by a single pixel is much larger than the membrane area of the non myelinated axons originating from that cell (the action potentials are not synchronized whereas the synaptic potentials are). (a, b) Modified from Sterkin et al. (1998). (c) Similar simultaneous recording from the rat somatosensory cortex showing once again that the population signal is similar to the synaptic potential but not to the action potential. WC whole cell recordings. (d) Same but on an expanded time scale, showing the resemblance between the dye signal and the intracellular recording. (e) Simultaneous recordings of an evoked response resulting from sensory stimulation of moving whisker C2. (f) The linearity of the Dye signal vs. the membrane potential change. (c–f) Modified from Petersen et al. (2003b)
During in vivo imaging of the neocortex, a single pixel contains the blurred images of various neuronal compartments—including the dendrites, axons and somata of a population of neurons—rather than a single cell. The VSD signal is linearly related to the stained membrane area, and most of the dye signal originates from cortical dendrites and non-myelinated axons rather than cell bodies, because their membrane areas are orders of magnitude larger than that of neuronal somata or confined non myelinated axons. The dendrites of cortical cells are often far more confined than the axons, so most of the signals in a given pixel originate from the dendrites of nearby cortical cells. Therefore, the existence of a dye signal in a particular cortical site does not necessarily imply that cortical neurons at that site are generating action potentials. However, the peak/s of the VSD response to a suprathreshold stimulus corresponds to the spiking zone, which is to be expected from the fact that synaptic activity peaks in this zone too (Jancke et al. 2004; Sharon et al. 2007). In-vivo the VSD signal thus reflects mainly dendritic activity, making VSDI optimal for exploring population dynamics of local subthreshold neuronal activity. However, the VSD signal also contains some spiking information (output), which remains to be exploited.
2.2 Imaging from the Mammalian Brain In Vivo
A major technical impediment to imaging anesthetized or awake animals is movement of the brain, A critical aspect of imaging neocortical activity in-vivo is therefore to obtain a stable view of the cortex. The obvious solution is to fix the head relative to the imaging apparatus as done for electrical or intracellular recordings. Head-fixation bars can be attached to the skull of the animal. Next, a sealed recording chamber should be used to minimize brain pulsations relative to the skull. A tandem-lens macroscope (Ratzlaff and Grinvald 1991) can then be mounted in a stable location relative to the fixed head position for epifluorescent VSDI with suitable illumination and camera equipment.
2.3 Spatial and Temporal Resolution
As already mentioned, voltage-sensitive dyes respond to membrane potential changes in microseconds at a spatial resolution of ~0.5 μm. However, the practical spatiotemporal resolution that can be obtained by in-vivo imaging depends on factors other than the resolution of the dye molecule’s response, such as light scattering within the imaged tissue, photodynamic damage, and optics of the data acquisition apparatus including the detector resolution. Below we discuss some of these factors. Empirically, we find that current dyes and equipment allow excellent signal-to-noise at a sampling rate of 5–10 ms with each pixel looking at a 50 × 50 μm area of cortex. Light scattering is a major determinant of spatial resolution, and photodynamic damage is an important determinant of signal-to-noise ratio, both spatially and temporally because it limits the light intensity used to reduce shot noise or the extent of signal averaging used to improve the signal to noise ratio.
Additional concerns include limited depth of penetration into the cortex, and possible pharmacological side effects. The new oxonol dyes have largely alleviated the problems of pharmacological side-effects and photodynamic damage. First, intracellular recordings in-vivo have directly confirmed that stained cortical cells maintain their response properties. (Ferster, Lampl, Arieli and Grinvald, unpublished results). Furthermore, long-term VSDI in awake monkeys have indicated that, even after a year of imaging, monkey visual cortex continued to function normally: the animal maintained normal performance in tasks that required the normal functioning of the cortical area which was repeatedly imaged for up to a year.
The primarily dendritic origin of the VSD signal (see above) also affects the spatial resolution of VSDI, because the dendrites of cells in a given cortical column typically cross cortical areas that correspond to adjacent cortical columns, which have different functional properties. Therefore, the dendritic view of activity offered by VSDI is in effect somewhat blurred relative to the somatic activity. Differential imaging provides some remedy to this problem as well as the light scattering problem. Using differential imaging whenever applicable may provide even 1 μm resolution and depends mostly on the signal to noise ratio which can be obtained.
Improvements in the dyes and in the spatial resolution of fast cameras have thus made it possible to obtain high resolution functional maps of somatosensory whisker barrels, olfactory glomeruli and visual orientation columns, “lighting up” in milliseconds with a signal-to-noise ratio even better than that obtained with the slow intrinsic signals. Additional developments will undoubtedly introduce further improvement.
2.4 Long-Term Repeated VSDI
To facilitate repeated imaging sessions, the resected dura matter is substituted with artificial dura mater. A careful cleaning procedure has allowed repeated VSDI sessions in monkeys 2–3 times a week over a period longer than a year (Arieli et al. 2002). Long term imaging allows exciting new type of experiments related to development, plasticity, learning and memory, and recovery after trauma or stroke.
2.5 Integrating VSDI with Electrode Techniques
VSDI can easily be combined with standard electrode-based techniques. Whereas optimal mechanical stability for imaging is provided by sealed cranial windows, these do not allow electrodes to be introduced. One approach is to cover the cortical surface with agarose and stabilise it by a cover slip. A small gap between the edge of the cover slip and the wall of the recording chamber allows oblique entry of electrodes into the rodent cortex (Petersen et al. 2003a, b; Berger et al. 2007; Ferezou et al. 2006, 2007). For cats and monkeys a sliding-top cranial window was developed with a removable microdrive-positioned electrode (Arieli and Grinvald 2002). VSDI can then be combined with microstimulation, extracellular recording (single- and multiple-unit recording and local field potential), intracellular recording, patch recordings and targeted injection of tracers. Recordings can either be made simultaneously and/or can be targeted to specific regions based on the functional imaging data. (Arieli and Grinvald 2002)
3 Explorations of Population Dynamics in Visual Cortex
3.1 Lateral Extent of Focal Activation and the Lateral Spread Dynamics
Retinotopic VSDI experiments in monkey have been used to investigate how far across the cortical surface synaptic activation spreads from a sensory point stimulus—the cortical point-spread function (Fig. 10.3a). Activity spreads over a cortical area much larger than predicted on the basis of standard retinotopic measurements in layer 4, but is consistent both with the anatomical finding of long-range horizontal connections in visual cortex and with intracellular recordings. The cortical point spread function was calculated from these experiments and projected onto a histological section of cytochrome oxidase blobs (Fig. 10.3b) to show its relationship to individual cortical modules.
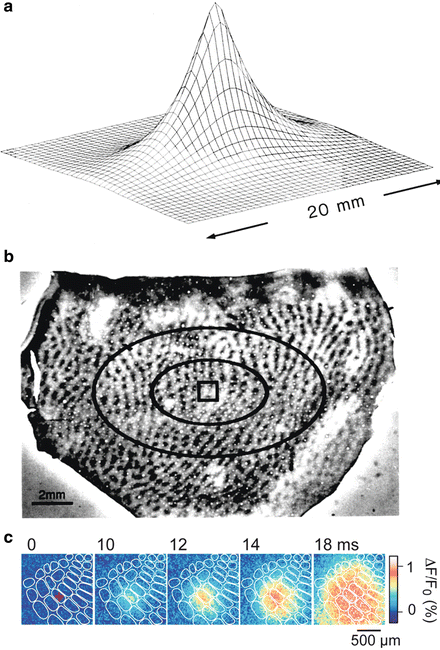

Fig. 10.3
Many functional domains are activated during the processing of a small retinal image or a single whisker. (a) Calculation of the activity spread from a small patch in layer 4 (a 1 × 1 mm square) within the upper cortical layers of a macaque. This cortical activation was produced by a retinal image of approximately 0.50° × 0.25° that was presented to both eyes. The ‘space constants’ for the exponential-activity-spread measured with the dye experiments were 1.5 and 2.9 mm in the cortical axes perpendicular and parallel to the vertical meridian representation, respectively. (b) Direct activation in layer 4 (of the area within the square; calculated from retinotopic extracellular recordings) and the spread in layers 2/3 (elliptical contours; calculated from VSDI) are shown superimposed on a histological section showing the mosaics of cytochrome oxidase blobs, close to the border between cortical areas V1 and V2. The center ellipse shows the contour at which the amplitude of cortical activity drops to 37 % of its peak. The larger ellipse shows the contour at which the spread amplitude drops to 14 %. More than 10,000,000 neurons reside in the cortical area bounded by the large ellipse containing a regular mosaic of about 250 blobs. Adapted from Grinvald et al. (1994) with permission from the Society for Neuroscience. (c) The exact spatio-temporal pattern of the spread in the somato-sensory cortex in response to a single barrel stimulation. The temporal resolution was 2 ms/frame. Modified from Petersen et al. (2003b) and from Ferezou et al. (2006)
The stimulus caused spiking activity only in neurons in the marked small square, which contains four cortical modules. However, more than 250 blobs had access to the information carried by the signal spread, at a signal amplitude of at least 1/e 2 of maximum. The apparent space constant (signal decrement to 1/e of peak) for the spread was 1.5 mm along the cortical axis parallel to the ocular dominance (OD) columns, and 3 mm along the perpendicular axis. The spread velocity was 0.1–0.2 m/s. Much higher spatial resolution data showing similar spread in the somatosensory cortex has been first reported by Petersen and colleagues (2003a, b; Fig. 10.3c) and several subsequent papers from the same group.
These results indicate extensive distributed processing, and were further investigated also in cat visual cortex with the new generation of dyes and an imaging system offering subcolumnar resolution, taking a more detailed look at the “inverse” of the receptive field—the region of cortical space whose spatiotemporal pattern of electrical activity is influenced by a given sensory stimulus. The spatiotemporal properties of this activated area, which we refer to as the cortical response field, were studied using VSDI for responses to small, local drifting oriented gratings. One might expect a smooth decline in activity level from the cortical response field peak to periphery, as the overlap between the stimulus and the aggregate receptive field (RF) at each cortical location decreases. However, this is not the case, and as shown in Fig. 10.4a, the average cortical response field during a late time window (~140–515 ms after stimulus onset) has a distinctive spatial structure: an initial rapid drop from the peak is followed by a slower-sloped region, the plateau, beyond the rim of which (black contour line) a rapid decline in activity level occurs in the periphery. Plateau rim location was largely independent of stimulus orientation (Fig. 10.4b). The task of obtaining single-condition responses to these small stimuli at 10 ms resolution, especially demanding during early activation when response amplitude is low, was undertaken to determine the dynamics and significance of this spatial structure.
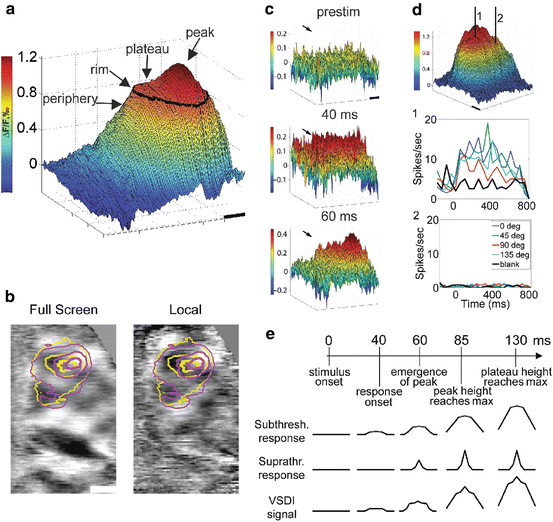

Fig. 10.4
Cortical response fields in response to local visual stimuli: structure and dynamics. (a) The cortical response field averaged over 140–515 ms after presentation of a local drifting grating exhibits the characteristic plateau + peak spatial structure. Beyond plateau rim, responses in the periphery decay quickly. (b) Relationship between response field to local grating stimuli of two orthogonal orientations (yellow and magenta contour lines) and differential orientation map from full-screen (left) and local (right) stimuli. Plateau rim (outer contour lines) is similar among the two orientations, whereas the peak zone (inner contour lines) corresponds better to the underlying orientation map. (c) Early dynamics: the initial response (40 ms) is a flat-topped plateau, with the peak emerging upon it only later (60 ms). (d) Spiking is restricted to the peak zone. (Top) A cortical response field with the locations of two extracellular electrodes. (Middle) Spiking responses are evoked in the peak zone (location 1) by the local stimulus. (Bottom) Spiking is absent in response to the same stimulus in the plateau away from the peak (location 2). (e) Timeline of the population response (top) and the proposed underlying subthreshold and suprathreshold responses (middle). The VSDI signal (bottom) is a sum of these two components, with the subthreshold response contributing a larger component due to relative membrane areas
Results show that initially the response consists of a flat-topped plateau (Fig. 10.4c, 40 ms), and that the peak emerges upon it only about 20 ms later (Fig. 10.4c, 60 ms). The peak region amplifies relative to plateau amplitude for an average of 25 ms, and after this time only the plateau’s height above the periphery continued to increase, reaching a maximum at 130 ms. The qualitatively different response dynamics suggested to us that spiking activity may be restricted to the peak zone, and that despite the high amplitude VSD signal at the plateau, neurons are not spiking. Extracellular recording showed that indeed spiking is evoked in the peak zone, but not at the plateau (Fig 10.4d). These results can be explained by a simple model which views the VSD signal as a weighted sum of all membrane potential changes: subthreshold responses and suprathreshold responses, with the former supplying the larger contribution to the signal due the larger membrane area involved (Fig 10.4e). The subthreshold response is wider in spatial extent because subthreshold receptive fields are larger than suprathreshold receptive fields. In this model, the sharp drop in activity occurring at the rim of the plateau and beyond is a result of reaching the edge of the area where neurons’ subthreshold receptive field fully contains the stimulus. Smaller decrements are exhibited as long as the stimulus is fully contained within neurons’ receptive field, i.e. within plateau rim.
The view that arises from these results is that, while unsurprisingly spiking activity occurs only for neurons with receptive fields at the correct location and orientation, a near-maximal subthreshold response is evoked in an area spanning several square millimeters, plunging quickly only once subthreshold receptive field overlap with the stimulus starts to decrease. Plateau activation to just below spiking threshold thus encompasses all orientations in an area representing a region of visual space larger than the stimulus. This interesting neuronal strategy primes the cortex for processing of subsequent stimuli, and could be involved in stimulus-driven attentional capture and in motion processing.
3.2 Dynamics of Shape Processing
Although orientation selectivity in the visual cortex has been explored for decades, the question of the interplay between feedforward processes and intracortical connections underlying this property has remained open. Two families of mechanisms have been proposed to play a role in the emergence of the highly orientation-selective responses of cortical visual neurons, a property not shared by their thalamic inputs. Feedforward-only models suggest appropriate alignment of thalamic input as the mechanism, whereas recurrent models suggest that intracortical interactions are more important. The response dynamics in visual cortex are fundamental to answering this question, because the feedforward explanation predicts that orientation selectivity should remain constant with time from stimulus onset, whereas if recurrent interactions are important then selectivity should change as the cortical network performs its processing. Traditional electrophysiological techniques have not been able to give a conclusive result regarding this issue. VSDI is ideally-suited to resolve it, being a high spatiotemporal resolution population imaging technique that emphasizes synaptic input.
To investigate the dynamics of orientation selectivity, high-quality single-condition maps were obtained in cat visual cortex. A time-series of the initial response is shown in Fig. 10.5a for two orthogonal orientations. As soon as the response can be observed (30–40 ms), the two orthogonal stimuli preferentially activate complementary patches of cortex, seen in the differential map (Fig. 10.5b).
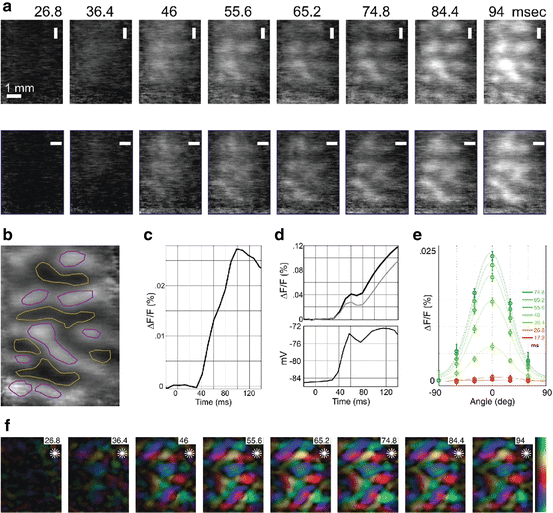

Fig. 10.5
Width of the orientation tuning curve is constant, but its amplitude increases dynamically during the first 40–60 ms of the response. (a) Time-series of single-condition orientation maps in cat produced in response to two orthogonal visual stimuli (top and bottom rows). (b) Spatial pattern revealed by differential imaging. Neurons within the yellow lines are selective for vertical; red—horizontal. (c) Temporal pattern of differential activity. The evoked DA (deceleration–acceleration) notch is barely visible. (d) Top, time-course of the evoked response to preferred (blue) and orthogonal (green) orientations. The two responses have the same onset latency but the response to the preferred orientation is larger from the beginning. A striking feature of the evoked responses is the DA notch, confirmed with intracellular recordings (bottom). (e) Orientation tuning curves at different times after stimulus onset. The curves after response onset (green) have the same shape but different amplitudes. The baseline of the curves was shifted to facilitate comparison. (f) Time-series of orientation-preference ‘polar maps’: color represents preferred orientation (top to bottom of color scale on right is 0–180°) and brightness represents the amplitude of differential response. Preferred orientation is steady from response onset. Adapted from Sharon and Grinvald (2002) with permission from the American Association for the Advancement of Science
The modulation depth, i.e. the amplitude of the difference between the responses to the two stimuli, increases at the beginning of the response, and peaks at about 100 ms (Fig. 10.5c). In order to calculate orientation tuning curves, however, differential maps and time-courses are of no use, and single-condition responses to several orientations are needed. Single-condition maps at different latencies are shown in Fig. 10.5a for two orientations, whereas Fig. 10.5d (top) shows single-condition timecourses averaged over the imaged pixels. The average evoked response to the preferred and orthogonal stimuli are plotted (blue and yellow, respectively). The tuning curve at each time point was calculated from the single-condition responses corresponding to the six different orientations presented (Fig. 10.5e). The immediate impression is that of tuning curves with a constant shape but changing amplitude. The map of preferred orientation does not change as time from stimulus onset progresses, as shown in Fig. 10.5f. Indeed, the half-width at half height of tuning curves, as well as preferred orientation, were steady right from response onset (30–40 ms after stimulus onset). Therefore, sustained intracortical processing does not seem to be necessary—at least for most neurons—to determine orientation tuning width and preferred orientation.
Stay updated, free articles. Join our Telegram channel

Full access? Get Clinical Tree


