Fig. 11.1
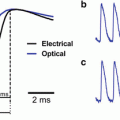
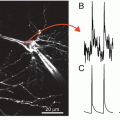
Voltage-sensitive dye imaging of behaving monkeys. Setup for VSD imaging of cortical dynamics in behaving monkeys. The exposed monkey cortex is covered with a sealed cranial window (bottom left inset), which acts as if the monkey had a transparent skull. After the cortex is stained with a suitable voltage-sensitive dye (blue/orange molecules in top right inset), it is illuminated with excitation light of the appropriate wavelength (630 nm; 30 nm bandwidth, in this case). A sequence of images of the fluorescing cortex is taken with a fast camera (100–10,000 Hz) using a macroscope offering a numerical aperture of ~0.4. During image acquisition the monkey fixates on a visual stimulus or the eyes are covered with shutters in order to monitor ongoing activity. The acquired images are digitized and transferred to the computer controlling the experiment. Functional maps or movies of the cortical activity are analysed and displayed on a colour monitor. Various types of electrical recording, microstimulation or tracer injection are often carried out simultaneously with the imaging. The similarity between the two traces above the electrode, comparing intracellularly recorded electrical activity (blue) from one cell and VSD population activity (red), indicate that, in vivo, VSD measures mostly subthreshold synaptic membrane potential changes. Spikes recorded in the intracellular recording are truncated to increase vertical scale, but spikes are indicated by blue lines at the top. Spikes were not detected in the optical signal
The spatial resolution of VSDI in awake animals is primarily limited by light scattering, movement artefacts and signal-to-noise ratio. Each camera pixel will receive fluorescence originating from dendrites, axons and somata belonging to a population of neurons. Since the VSD stains membranes, dendrites and axons will dominate the total observed fluorescence. Dendrites and axons can extend for considerable lateral distances, which could therefore strongly affect spatial resolution of VSDI. In practice, however, VSDI has been shown to provide high resolution maps clearly differentiating activity in nearby cortical columns (Petersen et al. 2003a; Ferezou et al. 2006) and offering a spatial resolution better than 50 μm (Shoham et al. 1999; Grinvald et al. 1999). One possible explanation may be that synaptic processing on different dendritic branches is spatially mapped with respect to cortical columns.
3 Imaging from Awake Behaving Animals
A major technical impediment to imaging in awake animals is movement of the brain, as is the case for all forms of in vivo brain imaging. Movements are of course particularly large during wakefulness and overt movements are often an integral part of behavioural paradigms in animal experiments. A critical aspect of imaging brain function during behaviour is therefore to obtain a stable view of the brain.
The most obvious paradigm is to fix the head relative to the imaging apparatus. Head-fixation is routinely applied in neurophysiological animal experiments and has proven to be extremely useful both in constraining behavioural variability and in facilitating measurements. Head-fixation bars can be attached to the skull of monkeys (Fig. 11.1) and mice (Fig. 11.2a). The animals rapidly learn to accept head-restraint during a period of behavioural habituation. As for imaging in anesthetised animals, a sealed recording chamber should be used to minimise brain movements relative to the skull. Furthermore, to facilitate staining in monkeys, the resected dura matter is substituted with artificial dura mater (Fig. 11.3). A careful cleaning procedure allowed repeated VSDI sessions in monkeys 2–3 times each week over a period longer than a year (Arieli et al. 2002).
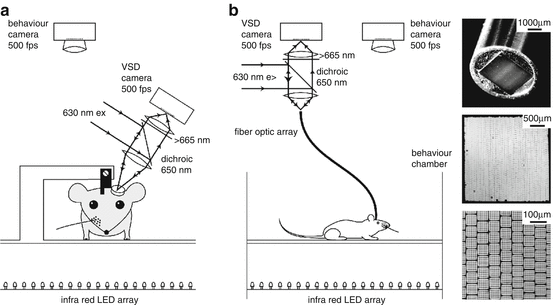
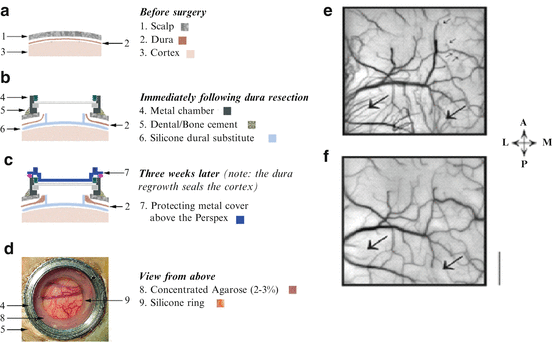

Fig. 11.2
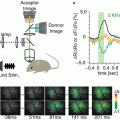
Voltage-sensitive dye imaging of awake and freely moving mice. (a) Setup for voltage-sensitive dye imaging of the sensorimotor cortex in an awake head-restrained mouse. An implanted metal head-fixation post is attached to a fixed mechanical arm. The tandem lens optics are turned to include as large an area of sensorimotor cortex as possible in the focal depth of the epifluorescence tandem lens optics. With the cortex stained with RH1691, the excitation light (630 nm) is reflected by a dichroic mirror (650 nm) and focused on the brain through an objective. Emitted fluorescence is collected by the same lens and imaged on to a fast camera with large well-depth. Simultaneous filming of behaviour enables correlation of neocortical activity with sensorimotor behavioural events. (b) For imaging freely moving mice, the experimental setup is almost identical, except that a flexible fiber optic image bundle relays light from the focal plane of the tandem lens imaging system to the mouse brain. The fibers are arranged in a orderly fashion at each end of the fiber (right). Each individual fiber measures 10 μm in diameter and they are assembled in a multistep process first involving 6 × 6 multifibers that are then wound to form a 300 × 300 array of fibers extending approximately 3 × 3 mm

Fig. 11.3
The silicone dural substitute for long-term chronic recordings. (a) Scalp, dura and cortex prior to the surgery. (b) When the dural substitute was positioned in its proper position, the cut edge of the natural dura was enfolded and touched the silicon ring in the middle of the sheet, in order to stabilize it and prevent the natural dura from growing back into the central area used for imaging. (c) Within a few weeks after the operation the dura had grown around the ring, thus creating a good seal of the cortex. (d) View from above 2 weeks after the artificial dural transplantation. (e, f) Cortical reaction to dural implant. The cortical vascularisation 12 months (e) and 3 months (f) after implantation of artificial dura. Note the new growth of blood vessels originating from the Lunate sulcus and other sites (big arrows). This neovascularization is different from the blood vessels over the cortical tissue since it has the shape of ‘hair like’ growth. Note that cortical blood vessels also react: the veins show new ‘growth cones’ which were directed towards the new microvascularization (small arrows)
A tandem-lens macroscope (Ratzlaff and Grinvald 1991) can then be mounted in a stable location relative to the fixed head position for epifluorescent voltage-sensitive dye imaging with suitable illumination and camera equipment (similar to that used for imaging anesthetised animals, except for additional equipment necessary for controlling and monitoring behaviour). Voltage-sensitive dye imaging of awake head-restrained mice (Petersen et al. 2003b; Ferezou et al. 2007) and awake head-restrained monkeys (Slovin et al. 2002; Seidemann et al. 2002; Omer and Grinvald 2008; Fekete et al. 2009) has begun to reveal cortical correlates of sensorimotor processing.
An alternative approach, which has been successfully tested in mice (Ferezou et al. 2006), is to image voltage-sensitive dye signals via flexible fiber optics (Fig. 11.2b). Fiber optic bundles containing well-ordered arrays of individual fibers are able to efficiently transmit images from one end of the fiber to the other. At each end, the fibers are held rigidly in place, but in between the ends, the fibers can run separately from each other allowing high flexibility and a considerable range of rotation. Under these conditions the animal is therefore relatively free to move around within the tether limits of the light-weight fiber optics. Excitation light can be passed in one direction through the same fibers that also relay emitted fluorescence back from the animal. One end of the fiber bundle can be placed in the location normally imaged by the tandem lens epifluorescence macroscope. The other end of the fiber optic image bundle can be placed in direct contact with the brain surface and firmly anchored on the skull. Movement artefacts are surprisingly small in this imaging configuration (Ferezou et al. 2006; Flusberg et al. 2008), perhaps because of correlated movement of the fiber bundle and the brain.
4 Integrating VSDI with Electrode Techniques
VSDI can easily be combined with standard electrode-based techniques. Whereas optimal mechanical stability for imaging is provided by sealed cranial windows, these do not allow electrodes to be introduced. One approach is to cover the cortical surface with agarose and stabilise it by a cover slip. A small gap between the edge of the cover slip and the wall of the recording chamber allows oblique entry of electrodes into the rodent cortex (Petersen et al. 2003a, b; Berger et al. 2007; Ferezou et al. 2006, 2007). For cats and monkeys a ‘sliding-top cranial window’ was developed with a removable microdrive-positioned electrode (Arieli and Grinvald 2002). VSDI can then be combined with microstimulation, extracellular recording (single- and multiple-unit recording and local field potential), or intracellular recording, and the targeted injection of tracers. Recordings can either be made simultaneously and/or can be targeted to specific regions based on the functional imaging data.
5 Imaging the Monkey Visual Cortex During Behaviour
5.1 Dynamics of the Spread of Retinotopically Evoked Activity in Macaque Visual Cortex
Using VSDI in awake behaving monkeys, Slovin et al. (2002) imaged cortical dynamics with high spatial and temporal resolution from the same patch of cortex for up to 1 year (Fig. 11.4). In the original study, the visual cortices of trained macaques were stained 1–3 times a week. Immediately after each staining session, the monkey started to carry out a simple behavioural task, while the visual cortex was imaged using VSDI. The first important task of this study was to show that such repeated use of VSDI does not interfere with normal cortical function. The functional maps obtained by VSDI were confirmed by imaging based on intrinsic signals (Grinvald et al. 1986) over a period of up to a year (Fig. 11.4b). Orientation preference maps can be used as a sensitive assay to assess any potential cortical damage since orientation preference is formed in the cortex itself rather than lower brain areas. The imaging results, as well as the behavioural performance, indicated that pharmacological side-effects or photodynamic damage were negligible. Having established this point, Slovin et al. (2002) studied the spatiotemporal representation of a point stimulus in primary and secondary visual cortex (Fig. 11.4c), quantifying the latency and time course of the cortical response (Fig. 11.4d). The individual traces indicate that evoked activity can be detected without signal averaging in the awake monkey, offering VSDI as an important tool to explore real-time cortical dynamics. This is beneficial because averaging may mask important variability among the instantaneous responses. In an example behavioural experiment, the cortical dynamics as the monkey makes a saccade are depicted in Fig. 11.5. Evidently despite the high speed of the eye movements, an evoked response was detected also along the cortical representation of the fast eye movement.
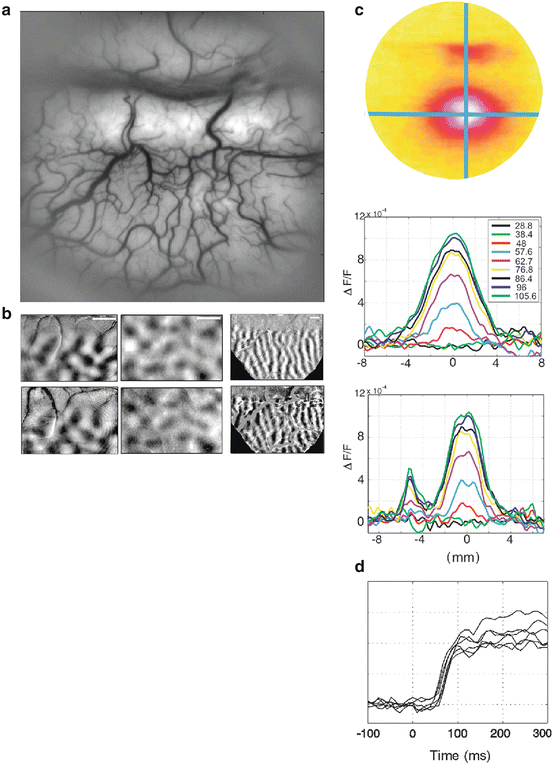
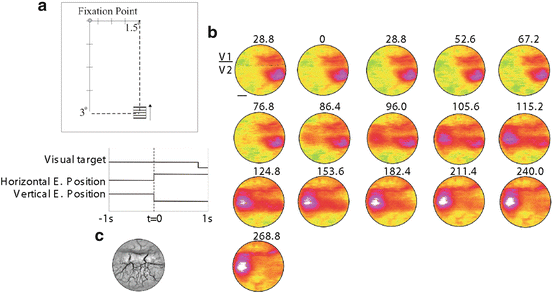

Fig. 11.4
Normal cortical architecture and function is preserved throughout long-term chronic VSDI for up to a year. (a) A large area of exposed cortex in excellent condition after almost a year of repeated VSDI, intrinsic imaging and electrical recording in this monkey. (b) The functional VSDI maps of ocular dominance in two sites (left and right) and orientation (middle), which were recorded from the same patch of cortex in recording sessions separated by up to a year, are virtually identical (compare top and bottom rows of images). (c) Dynamics of retinotopic activation. Top: retinotopic activation of V1 and V2 (width of cortical area about 14 mm). Bottom: the spread of cortical dynamics along horizontal (upper) and vertical (lower) axes as a function of time. Time is marked by different colours. (d) Single-trial evoked responses in the awake monkey. As in the anaesthetized animal, the response is variable. Scale bar: 1 mm

Fig. 11.5
Fast saccadic eye movement generates a cortical response along its track. (a) Schematic representation of the visual stimulus. (b) Time series of the average optical signal triggered by the onset of a saccade to the new visual stimulus averaged over 17 trials. The first few frames show the fully developed evoked response to the small (0.5°) single isoluminant drifting grating, which was turned on 500–800 ms earlier. After a saccadic eye movement to the stimulus (t = 0), the activity on the cortex is shifted to a more foveal location (lateral direction). The thin black line in the first frame denotes approximately the V1/V2 border. Scale bar 3 mm. (c) Black-and-white image of the blood vessel pattern from the imaged cortical areas, the V1/V2 border was detected by obtaining an ocular-dominance map with intrinsic imaging. A anterior, P posterior, L lateral, M medial
5.2 Visualization of Neuronal Assemblies
With the improvements in the signal-to-noise ratio of in vivo VSDI offered by the blue dyes, evoked activity can be detected without signal averaging in the awake monkey (Fig. 11.4d; Slovin et al. 2002), as previously found in anaesthetized cats (Arieli et al. 1995, 1996; Tsodyks et al. 1999; Kenet et al. 2003). This finding indicates that cortical spatiotemporal dynamics per se can now be explored in awake behaving monkeys. Hebb (1949) suggested that neocortical neurons operate in assemblies, defined as networks of neurons, local or widespread, that communicate coherently to carry out the computations that are required for various behavioral tasks. Neurons located within the same pixel of a VSDI movie might belong to the same or different neuronal assemblies. It is therefore of great interest to monitor the spiking activity of a single neuron in the context of larger network dynamics, to reveal the co-active nodes in the assembly during a given computation. This can be achieved by combining single unit (or multiple-unit recording) with real-time optical VSD imaging of the dynamics of coherent neuronal assemblies. First, a single unit with the desired tuning properties is selected. Second, VSDI and unit recordings are conducted for a long time without any signal averaging. During off-line analysis, which involves performing spike-triggered averaging on the optical data, the firing of a single neuron serves as a time reference to selectively visualize only the population activity that was synchronized with it. With a sufficient number of spikes, any neuronal activity not time-locked to these spikes will be averaged out and the net, clean spatiotemporal pattern of coherent activity will be thus obtained.
Such spike-triggered averaging of VSD signals can be performed on both evoked and spontaneous activity. Even in primary sensory areas, there is a large amount of spontaneous on-going electrical activity, primarily subthreshold activity, in the absence of any sensory input. Some of this activity is coherent over large cortical areas. Is this spontaneous activity just network noise? How large is it relative to evoked activity? Does it affect evoked activity? And does it have an important functional role? VSDI is ideally suited to exploring such questions at the level of neuronal assemblies. To compare the amplitude of coherent, ongoing activity with that of evoked activity (both representing large subthreshold activity, to which VSDI is sensitive), spike-triggered averaging was used during both spontaneous- and evoked-activity imaging sessions with anaesthetized cats (Grinvald et al. 1991; Arieli et al. 1995, 1996; Tsodyks et al. 1999; Kenet et al. 2003). Surprisingly, the amplitude of coherent, spontaneous, ongoing activity in neuronal assemblies was nearly as large as that of evoked activity. Large, coherent, ongoing activity was also found in the somatosensory cortex (Petersen et al. 2003b; Ferezou et al. 2006, 2007). The large fluctuations of ongoing activity affect how far cortical neurons are from their firing threshold. Therefore, the amplitude of ongoing activity indicates that it might have an important role in shaping spatiotemporal patterns evoked by sensory input. The idea that network activity can converge to cortical states is a central concept in theoretical brain research. What are the dynamics of intrinsic cortical states? It is now possible to visualize certain aspects of cortical networks and their states in action, at a high spatiotemporal resolution. Such studies can provide insights into the dynamic interplay between activated internal cortical representations and incoming sensory input. The previous studies on anesthetized cats are reviewed in the previous chapter. In those VSDI studies we reported that spontaneous ongoing cortical activity in areas 17 and 18 represented dynamic spatial patterns, and about 20 % of these patterns resembled the functional architecture of orientation domains. These patterns covered large cortical areas—up to the entire imaged areas of up to 6 × 6 mm (Grinvald et al. 1989; Arieli et al. 1995, 1996; Tsodyks et al. 1999; Kenet et al. 2003).
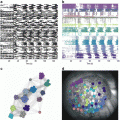
To find whether these results are relevant to the awake behaving primate, Omer and Grinvald (2008) performed VSDI of ongoing cortical activity in the visual cortices of awake monkeys simultaneously with measurements of single unit activity and the local-field potential. They found coherent activity also in the awake monkey (Fig. 11.6). This figure shows the tuning properties of the reference cell (Fig. 11.6a), the border between the two imaged areas V1 and V2 (Fig. 11.6b), time course of the coherent activity in area V1 (red) and V2 (blue; Fig. 11.6c) and the instantaneous spatial pattern of the assembly activity just before the action potential of the reference neuron (Fig. 11.6d). Overall, the dynamics were very different from that found in anesthetized cats and in a single epoch it was not possible to recognize any pattern that looked like the known functional architecture. Nevertheless, it was found that such patterns do appear: the pairwise correlation among pixels of known functional architecture as a function of the orientation difference between these pixels or their ocularity index had the same stereotypic shape for evoked activity and for spontaneous epochs. Similar results were obtained in anesthetized monkeys. However, in the anesthetized monkeys, Omer and Grinvald found that spontaneous cortical activity resembled the functional architecture just like in the anesthetized cat (unpublished). These results underscore the importance of carrying out experiments on awake behaving animals since the spatiotemporal patterns of activity are so drastically different.
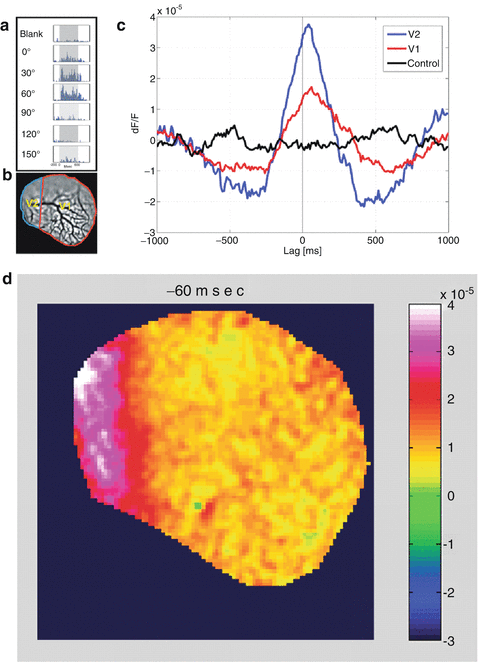

Fig. 11.6
Visualization of coherent neuronal assemblies across visual areas. (a) The tuning properties of a single cell in V1 of primary visual cortex of the awake monkey, which was used for the spike triggered averaging. (b) Cartoon of the imaged area showing the V1/V2 border that was identified by mapping the ocular dominance columns in V1. (c) The time course of spike triggered average (STA) of the optical signal from V2 (blue curve) as well as the optical signal from V1 (red curve) on the time of the firing of the V1 reference neuron. Evidently, whenever this cell fired, there was activity over a large area in V1 as well as V2. In fact, in this case, whenever this cell in V1 fired there was larger coherent activity in V2 than in V1. (d) The average spatial pattern 60 ms before the V1 action potential occurred is shown. Courtesy of David Omer and Amiram Grinvald; unpublished results
5.3 VSDI Reveals Complex Distributed Activity Evoked by Intracortical Microstimulation
Microstimulation in various brain regions has been used extensively to affect neuronal and behavioural responses. However, many questions remain about the spatiotemporal patterns of activity that are evoked by microstimulation and their characteristics as a function of various parameters such as the current strength and the electrode shape (Tehovnik et al. 2006).
Intracortical stimulation has been used as a tool to discover the pattern of muscle and/or movement representation in motor areas of the cortex (Slovin et al. 2003). The direct and synaptic spread of activation induced by stimulation has been the subject of considerable uncertainty and controversy. To help resolve some of these issues we used voltage sensitive-dye (VSD) imaging to examine the patterns of activation evoked by different stimulation parameters in the primary motor cortex (M1) of an awake monkey. Single cathodal pulses in M1 (15–30 μA, 0.2 ms duration) evoked short latency VSD responses that continued for 40–50 ms after the onset of stimulation. These responses spread in an asymmetric manner from the stimulation site in M1; the width of the activated area was about 1.5–3 mm. Single pulses larger than 15 μA also evoked activity at spatially separate sites within M1. Short trains of pulses in M1 (2–20 pulses, 330–500 Hz, 30–100 μA) produced activation that spread from the electrode site to adjacent premotor areas and to the contralateral hemisphere. A distinct hyperpolarization followed the activation evoked by a high current (>60 μA), short stimulus train (2–20 pulses). Finally, long stimulus trains (70 μA, 200 pulses, 330 Hz) evoked activation that spread over large portions of M1 and the adjacent premotor areas. These responses outlasted the stimulus train by several hundred milliseconds. Our results emphasize the importance of considering the spread of activation when evaluating the results of M1 stimulation.
VSDI studies on the effect of microstimulation in the frontal and motor cortices of awake monkeys have also recently shed light on the evoked spatiotemporal dynamics. The frontal eye field and neighbouring area ‘8Ar’ of the primate cortex are involved in the programming and execution of fast eye movements. Electrical microstimulation in these regions elicits short-latency contralateral saccades. A combination of VSDI and microstimulation has been used to determine how the spatiotemporal dynamics of microstimulation-evoked activity are converted into saccade plans. Microstimulation was shown to elicit neural activity with complex spatiotemporal dynamics, both inhibitory and excitatory; these dynamics depend on the stimulated area, and have important behavioural correlates. The observed spread was large and depended on the amplitude of the microstimulation (Seidemann et al. 2002). These results emphasize the importance of further characterization of microstimulation-evoked activity for the interpretation of its behavioural effects and what it has revealed about the neural basis of cognition (Newsome et al. 1989; Cohen and Newsome 2004). VSDI seems to be one of the most appropriate tools to nail down these issues, which also have important implications for neural prosthesis and brain machine interfaces.
Stay updated, free articles. Join our Telegram channel

Full access? Get Clinical Tree


