, along with a Lagrangian description of the structure that is immersed in the fluid, described by  . Interactions between the Lagrangian (
 ) and Eulerian (
 ) fields are achieved by integral transforms with a Dirac delta function kernel
  . In brief, the IB form of the equations of motion is:
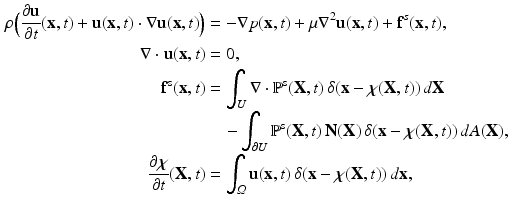
 is the mass density,
  is the viscosity,
  is the Eulerian velocity filed of the system,
  is the Eulerian pressure field,
  is the Eulerian elastic force density.
  denotes the physical position of material point
  at time t, and
  is the exterior unit normal at
  .
.  is the first Piola-Kirchoff stress tensor, which is related to the Cauchy stress
  of the immersed structure by
  , in which
  is the deformation gradient.
  is determined from the material properties by strain energy functional W by
  . Readers may refer to [8] for more details of the IB/FE method.
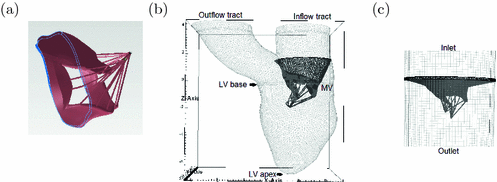
Fig. 1.
The MRI-derived MV model (a), the MRI-derived MV-LV model (b), and the MV-tube model (c).
A cardiac magnetic resonance (CMR) study was performed on a healthy young volunteer. The study was approved by the local NHS Research Ethics Committee, and written informed consent was obtained before the CMR scan. Twelve imaging planes along the LV outflow tract view were imaged to cover the MV with cine images. Typical parameters were: slice thickness: 3 mm; in-plane pixel size: 0.7 0.7 mm
 , field of view: 302
  400 mm
 ; frame rate: 25 per cardiac cycle. The MV geometry was reconstructed from a stack of cine images at early-diastole when it first opens, as shown in Fig. 1(a), with sixteen chordae distributed evenly and running through the leaflet free edges to the annulus ring. Details on the subject-specific MV reconstruction from CMR images are similar as in [6, 13]. Short-axial and long-axial cine images were also performed to cover the LV region. Typical parameters were: slice thickness: 10 mm; in-plane pixel size: 1.3
  1.3 mm
 ; frame rate: 25 per cardiac cycle. The LV geometry including the inflow and outflow tracts was reconstructed from the same volunteer at early of diastole just before the MV opens (Fig. 1(b)) [5]. The MV geometry is mounted to the inflow tract according to the relative positions derived from the CMR images. This forms the integrated MV-LV model. Following the work in [6], the MV is also fixed to a housing disc and mounted to a rigid outer tube (Fig. 1(c)), this forms the MV-tube model.
 0.7 mm
 , field of view: 302
  400 mm
 ; frame rate: 25 per cardiac cycle. The MV geometry was reconstructed from a stack of cine images at early-diastole when it first opens, as shown in Fig. 1(a), with sixteen chordae distributed evenly and running through the leaflet free edges to the annulus ring. Details on the subject-specific MV reconstruction from CMR images are similar as in [6, 13]. Short-axial and long-axial cine images were also performed to cover the LV region. Typical parameters were: slice thickness: 10 mm; in-plane pixel size: 1.3
  1.3 mm
 ; frame rate: 25 per cardiac cycle. The LV geometry including the inflow and outflow tracts was reconstructed from the same volunteer at early of diastole just before the MV opens (Fig. 1(b)) [5]. The MV geometry is mounted to the inflow tract according to the relative positions derived from the CMR images. This forms the integrated MV-LV model. Following the work in [6], the MV is also fixed to a housing disc and mounted to a rigid outer tube (Fig. 1(c)), this forms the MV-tube model.
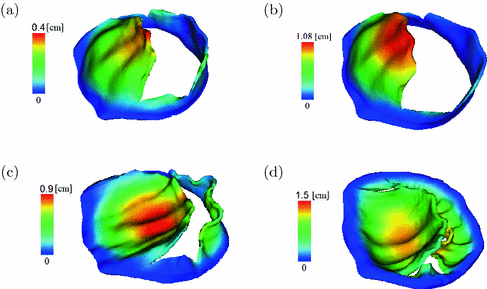
Fig. 2.
The fully opened MV in (a) the MV-LV model, (b) the MV-tube model (b). The closed MV in (c) the MV-LV model, and (d) the MV-tube model (d). Coloured by the displacement. The colour figure can be found in the online version.

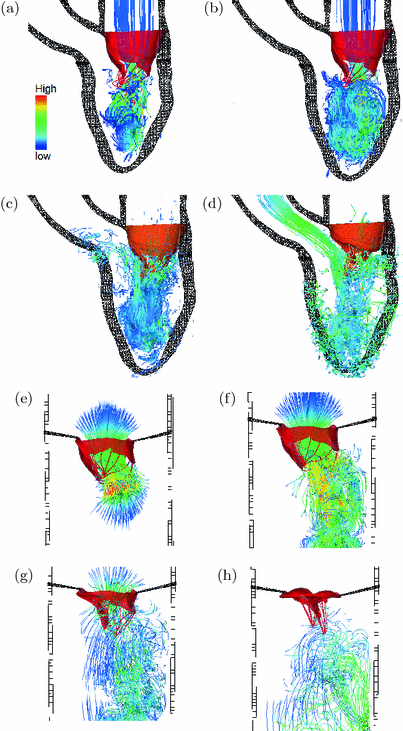
Fig. 3.


Streamlines in the MV-LV model at the early diastolic filling (a), at the late diastolic filling (b), when the MV is closing (c), and at the middle of the systolic ejection (d). Streamlines in the MV-tube model at the early diastolic filling (e), at the late diastolic filling (f), when the MV is closing (g) and when the MV is fully closed (h). Coloured by the velocity magnitude, and the colour figure can be found in the online version.
Stay updated, free articles. Join our Telegram channel

Full access? Get Clinical Tree


