Fig. 10.1
Patterns of coronary calcification by IVUS. Calcification is defined as superficial (a) or deep (b) when the leading edge of the attenuated signal is within the shallowest or deepest 50 % of the plaque plus media thickness, respectively. Spotty calcification is defined as an arc of calcification that is <90° and only 1–4 mm in length (c). Calcified nodules defined as calcium protruding into the lumen and having an irregular and convex luminal surface (d). IVUS intravascular ultrasound (arrows point to the abnormalities described)
The term spotty calcification is defined as an arc of calcification that is <90° and only 1–4 mm in length [2]. When imaging a vessel with IVUS, spotty calcification may be important to recognize, as it has been associated with accelerated atheroma progression [2] and is found in roughly half of culprit lesions in acute myocardial infarction [4]. Consequently, spotty calcification has been proposed as a possible marker of plaque vulnerability [2, 4].
Calcified nodules are evident by IVUS as calcium protruding into the lumen and having an irregular and convex luminal surface [3, 5]. Calcified nodules are associated with older age, and perhaps surprisingly have been found to be associated with severe calcification of the corresponding angiogram in only 1 % of cases [5]. Rather, calcified nodules are associated with a normal angiogram in over 80 % of cases [5]. Although pathologic studies have identified calcified nodules as a rare trigger of coronary thrombosis [6], a recent analysis of the PROSPECT data demonstrated that the presence of a calcified nodule by IVUS represented an independent predictor of freedom from future coronary events [5].
Attenuated Plaque by IVUS
Attenuated plaque by IVUS is characterized as attenuation of the ultrasound signal in the absence of overlying calcification (Fig. 10.2) [7–9]. When visualized with IVUS, attenuated plaque may in some cases represent lipid-rich plaque, as histologic analyses have demonstrated attenuated plaques by IVUS to contain greater amounts of lipid, cholesterol clefts, and necrotic core compared to non-attenuated plaques [8, 10]. Although attenuated plaque is frequently present at culprit lesions in acute coronary syndromes [11], the concept that attenuated plaque is a marker of plaque vulnerability has been challenged by data demonstrating the stability of such lesions over time [12].
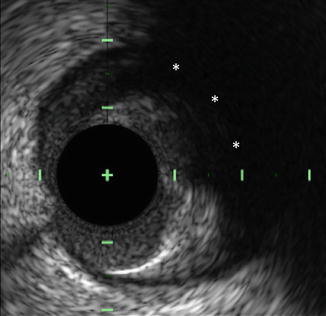
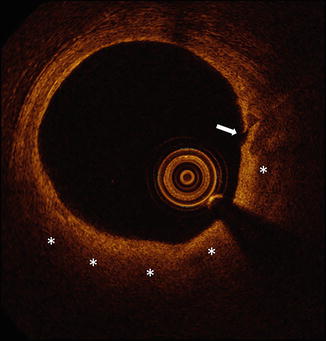
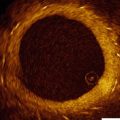
Fig. 10.2
Attenuated plaque by IVUS. Attenuated plaque by IVUS is characterized as attenuation of the ultrasound signal (asterisks) in the absence of overlying calcification. Histologic analyses have demonstrated attenuated plaques to contain greater amounts of lipid, cholesterol clefts, and necrotic core compared to non-attenuated plaques. IVUS intravascular ultrasound
Perhaps the most important reason to recognize attenuated plaque by IVUS is that the presence of attenuated plaque at the target site prior to percutaneous coronary intervention (PCI) is an independent predictor of both angiographic no-reflow and peri-procedural myocardial infarction [8, 9]. Importantly, the association between attenuated plaque and these acute PCI-related complications has been demonstrated in both ACS patients and those with stable angina [8, 9]. Finally, the circumferential extent of attenuation may also be important in determining the risk of PCI-related complications [7, 13].
Plaque Burden by IVUS
Defined as the plaque plus media cross-sectional area divided by the external elastic membrane cross-sectional area [1], plaque burden has been demonstrated to be an independent predictor of adverse cardiovascular events [14, 15]. More specifically, the presence of a plaque burden ≥70 % was associated with a 9.6 % lesion-specific event over 3 years and was the strongest independent predictor of future events in the PROSPECT trial [14]. More recently, large plaque burden has been demonstrated to be an independent predictor of lesion progression in the PREDICTION study [16]. A description of how to measure plaque burden is provided in Fig. 10.3.
Fig. 10.3
Measuring plaque burden by IVUS. An IVUS image of an intracoronary plaque is shown (left). In order to measure the plaque burden of this lesion, the EEM (blue line, right) and the lumen (orange line, right) are traced. The difference between the EEM cross-sectional area and the lumen cross-sectional area is equal to the plaque plus media cross-sectional area. Plaque burden is then calculated as the plaque plus media area divided by the EEM area. The presence of a plaque burden ≥70 % is associated with a 9.6 % lesion-specific event rate during follow-up and is an independent predictor of both site-specific future events and lesion progression. EEM external elastic membrane, IVUS intravascular ultrasound
Plaque Characterization by VH-IVUS
VH-IVUS, which uses radiofrequency analysis of backscattered IVUS signals to identify plaque composition, classifies intracoronary plaque as fibrotic, fibrofatty, densely calcified, or necrotic core (Fig. 10.4). These various VH-IVUS plaque components are each represented on the image display by a different color, wherein green represents fibrotic plaque, light green represents fibrofatty plaque, white represents densely calcified plaque, and red represents necrotic core plaque [17] (Fig. 10.4). A VH-fibroatheroma is defined as a lesion having >10 % necrotic core. If a VH-fibroatheroma has >30° of the necrotic core abutting the lumen in three consecutive frames (approximately 1.5 mm in length) it is considered a VH-thin cap fibroatheroma (VH-TCFA) [14, 15]. Alternatively, if the necrotic core is not adjacent to the lumen, the lesion is considered a VH-thick capped fibroatheroma [14, 15] (Fig. 10.5). VH-IVUS can be used to define several additional lesion types, including pathologic intimal thickening, fibrotic plaque, and fibrocalcific plaque, the definitions of which are summarized in Table 10.1.
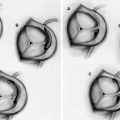
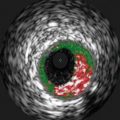
Fig. 10.4
VH IVUS plaque characterization: VH IVUS revealing Fibrous (top left), Fibrofatty (top right), Fibrocalcified (bottom left), and necrotic (bottom right) plaques (From Murray [39]. J Am Coll Cardiol Intvn 2013;6:838–846 with permission
Fig. 10.5
Types of atherosclerotic plaque identified by VH. IMT intimal medial thickness, PIT pathological intimal thickness, FT fibrotic, FA non calcified thick cap fibroatheroma, Ca FA calcified thick cap fibroatheroma, TCFA thin cap fibroatheroma, CaTCFA calcified thin cap fibroatheroma (From Cheng et al. [40] with permission)
Table 10.1
Lesion classification by VH-IVUS
Lesion type | Definition |
|---|---|
Pathologic intimal thickening | ≥15 % fibrofatty tissue |
<10 % confluent necrotic core | |
<10 % confluent dense calcium | |
Fibrotic plaque | Mainly fibrous tissue |
<10 % confluent necrotic core | |
<10 % confluent dense calcium | |
Fibrocalcific plaque | Mainly fibrous tissue |
<10 % confluent necrotic core | |
>10 % confluent dense calcium | |
Thin-cap fibroatheroma | >10 % confluent necrotic core |
>30 % of necrotic core abuts the lumen in ≥3 consecutive frames | |
Thick-cap fibroatheroma | >10 % confluent necrotic core |
Necrotic core does not abut the lumen in ≥3 consecutive frames |
Prior to performing PCI, plaque characterization using VH-IVUS may be useful to assess the risk of peri-procedural complications during PCI. The presence of VH-IVUS necrotic core at the PCI target site has been associated with the occurrence of angiographic no-reflow, peri-procedural myocardial infarction, and distal embolization [18–22]. The concept that necrotic core plaque by VH-IVUS is associated with acute PCI-related complications has been further demonstrated in a recent meta-analysis [23].
Apart from its use to assess the risk of peri-procedural complications, VH-IVUS has also been studied to identify lesions at risk of causing future coronary events. In the PROSPECT trial, nearly 700 patients with acute coronary syndromes underwent multi-vessel VH-IVUS imaging to identify lesion characteristics predictive of future coronary events [14]. Approximately half of all patients in PROSPECT were found to have at least one non-culprit VH-TCFA at baseline. Over approximately 3 years of follow-up, the presence of a VH-TCFA at baseline was an independent predictor of subsequent major adverse cardiovascular events, most of which were rehospitalizations for unstable or progressive angina. Despite this finding, the identification of a VH-TCFA was associated with a limited positive predictive value for future events, as only 26 of the 595 VH-TCFAs identified at baseline triggered a recurrent cardiovascular event during the 3 years of follow-up. A similarly low lesion-specific event rate for VH-TCFA was demonstrated in the VIVA study [15]. This low event associated with a VH-TCFA can be partially overcome in the presence of additional plaque characteristics, as lesions characterized as VH-TCFA that also had a minimal luminal area of 4.0 mm2 or less and a plaque burden of at least 70 % had a lesion specific event rate was 18 % during follow-up [14].
Plaque Characterization by OCT
Plaque Morphology by OCT
The unique plaque characterization abilities of intracoronary OCT imaging are attributable to its superb spatial resolution, which is approximately tenfold higher than the resolution of IVUS. With an axial resolution of 10–20 μm [24, 25], OCT is the only intracoronary imaging modality capable of assessing the fibrous cap covering coronary atheroma [24, 25]. Visualization of the fibrous cap allows for detection of plaque rupture (Fig. 10.6) and for the measurement of fibrous cap thickness. Although its spatial resolution is superior to that of IVUS, OCT is not able to assess plaque burden in many cases due to a limited depth of signal penetration. Despite this limitation, OCT can identify several plaque types including calcification, fibrous plaque, lipid-rich plaque, and OCT-derived TCFA.
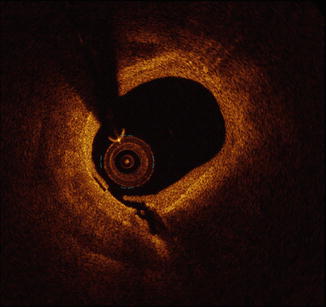
Fig. 10.6
Plaque rupture by OCT. Shown is an example of plaque rupture of a lipid-rich plaque by OCT. At present, OCT is the only available intracoronary imaging modality with sufficient spatial resolution to visualize the fibrous cap covering coronary atheroma. Owing to this superb spatial resolution, disruption of the fibrous cap can detected by OCT, similar to the example depicted here. OCT optical coherence tomography
Calcification and Fibrous Plaque by OCT
Calcified plaque by OCT is defined as the presence a signal-poor region having well-defined margins (Fig. 10.7). It is important to recognize that by OCT calcification may in some cases be difficult to differentiate from lipid-rich plaque, as both plaque types are defined by the presence of signal-poor regions [25]. In contrast to these signal poor lesions, fibrous plaque by OCT is defined by relatively homogenous signal-rich plaque [24, 25]. An example of fibrous plaque visualized by OCT is demonstrated in Fig. 10.8.
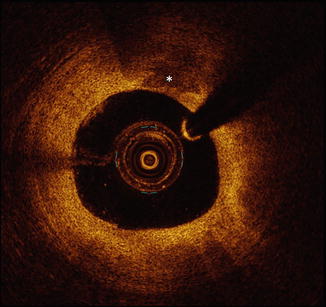
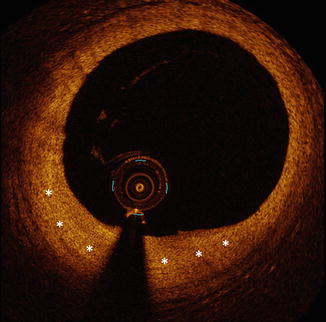
Fig. 10.7
Calcification by OCT. Calcified plaque by OCT is defined as the presence a signal-poor region having well-defined margins (asterisks). When using OCT, it is important to recognize that calcification may in some cases be difficult to differentiate from lipid-rich plaque, as both plaque types are defined by the presence of signal-poor regions. Calcification and lipid-rich plaque are differentiated by their margins, which are well-defined in calcification and are poorly-defined in lipid-rich plaque. OCT optical coherence tomography
Fig. 10.8
Fibrous plaque by OCT. Fibrous plaque by OCT is defined by relatively homogenous signal-rich plaque (asterisks). Unlike lipid-rich plaque and calcification, which can sometimes be difficult to differentiate, fibrous plaque is easily recognized by OCT imaging. OCT optical coherence tomography
Lipid-Rich Plaque and OCT-Derived Thin Cap Fibroatheroma
Lipid-rich plaque is characterized by OCT as signal-poor region with poorly-defined borders [24, 25]. In order for a plaque to be considered lipid-rich, some studies have required the signal poor region to extend >90° [26–28]. If the fibrous cap overlying the lipid rich plaque measures <65 or 70 μm, the plaque is defined by OCT as a TCFA [26–28]. An OCT-derived TCFA is depicted in Fig. 10.9.