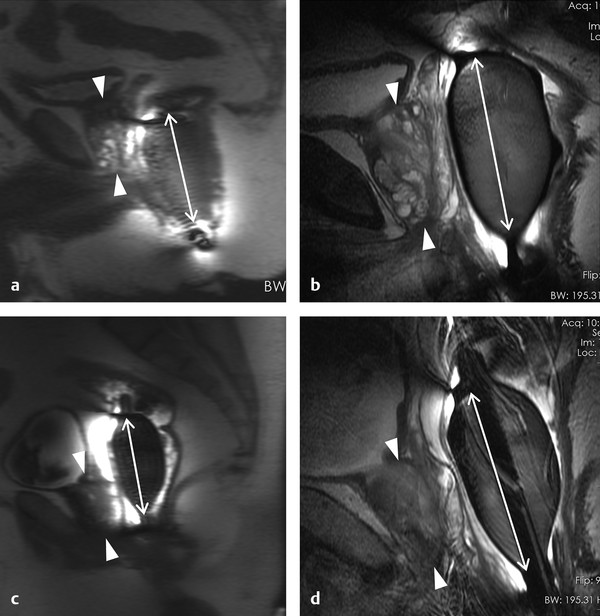
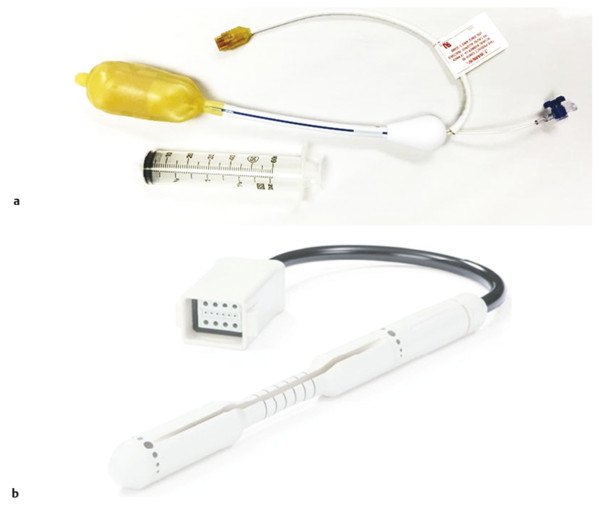
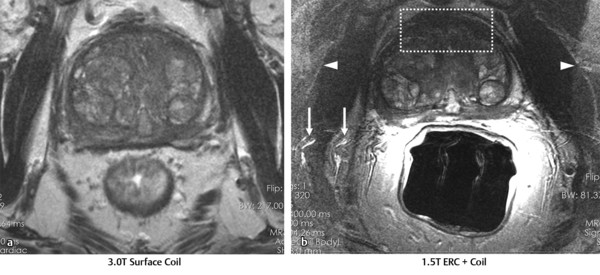
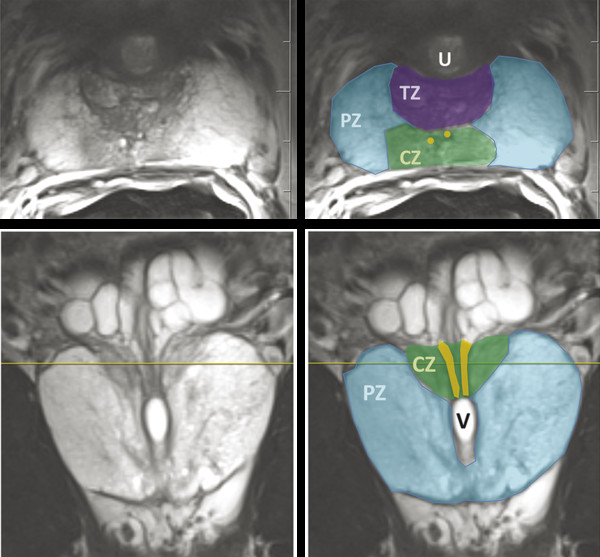
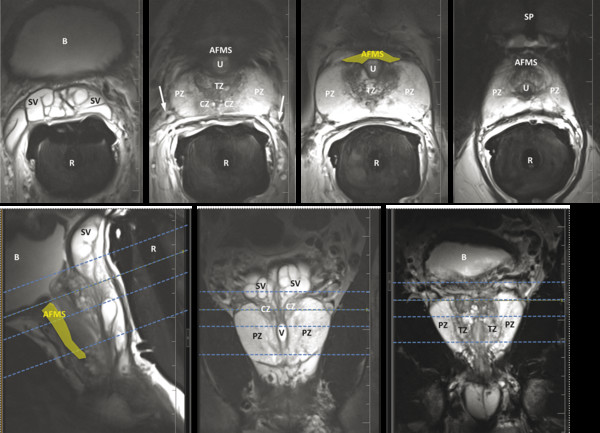
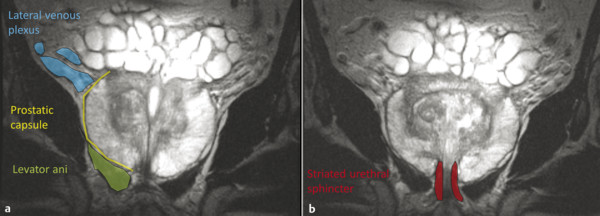
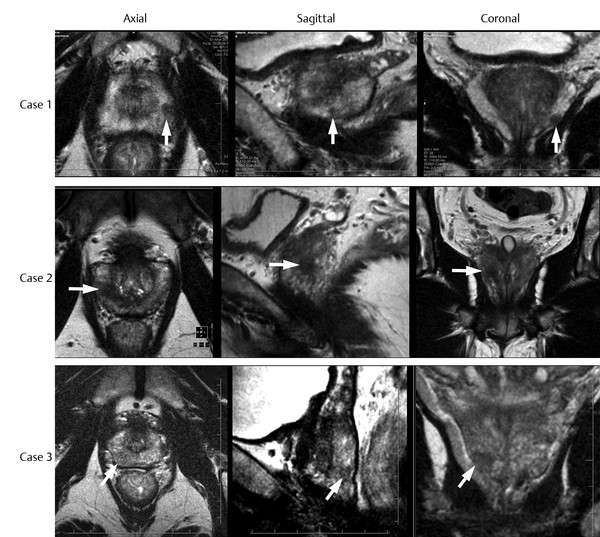
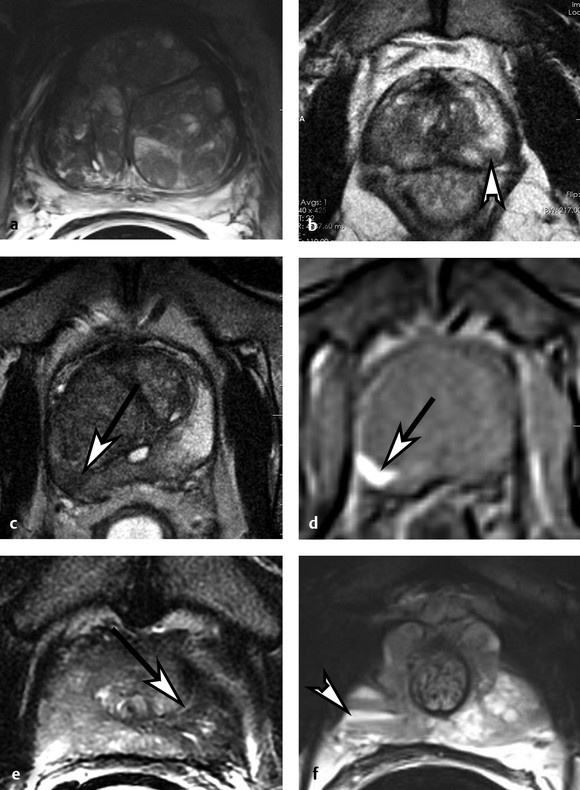
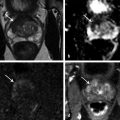
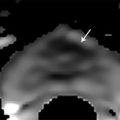
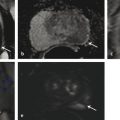
Hardware Requirements Though initially established at 1.5 T, 1 mpMRI of the prostate is increasingly performed at 3.0 T in both clinical and research settings. 2, 3 The primary benefit of imaging at 3.0 T over 1.5 T is the increase in signal-to-noise ratio (SNR), which scales approximately linearly with field strength, 4 providing a theoretical doubling of the available SNR. In practical terms, the SNR gain is less than 100% at 3.0 T due in part to safety considerations. The SNR increase at 3.0 T may be exploited to improve the image quality in sequences with intrinsically low SNR such as DWI and MRSI. Alternately, increased SNR can be used to improve spatial resolution in anatomical (T2-weighted) images, allowing for a decrease in voxel volume and providing more precise delineation of prostate anatomy and pathology. Increased SNR can also be used to decrease scan time and improve temporal resolution in DCE-MRI, and improve spectral resolution in MRSI. However, the move to 3.0 T is associated with a number of technical challenges. radio-frequency (RF) power deposition, as quantified by the specific absorption rate (SAR), increases with the square of the main magnetic field strength, resulting in a theoretical quadrupling of power deposition at 3.0 T. Thus, some sequences may require alteration to their conventional parameters to stay within power deposition limits set by the U.S. Food and Drug Administration and European Union. For example, T2-weighted fast spin-echo (FSE) sequences may be modified to employ a partial rather than a complete refocusing pulse, or utilize a variable flip angle 3.4.2 Artifacts and Pitfalls to reduce SAR. 5, 6 These changes are usually sufficient to meet current safety regulations for prostate examinations at 3.0 T. 2 Small changes in tissue T2 values occur with the transition from 1.5 T to 3.0 T. 7, 8 However, these changes are not very pronounced, and generally do not require much alteration in the optimal TE (echo time). 3, 9, 10 Susceptibility effects are also more severe at high field strengths, which is particularly relevant for MRSI and DWI acquisitions (see 3.4.2 Artifacts and Pitfalls). Lower field strength (1.5 T) is therefore preferred in the presence of metallic implants such as hip prostheses, in order to minimize susceptibility artifacts. Homogeneity of the main field is also more difficult to maintain at 3.0 T, which may lead to signal variability across the image. The above limitations can be minimized using modern MRI systems. When properly optimized, both 1.5 T and 3.0 T magnets can provide adequate diagnostic quality for prostate MRI in clinical practice. However, there is a general consensus that the advantages of imaging at 3.0 T over 1.5 T when this option is available outweigh the disadvantages in most settings. For example, staging accuracy of biopsy-proven local prostate cancer was shown to be improved at 3.0 T compared to 1.5 T at a single institution. 11, 12 However, there remains a paucity of large studies comparing the same patients at both field strengths using otherwise equivalent hardware and acquisition techniques. Until such studies are available, it is reasonable to assume that the improvements in image quality at 3.0 T, particularly the improved spatial resolution in T2-weighted anatomical imaging, could result in improved staging performance. Prostate MR imaging at field strengths less than 1.5 T is not recommended. Introduced in the late 1980s, the principle behind the endorectal coil (ERC) is to minimize the distance between the prostate and the receiver coil and to maximize the signal obtained from the gland and adjacent anatomy. Similar to imaging at higher field strengths, the primary benefit of using an ERC is improved SNR. When compared to conventional pelvic phased-array surface coils, the increase in SNR provided by an ERC is approximately tenfold. 13 Conventional ERC designs include a single RF coil element contained within a balloon which is inflated to tightly approximate the coil with the adjacent prostate (eCoil; Medrad Inc, Warrendale, PA). However, if the balloon is filled with air, significant susceptibility artifacts may result (see 3.4.2 Artifacts and Pitfalls). To minimize these artifacts, the balloon should be filled with a susceptibility-matched fluid such as perfluorocarbon or barium. 14 The proper positioning of an inflatable ERC is illustrated in ▶ Fig. 3.1. Fig. 3.1 Proper positioning of an inflatable endorectal coil (ERC) filled with barium. Top row: Scout image (a) shows malpositioning of the ERC with the sensitive portion of the coil (double-ended arrow) positioned inferiorly and incompletely covering the prostate gland (arrowheads). (b) Sagittal T2-weighted image following advancement of the coil shows correct positioning, with the entire gland located within the sensitive portion of the coil. Bottom row: Scout image (c) shows malpositioning of the ERC with the sensitive portion of the coil positioned superiorly and incompletely covering the prostate gland. (d) Sagittal T2-weighted image following partial withdrawal of the coil shows correct positioning, with the entire gland located within the sensitive portion of the coil. Note the presence of motion ghosts in image (d), which occur along the phase-encoding (in this case, superior–inferior) direction. (Used with permission from Haider MA, Krieger A, Elliott C, et al. Prostate imaging: Evaluation of a reusable two-channel endorectal receiver coil for MR imaging at 1.5T. Radiology 2014;270:556–565.) Noninflatable rigid endorectal coils have been developed (Endo Coil Array; Hologic Inc, Bedford, MA) ( ▶ Fig. 3.2). Rigid coils are associated with reduced geometric distortion of the gland and provide increased SNR compared to inflatable coils. 15, 16 Recently, a multichannel rigid ERC was shown to provide even greater SNR improvement. 17 Disadvantages of the rigid ERC design include increased motion artifacts (the inflated balloon is thought to reduce movement of the rectal wall) and the need for disinfection between patients due to the nondisposable nature of the currently approved device. Fig. 3.2 Examples of ballon-inflatable and rigid endorectal coils. (a) A typical single-channel balloon-inflatable endorectal receiver coil (eCoil, Medrad Inc, Warrendale, PA), and a 60-cm3 syringe used for balloon inflation. The blue stripe indicates the anterior (sensitive) direction of the coil. (b) A two-channel solid reusable phased-array endorectal receiver coil (Endo Coil Array, Hologic Inc., Bedford, MA). The rigid coil design includes two overlapping coil elements spanning the 8.5-cm long coil head. The maximum diameter is 2.5 cm, significantly narrower at the level of the anus when properly positioned. (b reproduced with permission from Haider et al, 2014 17.) The ERC is typically employed in combination with a pelvic phased-array (PPA) coil in order to maximize SNR, although the ERC can also be employed independently. Combined use of ERC and PPA coils harnesses the high SNR of ERC and the wide field of view (FOV) of PPA coil designs. When combined with a PPA coil, the signal within the prostate gland is typically dominated by the contribution from the ERC rather than the PPA (> 90%). 18 Endorectal coils are particularly advantageous for larger patients, where PPA coils may be limited by the greater distance from the body surface to the prostate. Use of an ERC has been shown to improve staging accuracy for prostate cancer compared to PPA coils alone at both 1.5 T and 3.0 T. 11, 19 However, ERC use is not without its disadvantages, which are summarized in ▶ Table 3.1. Contraindications to ERC are provided in ▶ Table 3.2. 19 Advantages Disadvantages Increased spatial resolution for T2-weighted anatomical imaging Increased temporal resolution for DCE-MRI Increased SNR for intrinsically low SNR sequences (DWI, MRSI) Increased artifacts (phase ghosts) Geometric distortion of the prostate gland Increased cost of examination Increased procedure time Patient preference/discomfort Signal dropoff in anterior gland Abbreviations: DCE, dynamic contrast-enhanced; SNR, signal-to-noise ratio; DWI, diffusion-weighted imaging; MRSI, magnetic resonance spectroscopic imaging. Contraindications Anal fissures and strictures Previous anorectal surgery, including rectal surgery with end-to-end anastomoses Inflammatory bowel disease High anal sphincter tone preventing ERC insertion Large hemorrhoids Using 1.5T without an endorectal coil for staging is controversial and considered suboptimal by many. However, other factors contribute to overall SNR beyond field strength and ERC use, for example, receiver bandwidth, coil design, and RF chain efficiency. While the improved image quality of 3.0 T and ERC are desirable, factors such as cost, equipment availability, and patient acceptance must also be taken into account. Clinical prostate MRI is performed with multichannel PPA receiver coils, either independently or in combination with an ERC. Many centers use a multichannel cardiac surface coil, as this provides increased central pelvic SNR in thinner patients. Current recommendations stipulate use of at least an 8- or 16-channel array, and at least a 16-channel array if used independently of an ERC. 20 While some authors have advocated ERC use at 1.5 T in order to obtain diagnostic-quality images in a reasonable time frame, 19, 21, 22 current guidelines accept the use of PPA coils alone at 1.5 T, provided a modern 16-channel coil is used. 20 An ERC is strongly recommended for MRSI at 1.5 T. 2 Several studies indicate that 3.0-T imaging with a PPA coil provides similar image quality to 1.5-T imaging with an ERC and similar accuracy for local staging of prostate cancer, 23, 24, 25, 26 suggesting that 3.0-T imaging with PPA coils may provide an alternative for patients in whom an ERC is unacceptable, contraindicated, or unavailable. However, there is also evidence that imaging at 3.0 T with an ERC improves prostate cancer detection 27 and staging accuracy 11 compared to imaging at 3.0 T with surface coils alone. Thus, while 3.0-T prostate MRI performed without an ERC may be an attractive option from both the patient’s and the physician’s perspective, it is important to understand the trade-offs involved in forgoing the use of the ERC. A recent study of 51 tumors in 20 patients who underwent 3.0-T MRI with and without an ERC showed higher sensitivity and positive predictive value for tumor detection with ERC, in part due to improved detection of small tumors. 27 Comparative images obtained at 1.5 and 3.0 T with and without an ERC are shown in ▶ Fig. 3.3. Fig. 3.3 Influence of field strength and receiver coil design on image quality. (a) Axial T2-weighted image acquired with a cardiac phased-array surface coil at 3.0 T (voxel volume = 0.5 × 0.5 × 3.0 mm, number of excitations (NEX) = 2, acquisition time 305 s). (b) Axial T2-weighted image in the same patient acquired using the same surface coil in combination with an endorectal coil (ERC) at 1.5-T (voxel volume = 0.27 × 0.43 × 3.0 mm, NEX = 1, acquisition time 136 s). Despite the shorter acquisition time, lower field strength, and decreased voxel volume, the image obtained with an ERC provides improved soft tissue detail within the posterior gland due to the large signal-to-noise ratio (SNR) gain provided by the ERC. The improvement related to the ERC is less apparent in the anterior gland, where signal drop-off and increased noise (graininess) are observed (dotted box in image b). Note the presence of phase ghosts (arrows) typically seen with ERC use. Aliasing is also apparent (arrowheads), which is attributable to the surface coil rather than the ERC itself. In summary, the need for the endorectal coil is controversial. Many experts believe that staging accuracy is maximized with the use of an ERC at 3.0 T. However, for cancer localization, many groups are performing MRI at 3.0 T without an ERC. The most challenging hardware combination is an older 1.5-T MRI system without an ERC. Such systems may be more limited in the detection of smaller cancers and minimal extraprostatic extension. The use of such a hardware configuration should be undertaken with caution. Prostate MRI protocols should be tailored to the specific patient, clinical setting, and available equipment. At a minimum, high-resolution T2-weighted anatomical images and diffusion-weighted images (DWI) should be included in all prostate MRI protocols. While routine acquisition of dynamic contrast-enhanced (DCE) images is also advised, the additive value of this sequence is currently an area of controversy (as discussed in Chapter 5). Additional anatomical sequences (e.g., T1-weighted images) and functional sequences (e.g., MRSI) may be included depending on the clinical scenario, as discussed below. However, unnecessary sequences should be avoided, as this prolongs the duration of the study, increases patient discomfort, and may decrease patient compliance. T2-weighted imaging forms the backbone of any prostate MRI examination, due to its ability to delineate zonal anatomy and to detect, localize, and stage cancer, including assessment for extraprostatic extension (EPE) and seminal vesicle invasion (SVI). Two-dimensional multiplanar T2-weighted images should be acquired in the axial plane and in at least one other orthogonal plane (coronal or sagittal), and preferably in all three planes, using a fast spin-echo sequence (also called turbo spin-echo or rapid acquisition with relaxation enhancement). Axial images should be in a plane orthogonal to the rectum with complete coverage of the prostate gland and seminal vesicles. Adequate coverage is typically obtained with 20 to 30 slices using a 3- to 4-mm slice thickness and no slice gap. The echo time (TE) should be chosen to maximize contrast between the peripheral and transition zones and between prostate cancer and normal glandular tissue based on their intrinsic T2 values. At 1.5 T, the T2 values of cancerous tissue, the transition zone, and the peripheral zone are reported as 82 ms, 88 ms, and 122 ms, respectively. 28 A TE of approximately 100 to 130 ms is typically used to achieve optimal image contrast between these tissues, with a TR of 2 to 5 s. The phase-encoding direction should be set to left–right and the frequency-encoding direction to anterior–posterior in order to prevent phase ghosting artifacts related to rectal motion from obscuring the prostate gland. High spatial resolution is required to precisely delineate prostatic anatomy and assess for extraprostatic extension. Long echo trains (greater than ~ 35) should be avoided to reduce associated image blurring and loss of spatial resolution. Recommended minimum T2-weighted imaging parameters according to the PI-RADS version 1.0 consensus statement guidelines are provided in ▶ Table 3.3. 20 Protocol considerations / imaging parameters Recommendation Field strength 1.5 T or 3.0 T Receiver coils 8- or 16-channel pelvic phased-array coil ± endorectal coil (optional but desirable) Antiperistaltic agent Buscopan or glucagon Planar orientation Axial and sagittal 2D T2-weighted images, ± coronal images Slice thickness 4 mm at 1.5 T, 3 mm at 3.0 T Slice gap None In-plane resolution 0.5 × 0.5 to 0.7 × 0.7 mm Field of view Must encompass entire prostate gland and seminal vesicles (approximately 12–20 cm). Source: Adapted from PI-RADS consensus statement, cancer detection protocol, Barentz et al, 201220 In addition, three-dimensional (3D) T2-weighted fast spin-echo sequences may be employed as an adjunct to conventional two-dimensional (2D) multiplanar images, for example 3D VISTA (Philips Medical Systems, Best, The Netherlands), 3D SPACE (Siemens Healthcare, Erlangen, Germany), and 3D FSE-Cube (GE Healthcare, Milwaukee, WI). These sequences use prolonged echo trains with variable flip angles to efficiently obtain high-resolution isotropic 3D images. Isotropic acquisition may be particularly useful in delineating fine anatomical details and in discriminating between true lesions and partial volume averaging. For example, 3D T2-weighted images have been shown to improve the delineation of the neurovascular bundles in patients with previous nerve-sparing radical prostatectomy. 29 Because 3D acquisitions can be reformatted in arbitrary planar orientations, these sequences may one day replace 2D multiplanar T2-weighted images in clinical practice, which would provide significant time savings (in one study, 3 min 52 s for 3D isotropic SPACE acquisition vs. 11 min for 2D FSE images in three orthogonal planes). 30 However, tissue contrast is not identical between 2D and 3D T2-weighted images, 31 and in some cases contrast in 3D images may be inferior for prostate cancer detection. Further, 3D MR imaging is generally more motion sensitive than 2D multislice imaging and cannot at present match the high (submillimeter) in-plane resolution of 2D imaging sequences. Because of these limitations, multiplanar 2D imaging remains the standard for clinical practice. The anatomical divisions of the prostate as reported by McNeal 32 are well demonstrated on T2-weighted imaging ( ▶ Fig. 3.4; ▶ Fig. 3.5). In the craniocaudal direction, the gland is divided into the base (below the bladder), midgland, and apex. Histologically, the gland is divided into four zones: the anterior fibromuscular stroma, which is partially continuous with the detrusor muscle of the bladder wall; the transition zone (TZ) surrounding the urethra; the central zone (CZ) surrounding the ejaculatory ducts; and the peripheral zone (PZ). The TZ makes up an inconsequential portion of the gland in young men, but accounts for an increasing proportion with advancing age and development of benign prostatic hyperplasia (BPH) and gives rise to about 20% of prostate cancers. The PZ contains the majority of the glandular tissue (~ 70%), and gives rise to about 70% of prostate cancers. 33 Fig. 3.4 Color-coded zonal anatomy of the prostate on T2-weighted MRI. Top row: Axial images. Bottom row: Coronal images. Left column: Unmarked images. Right column: Color-coded overlay delineating anatomical zones of the prostate. The central zone (CZ, green) is a vertical wedge of tissue lateral to the ejaculatory ducts (yellow) with its base cephalad to the gland capsule. The transition zone (TZ, purple) is located adjacent to the urethra (U) proximal to the level of the verumontanum and is the site of benign prostatic hyperplasia (BPH) nodules. The peripheral zone (PZ, blue) appears as a homogeneously hyperintense crescent along the posterior and lateral aspects of the gland. See text for further discussion. A prostatic utricle cyst is noted (V). The horizontal line on the coronal images indicates the slice location for the corresponding axial images. Fig. 3.5 Normal prostate anatomy on T2-weighted MRI, continued. Top row: Sequential axial images from above the level of the base to the level of the apex of the prostate. Bottom row: One sagittal and two coronal images (middle image is more posterior, right image is more anterior) with dashed lines indicating the slice locations for the sequential axial images. B, bladder; SV, seminal vesicles; R, rectum; AFMS, anterior fibromuscular stroma (highlighted in yellow on selected images); U, urethra; TZ, transition zone; PZ, peripheral zone; CZ, central zone. On axial T2-weighted images, the PZ appears as a homogeneously hyperintense crescent of tissue along the posterior and lateral gland. In older studies, the CZ and TZ were often grouped together as the “central gland,” described as having a heterogeneously intermediate- to low-signal on T2-weighted images. More recently, it has been shown that the TZ and CZ can be accurately differentiated on MRI, with the CZ appearing as a region of more homogeneously low T2 signal in the majority of patients. 34 Hence, the term “central gland” should be avoided. The prostate is separated from adjacent soft tissues by the prostate capsule, which appears as a thin hypointense rim surrounding the gland ( ▶ Fig. 3.6). This serves as an important marker for extraprostatic extension. Note that the prostate lacks a true capsule, and the so-called prostate capsule histopathologically represents a thin band of concentric fibromuscular tissue, which is incomplete anteriorly and apically. The neurovascular bundles are located posterolateral to the gland in the 5 o’clock and 7 o’clock positions and serve as an important route of extraprostatic extension. Fig. 3.6 Normal periprostatic anatomy on coronal T2-weighted MRI. The lateral venous plexus (blue overlay) consists of serpiginous vascular structures extending along either side of the prostate gland lateral to the seminal vesicles, with associated chemical shift artifact due to the multiple interfaces created between the serpiginous veins and adjacent periprostatic fat. The prostatic pseudocapsule (yellow overlay) appears as a thin hypointense line surrounding the prostate gland, serving as an important marker for extraprostatic extension. The normal appearance and orientation of the levator ani muscle (green overlay) and striated urethral sphincter (red overlay) is also depicted. In general, PZ pathology on T2-weighted imaging appears hypointense on a bright background of normal glandular tissue. Prostate cancers within the PZ appear as round or ill-defined hypointense focal lesions ( ▶ Fig. 3.7). However, this appearance is nonspecific, and benign entities such as prostatitis, atrophy, hemorrhage, scars, and post-treatment changes may mimic PZ cancer ( ▶ Fig. 3.8). 35 Cancers within the TZ pose a greater challenge in detection, as the signal characteristics of cancer and the transition zone may overlap. 36 These lesions typically appear as a homogeneous mass with ill-defined margins (“erased charcoal” or “smudgy fingerprint” sign), and may have a lenticular, water-drop, or spiculated shape ( ▶ Fig. 3.9). Higher-grade malignancies tend to have lower T2 signal intensity than lower-grade tumors. 37 Fig. 3.7 Peripheral zone cancer on orthogonal multislice T2-weighted images. Axial (left), sagittal (middle), and coronal (right) images demonstrate typical appearance of peripheral zone cancer. Case 1 (top row): Images from a 69-year-old man with prostate-specific antigen (PSA) of 7.95 ng/dL demonstrate a circumscribed hypointense nodule within the left lateral peripheral zone at the apex (confirmed Gleason score [GS] 7 cancer). Case 2 (middle row): Images from a 74-year-old man under active surveillance with rising PSA demonstrate a homogeneously hypointense nodule in the right lateral peripheral zone at the level of the midgland (confirmed GS 9 cancer). Case 3 (bottom row): images from a 56-year-old man with rising PSA of 2.2 ng/dL demonstrate a more subtly hypointense nodule in the right posterior lateral peripheral zone at the apex (confirmed GS 7 cancer), which was better demonstrated with diffusion-weighted imaging. This case illustrates the importance of separate orthogonal planar acquisitions for identification and characterization of prostate tumors, particularly near the base and apex. The lesions in all cases are diagnosed with more confidence when the nodular appearance is confirmed on sagittal and coronal images. Fig. 3.8 Benign prostate pathology and cancer mimics on T2-weighted imaging. (a) Benign prostatic hyperplasia (BPH), appearing as encapsulated nodules with circumscribed margins within the transition zone (TZ). Nodules containing more stromal elements are typically T2 hypointense, whereas those containing more glandular elements are T2 hyperintense. Areas of cystic atrophy in BPH in the TZ also appear T2 hyperintense. (b) Prostatitis, seen as a bandlike or wedge-shaped areas of T2 hypointensity within the peripheral zone (PZ, arrowhead). Prostatitis may also appear as diffuse hypointensity on T2-weighted images. (c) Hemorrhage, seen as an area of T2 hypointensity within the PZ (arrow) could mimic malignancy. Corresponding T1-weighted image (d) shows characteristic hyperintensity confirming the diagnosis of hemorrhage (arrow). (e) Fibrosis and granulomatous inflammation, appearing as a large area of low signal intensity within the left peripheral zone (arrow), which could mimic a peripheral zone cancer with extraprostatic extension. This case highlights the need for correlation of T2-weighted images with additional functional imaging sequences to improve specificity for cancer detection. (f) Dilated periprostatic veins, which can mimic peripheral zone cancer on other sequences (e.g., diffusion-weighted or dynamic contrast-enhanced images), but can be clearly identified as veins with fluid hematocrit levels on high-resolution T2-weighted images. Note the presence of a hematocrit level (arrowhead), confirming the diagnosis.
3.2.1 Field Strength
3.2.2 Endorectal Coils
3.2.3 Surface Coils
3.3 Pulse Sequences
3.3.1 T2-Weighted Imaging
Imaging Technique
Anatomy on T2-Weighted Imaging
Pathology on T2-Weighted Imaging
Related posts:
Stay updated, free articles. Join our Telegram channel

Full access? Get Clinical Tree


