Left and Right Ventricular Structure and Function
Robert W. W. Biederman
Perhaps no better utilization for cardiovascular magnetic resonance (CMR) can be seen in its application to evaluate the structure and function of the left ventricle (LV). Long established as the “gold standard” for accurate quantification of ejection fraction, CMR has remained the reference standard for nearly the last two decades. The high resolution offered by CMR, initially in the form of fast gradient-recalled echoes (GREs) and, for most of the early 2000s, steady state free precession (SSFP)-based sequences, have permitted an unparalleled ability to accurately delineate myocardium and blood pools. This capability allows accurate differentiation between blood and myocardium, generating highly reproducible and clinically relevant measurements of wall thickness and chamber volume (see Figs. 8-1 to 8-8).
High resolution (matrices ranging from 1282 to 5122)
High endocardial and epicardial intrinsic contrast
Absence of foreshortening, due to exact placement of anatomy by prescription
Near absence of any user-dependence limitation
Reproducibility and accuracy to within 5 mL of volume
Not dependent on any geometric assumptions
Ability to perform three-dimensional (3D) imaging for exact measurements quickly (no absolute need for 2D anymore)
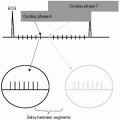
Volume-time measurements
Regional LV quantification; visually and/or quantitatively
Moderate to high temporal resolution
The assessment of left and right ventricular function is performed by measuring changes in volume between diastole and systole. While many techniques have the capability to perform this, the reliability, reproducibility, and accuracy of CMR have placed it at the forefront as the “gold standard” for over two decades in that reliance on 2D techniques are not necessary. 3D CMR techniques carrry with them the critically important advantage of being not only user independent and geometrically not reliant on mathematical formulas to derive quantitative measurements but also to be applicable in a variety of pathologies. Deformed ventricles from a variety of pathologic conditions, including ischemic heart disease, no longer “fit” into the classical prolate ellipsoid, and as such, deviate from the underlying assumptions of a natural ellipse of rotation. Contiguous short-axis slices therefore, when contoured and assembled in order, provide the capability to measure the most unusual and distorted LVs and RVs. For conditions in which reliable measurements of volume, despite distortion, are required, for instance, in cases of LV aneurysms being considered for LV reduction surgery (Dor procedure) or for measurement of ejection fraction in the dilated and irregular ventricle for the placement of an automatic internal cardiac defibrillator (AICD), an accurate mechanism to quantitate LV function is important for the patient, physician and for socioeconomic considerations, avoiding needless placement of expensive technologies or inadvertent withholding of life-saving interventions.
As interventions become more and more advanced, they will, no doubt, be restricted to the population by inclusion and exclusion criteria in large part determined by ejection fraction. Therefore, a technique that has the lowest standard deviation and variance should be considered to be the ideal test to assess these patients. CMR, as stated in the preceding text, has long held that distinction.
Similarly, but to an even greater degree, the evaluation of the RV is classically difficult because of its inability to conform easily to any standard geometric formulae. Therefore, techniques that are reliant on 2D evaluations will always be inferior to those that use 3D. This becomes extraordinarily cumbersome and
frustrating, as we recognize so many manifestations of disease that effect the RV, often to an even greater extent than the LV. Assessment of diseases such as pulmonary arterial hypertension, arrhythmogenic right ventricular dysphasia (ARVD), right-sided valvular heart disease, most congenital heart disease, and other right ventricular cardiomyopathies is greatly aided by the use of CMR, that can be used to measure not only the thin-walled RV, providing mass estimations, but also provide volumetric information. As is true for the LV, Simpson rule is applied to stacks of contiguous slices contoured for either volume or mass, and is now routinely performed in most laboratories, using breath-hold images obtained using SSFP in <10 minutes, including contouring when using automatic or semiautomatic software (see Figs. 8-6 and 8-7).
frustrating, as we recognize so many manifestations of disease that effect the RV, often to an even greater extent than the LV. Assessment of diseases such as pulmonary arterial hypertension, arrhythmogenic right ventricular dysphasia (ARVD), right-sided valvular heart disease, most congenital heart disease, and other right ventricular cardiomyopathies is greatly aided by the use of CMR, that can be used to measure not only the thin-walled RV, providing mass estimations, but also provide volumetric information. As is true for the LV, Simpson rule is applied to stacks of contiguous slices contoured for either volume or mass, and is now routinely performed in most laboratories, using breath-hold images obtained using SSFP in <10 minutes, including contouring when using automatic or semiautomatic software (see Figs. 8-6 and 8-7).
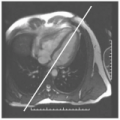
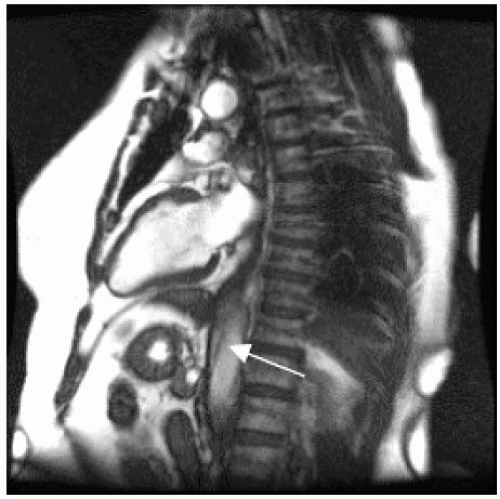 FIGURE 8-1 Steady state free precession (SSFP) image demonstrating the two-chamber (long-axis) plane. The two-chamber view is acquired from the axial plane and provides the most comprehensive information of LV structure and function because it specifically delineates the territory subtended by the left anterior descending (LAD), that is, the anterior and apical walls. The inferior wall territory is also demonstrated. Mitral valve anatomy and pathology can be well appreciated in this plane when seen in motion. Note the subtle descending aortic dissection (arrow) also seen in the “normal” patient. Left ventricular anatomic determination is made possible due to the unconstrained ability to obtain images in any plane, necessary independent of the orientation of the LV to the axis of the body. This allows cardiovascular magnetic resonance (CMR) to depict anatomy in a true cardiac axis perspective independent of the distortion due to cardiac perturbations such as congenital heart disease or due to extra cardiac deformities such as pectus excavatum. |
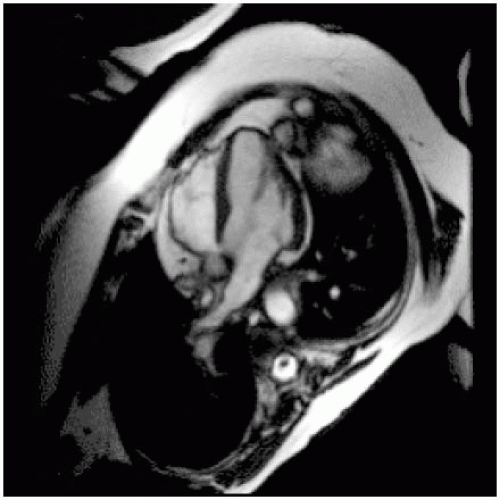 FIGURE 8-2 Acquired from a two-chamber view, this acquisition provides information about the inferior septum and lateral wall, and is the most definitive view for assessment of the right ventricle, including evaluation of tricuspid annular excursion (TAPSE). Additional information regarding the mitral and tricuspid valves, including morphology and pathology (regurgitation and stenosis can also be obtained). |
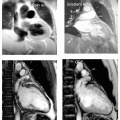
Evaluation of left ventricular systolic function is performed in a variety of approaches as shown in Fig. 8-9, incorporating 2D and 3D SSFP sequences to define ejection performance, regional motion abnormalities, as well as allow quantification of left ventricular mass. In this example, a 67-year-old white man presents with a 2-week history of chest pain that culminated in syncope while at church. His examination demonstrated a harsh 5/6 systolic ejection murmur radiating up to the right carotid artery. He had a prominent and focal nondisplaced point of maximal intensity (PMI) with a palpable S4, and as expected, an auscultatable S4. He presents for CMR under the presumption that he had severe aortic stenosis. In the top panels the extensive left ventricular hypertrophy (LVH) is appreciated in the presurgical state whereas the lower panels depict the CMR images 6 months following aortic valve replacement. Note the decrease in LV size, extent of LVH, and the minimal paramagnetic effect from the artificial valve. Additionally, the right panels depict intramyocardial strain (radiofrequency [RF] tissue tagging) and visually, the improvement in mechanical deformation is easily and dramatically detectable, despite very severe prevalve replacement left ventricular ejection fraction (LVEF).
Analysis of ventricular function can be performed in several ways. We acquire standard 2D images of
the two-, three-, and four-chamber views


the two-, three-, and four-chamber views
Related posts:
Stay updated, free articles. Join our Telegram channel
Full access? Get Clinical Tree
