Magnet Design
Mark Doyle
OVERVIEW
Magnets and magnet design are central to the field of magnetic resonance imaging (MRI), and although the main magnet is the dominant feature of the MRI system, there are several other magnets, each with their own design and performance characteristics, that determine the performance level of the system. Topics covered in this chapter are as follows:
Field strength, 1.5 T versus 3 T
Determinants of signal-to-noise ratio (SNR)
Design of magnets
○ Static field
○ Radiofrequency (RF)
1.5 T VERSUS 3 T FIELD STRENGTH
Historically, the 1.5 T magnetic systems have dominated the market for commercial systems, and this situation has prevailed for approximately 15 years. Currently, 3 T systems are vying for the position as the new standard, and there is rapid adoption of this field strength for neurologic and body imaging applications. However, at the time of writing, the advantages for cardiovascular magnetic resonance (CMR) applications are not as straightforwardly appreciated. There are several aspects that can be considered in comparing 1.5 T and 3 T systems:
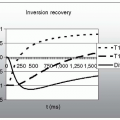
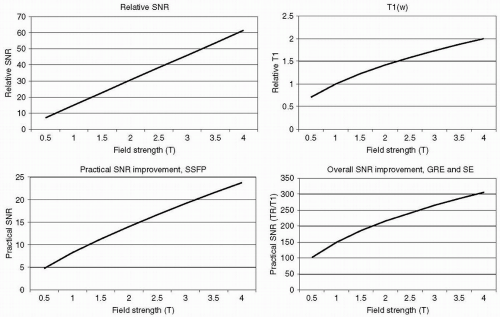
SNR and field strength. As the field strength increases, the number of spins that are “unmatched” increases and thereby the signal increases. For a fully relaxed imaging sequence (i.e., a proton density-weighted imaging sequence) the effective SNR increases linearly over the range 0.1 to 5 T (see Fig. 25-1). Therefore, the gain in SNR from 1.5 to 3 T for this sequence is effectively 100%.
T1 and field strength. The T1 relaxation process involves energy exchanges between the spin system and the lattice. The energy required to achieve the T1 exchange is dependant on field strength; however the lattice only possesses a finite amount of energy, in the form of bodily heat, and therefore the T1 time increases with field strength (see Fig. 25-1). From 1.5 to 3 T the T1 increases by approximately 50%.
GRE, SE, SNR, and field strength. The SNR in gradient and SE imaging sequences (but not SSFP) depends on the ratio TR/T1.
Taking the signal gain and the T1 dependence of GRE and SE sequence into account, the observed SNR improvement becomes muted compared to the gains expected purely from signal strength considerations. Comparing 3 to 1.5 T the effective SNR should increase by approximately 40% (see Fig. 25-1).
SPECIFIC ABSORPTION RATE AND FIELD STRENGTH
SAR is the measure of how much RF power is deposited in the body. Power is the rate of doing or absorbing work. In the United States, the U.S. Food and Drug
Administration (FDA) guidelines limit the SAR, as follows:
Administration (FDA) guidelines limit the SAR, as follows:
3 W per kilogram over the whole body
8 W per kilogram over a local region
 |
Because the RF power level increases as the square of the field strength, a 90- degree pulse at 3 T requires four times the amount of power compared to 1.5 T. Therefore, at 3 T, duty cycles may have to be reduced to avoid overheating.
MAGNETS
In an MRI system there are several distinct magnetic fields in use:
Main static magnetic fieldRelated posts:

Stay updated, free articles. Join our Telegram channel

Full access? Get Clinical Tree