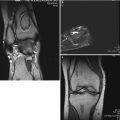
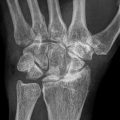
Fig. 60.1
A 7-year-old male complaining of left groin pain and limping for 1 year. This patient was treated in another institution with physiotherapy but no restriction of activities. When the patient presented for a second opinion, he had a very stiff hip with less than 10° of abduction with hips extended. (a) AP radiograph showing fragmented and deformed epiphysis on the left side with lateral extrusion. (b) MR T2 image showing a depression into the lateral epiphysis by the edge of the acetabulum and the extruded epiphyseal segment impinging of the labrum (arrow). (c) Hip arthrogram following a percutaneous hip adductor tenotomy showing a bilobed femoral head with a depression in the central portion of the femoral head which is filled with contrast. Other findings are flat, rectangular acetabulum and relief of the labral impingement upon abduction of the leg (arrow). This patient was treated with Petrie casts for 6 weeks followed by an A-frame abduction brace for 8 months and weight-bearing restrictions. (d) AP pelvis radiograph with the patient in the A-frame brace showing femoral head containment
60.2.3 Differential Diagnosis
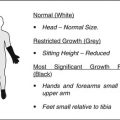
Since LCPD is a diagnosis of exclusion, known causes of juvenile femoral head osteonecrosis or conditions mimicking LCPD must be ruled out (Table 60.1). A careful history should include questions about previous medications to rule out corticosteroid-induced osteonecrosis, previous hip surgery or trauma, and recent trauma. Careful review of family history is important to screen for history of blood disorders (sickle cell disease, coagulopathy, thrombophilia, and thalassemia) and skeletal dysplasias (multiple epiphyseal dysplasias, spondyloepiphyseal dysplasia, Meyer’s dysplasia). Physical examination should also include assessment of facial features, spine, skin, and other extremities for skeletal dysplasia or a systemic condition. If there is concern from the medical history, additional lab work can be drawn looking for a low glucocerebrosidase level (Gaucher’s disease), a high thyroid-stimulating hormone level (TSH) (hypothyroidism), and other chromosomal abnormalities (Klinefelter’s syndrome and trisomy 21). In particular when both hips are affected in synchronous fashion, multiple epiphyseal dysplasia, spondyloepiphyseal dysplasia, and hypothyroidism must be strongly considered as the cause of bilateral epiphyseal changes resembling LCPD (Fig. 60.2).
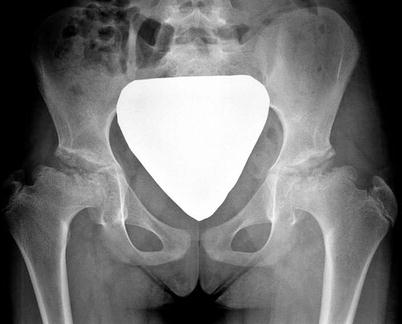
Table 60.1
Differential diagnosis of femoral head osteonecrosis and hip pain
Condition | Symptoms/signs | Diagnostic investigations |
|---|---|---|
LCPD | Acute or chronic presentation | Radiographs, MRI |
Insidious onset, intermittent | ||
Able to ambulate and participate in sports | ||
Septic arthritis | Acute pain in hip/knee | Lab: complete cell count, erythrocyte sedimentation rate and C-reactive protein |
Acute onset | Ultrasound | |
Painful to weight bear | Joint aspiration | |
Unilateral | ||
Systemic symptoms | ||
Significantly decreased ROM | ||
Transient synovitis | Acute onset | Lab work: complete cell count, erythrocyte sedimentation rate and C-reactive protein |
Prior history of viral illness | Ultrasound | |
Unilateral | ||
Mild systemic symptoms | ||
Decreased ROM | ||
Improves within 48 h | ||
Sickle cell disease | Anemia or jaundice | Hemoglobin electrophoresis |
Pain crisis | Complete cell blood count with differential | |
Splenic sequestration | Genetic testing | |
Family history | ||
Hypothyroid | Unilateral or bilateral hip pain | Lab studies: thyroxine (T4) levels and thyroid-stimulating hormone (TSH) |
Fatigue and exercise intolerance | Ultrasound thyroid | |
Course dry hair and skin | ||
Cold Intolerance | ||
Signs of hypothyroidism | ||
Multiple epiphyseal dysplasia and other skeletal dysplasias | Joint pain and fatigue | Radiographs/skeletal survey |
Bilateral complaints | Genetic testing (COL9A2/3 and COMP genes) | |
Waddling gait | ||
Deformities in hands and feet | ||
Family history |
Fig. 60.2
A 10-year-old female complaining of bilateral hip pain. AP radiograph showed epiphyseal fragmentation and resorption along with short, broadened femoral neck and a break in Shenton’s line, similar to LCPD. This patient had a family history of multiple epiphyseal dysplasia
60.3 Diagnostic Imaging
Several different imaging techniques are available to diagnose LCPD. Each technique has advantages and disadvantages and will be described within this section of the chapter.
60.3.1 Plain Radiography
Plain radiography remains the primary diagnostic assessment tool for LCPD. An anteroposterior (AP) and frog-leg lateral radiograph of the pelvis are used to determine the radiographic stage of the disease (see Waldenström’s four stages of disease below), the extent of head involvement and serial progression of the disease. Catterall [4, 12] described a series of classic head at risk signs during the progression of the disease including lateral subluxation, Gage’s sign (V-shaped radiolucency in the lateral portion of the epiphysis and/or adjacent metaphysis), calcification lateral to the epiphysis, and horizontal alignment of the growth plate. These are, however, late radiographic signs of a head at risk for having a poor prognosis. Much research effort has been expended to use earlier radiographic features to determine the prognosis and the long-term outcome. Catterall, Salter-Thompson, and lateral pillar classifications described below are such classifications which can be used in the fragmentation stage of the disease to prognosticate outcome, whereas the Stulberg classification is used at the healed stage near or at skeletal maturity. Most of these classifications based on categorizing certain radiographic features are prone to subjectivity and poor to moderate interobserver reliability [13, 14].
Although radiography is useful in assessing disease progression, it lacks the sensitivity and specificity needed to demonstrate changes during the early stages of the disease (Fig. 60.3). Radiographic changes consistent with femoral head osteonecrosis may become evident about 3–4 months after their actual onset, and standard radiographic findings may be entirely normal in early symptomatic disease [15–19]. Furthermore, current radiographic classification systems for prognosticating outcomes (Catterall and lateral pillar classifications) have limitations in the early stages, as they cannot be applied until the fragmentation stage of the disease when significant deformity has already occurred. There is a clear need for the development of a more sensitive prognostic indicator to assist in decision making during the early stages of LCPD [20].
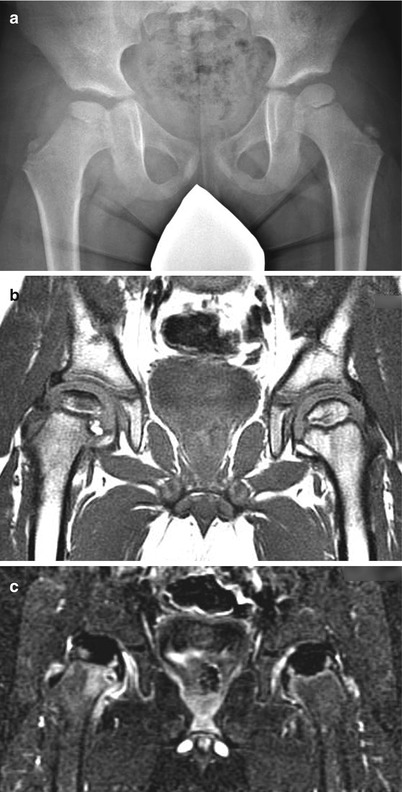
Fig. 60.3
A 5-year-old male complaining of right hip pain for 2 months. (a) AP radiograph shows right femoral head in the initial stage of LCPD with increased radiodensity and slight depression of the superior aspect of the epiphysis. (b) Non-contrast T1 image showing a noticeable signal decrease in the right epiphysis but no notable decrease in the left epiphysis. (c) Contrast-enhanced T1 with subtraction technique showing the loss of blood flow to the right epiphysis and unsuspected loss of blood flow to the left epiphysis not detected on the non-contrast images. This patient became symptomatic on the left side 5 months later and also developed radiographic signs of the initial stage of LCPD on that side
60.3.2 Ultrasonography
Ultrasonography can be sometimes used in the early stages of LCPD to demonstrate a joint effusion in a child presenting with a limp. In addition to demonstrating an effusion, ultrasonography has the potential to illustrate the profile of the cartilaginous femoral head and can allow for dynamic examination [21]. Nauman et al. [22] developed a four-stage classification system based on ultrasonography and sonoanatomic criteria for patients with LCPD. Vascular supply to the femoral head has also been demonstrated by Doppler ultrasonography [23] and through microbubble contrast enhancement [24]. Despite these applications for ultrasonography, it is not widely used as a diagnostic tool due to user dependence and unfamiliarity with the techniques.
60.3.3 Scintigraphy
Technetium scanning is a sensitive means of diagnosing LCPD in the early stages before it is evident radiographically. Prior to the availability of magnetic resonance imaging (MRI), bone scan was commonly used to diagnose the condition in the early pre-radiographic stage of the disease. Scintigraphy has also been used to classify the severity of the disease in the early stages, with grade I representing one-fourth epiphyseal involvement and grade IV representing complete involvement [25]. Care must be taken, however, as early bone scan may at times suggest a more severe condition than actually exists.
Revascularization during the stages of LCPD has also been classified using scintigraphy. Conway [26] and Tsao [16] classified revascularization as either recanalization of existing vessel (the type A track or pathway) or neovascularization – new vessel formation (the type B track of pathway). The A pathway is characterized by early appearance of a lateral column formation in the capital femoral epiphysis, indicating uncomplicated, rapid revascularization which can take place over a matter of days. In contrast, the B pathway is characterized by centrally located scintigraphic activity arising from the base of the femoral epiphysis and represents a much slower process of new vessel formation, which occurs over many months to years. This classification scheme precedes radiographic changes by an average of 3 months. Unfortunately it is possible for the healing pattern to change from the A to B pathway, termed the type C pathway. Although rare, this phenomenon makes prognostication difficult [16]. Van Campenhout et al. [27] found a significant correlation between vascularization pattern and the Catterall and lateral pillar classifications. They recommended serial scintigraphy in the early evaluation of the patient with LCPD. However, the application of the classification requires two serial scintigrams and the classification lacks validity regarding tissue confirmation of recanalization and neovascularization. Despite the evidence to suggest its utility, the exposure to ionizing radiation and the inability to provide cross-sectional imaging are significant barriers to current wide spread use of this technique, in particular as MRI has become more accessible.
60.3.4 Computed Tomography
Computed tomography (CT) is able to provide accurate three-dimensional images demonstrating the shape and relationship of the femoral head and acetabulum and provide early diagnosis of bone collapse, curvilinear zones of sclerosis, and subtle changes in bone trabecular pattern [20, 28]. Although a classification scheme exists for patients with LCPD [29], CT is not typically used on a routine basis to evaluate patients with LCPD because of the comparatively high radiation dose [30]. CT may be useful in the later stages of LCPD to differentiate between an area of incomplete reossification within the femoral head and a true osteochondrotic lesion in symptomatic patients [31].
60.3.5 Arthrography
Hip arthrography is utilized to demonstrate the dynamic relationship between acetabulum and femoral head in various leg positions. Often in the early stage of LCPD, an increase in the medial joint space with concomitant lateralization of the femoral head is observed on plain radiographs [32]. Arthrography has demonstrated that this apparent widened medial clear space is due to thickening of the articular cartilage [33].
Hip arthrography is a useful method generally performed in the operating room to assess a patient with moderate to severe limitation of hip range of motion. It can provide reliable information regarding containment of the femoral head within the acetabulum and, specifically, information on loss of hip containment and hinge abduction, in which the femoral head “hinges” out of the acetabulum when the hip is abducted [9]. The degree of reducibility can be determined by the position of the femoral head within the acetabulum without imposing undue pressure on the lateral edge of the acetabulum [34]. Hip adductor tenotomy may be performed based on hip examination and arthrography to improve hip abduction and containment of the femoral head (Fig. 60.1c). Laredo [35] established an arthrographic classification that identifies five types of hips based on femoral head shape and position of the labrum, but this has not been tested prospectively.
60.3.6 Magnetic Resonance Imaging
MRI is an accurate imaging modality for the early diagnosis of LCPD. It allows assessment of the extent of femoral head ischemia and provides visualization of the cartilaginous portion of the femoral head and acetabulum. Healing can also be assessed with MRI and can be seen on T1-weighted images as a semilunar, cup-shaped, low-intensity band. The outer zone of the repair tissue is of low intensity in both T1- and T2-weighted images, delineating living from necrotic bone [36–38]. Conventional MRI (non-contrast) has been shown to better delineate the extent of epiphyseal involvement than plain radiography or pinhole scintigraphy [39, 40]. MRI was found to have a diagnostic accuracy of 97–99 %, compared with 88–93 % for radiography and 88–91 % for scintigraphy [41].
The varying modalities of MRI, such as perfusion and diffusion MRI [42, 43], delayed gadolinium-enhanced (dGEMERIC) [44, 45], and dynamic gadolinium-enhanced subtraction (DGS) MRI [46, 47], may offer new insights into the pathophysiology and prognostication of the disorder. Sebag et al. [47] demonstrated the utility of DGS MRI for early detection of epiphyseal ischemia and variations in revascularization patterns. Lamer et al. [46] compared DGS MRI and bone scintigraphy and concluded that there was complete agreement between modalities with DGS MRI being a nonionizing alternative. Several different reperfusion patterns have been identified with DGS MRI, and these patterns mirror those seen with bone scintigraphy. Merlini et al. [42] have compared diffusion-weighted MRI with DGS and concluded that diffusion-weighted MRI can help distinguish between favorable and unfavorable prognosis in LCPD.
In comparison to non-contrast MRI, gadolinium-enhanced MRI provides additional information about the status of blood flow to the affected femoral head. It has been shown to detect changes in bone perfusion in the early stages of LCPD when radiographic changes are not apparent [46]. Non-contrast MRI relies on signal changes from fat present in the epiphysis to detect avascular necrosis. Since it takes weeks to months for the fat to degrade and the signal to decrease, false-negative results from non-contrast MRI have been reported in a handful of early presentation cases [39, 48]. For assessing the extent of femoral head necrosis in the early stages of LCPD, Kim et al. [49] found no correlation when comparing non-contrast and contrast-enhanced MRIs in patients in stage I of LCPD, concluding that these two studies assess two different components of LCPD. Contrast MRI depicting blood flow provided a clearer delineation between perfused and non-perfused regions of the epiphysis and a greater interobserver agreement between four observers compared to non-contrast MRI (Fig. 60.4). A preliminary study also found a correlation between the extent of the epiphyseal perfusion in the early stages of LCPD and the development of femoral head deformity at 2-year follow-up suggesting that contrast-enhanced MRI may provide early prognostic information [50]. Larger and longer follow-up studies are needed to confirm the clinical utility of contrast MRI.
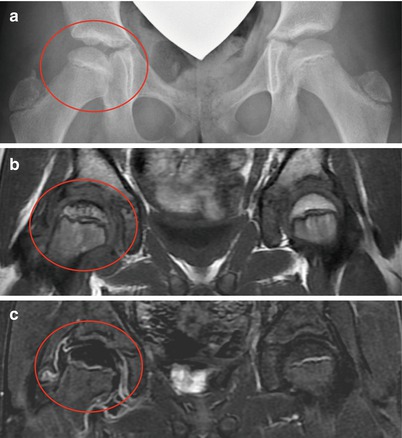
Fig. 60.4
An 11-year-old female with a history of intermittent right hip pain for 2 months prior to the following AP pelvis radiograph (a) and MRI showing non-contrast coronal T1 FSE image (b) and corresponding contrast-enhanced subtraction image (c). (a) AP radiograph shows right femoral head (circle) is in the initial stage of LCPD (stage I) with slightly smaller ossific nucleus and increased radiodensity without any fragmentation. (b) Non-contrast T1 image shows decreased signal in the superior region of the femoral head with spotty areas of decreased signal within the epiphysis. Percent head involvement measured by four observers was 28, 33, 42, and 67 %, showing some interobserver variability. (c) Contrast-enhanced subtraction image shows that most of the epiphysis is lacking contrast enhancement (i.e., hypoperfusion). Percent head involvement measured by four observers was 77, 78, 80, and 97 %, showing a larger extent of involvement than depicted by non-contrast imaging. Better interobserver agreement was observed using contrast imaging (From Kim et al. [49])
Diffusion-weighted MR imaging has been used to evaluate tissue breakdown following ischemia, especially in acute stroke [51, 52]. This imaging modality has the ability to detect ischemic changes in tissue by measuring microscopic alterations in water mobility. In an animal model, diffusion-weighted MR imaging appeared sensitive to early ischemic changes compared to perfusion MR imaging [53]. Perfusion varies with time from markedly decreased to abnormally increased; however diffusion remains increased after the initial insult [54]. Yoo et al. [43] demonstrated that diffusion-weighted MR imaging was sensitive to epiphyseal changes and could reveal whether there are metaphyseal changes developing that are associated with transphyseal reperfusion to the epiphysis, increased T2–S1 in the metaphysis and focal physeal irregularity in children with LCP. Diffusion-weighted MR imaging provides information regarding epiphyseal and metaphyseal involvement different than that provided by perfusion studies and can therefore may be used as a complimentary tool to evaluate ischemic damage in patients with LCPD.
The role of MRI in the management of LCPD is currently evolving as MRI techniques and our understanding of LCPD evolve. Added advantage of MRI in comparison to CT and bone scan is that it is a nonionizing modality that has the ability to depict and quantify the loss of femoral head sphericity in a three-dimensional model during the early, pre-fragmentation stage of LCPD [55]. The disadvantages of MRI are cost, universal availability, and the duration of the study often requiring sedation for younger children (<8 years).
60.4 Radiographic Classifications and Indices
Radiographic classifications and quantitative indices for LCPD can be divided into three types (Table 60.2): those that define the stage and progression of the disease (e.g., Waldenström staging), those developed to prognosticate outcome during the active stage of the disease (e.g., Catterall and lateral pillar), and those that assess the short-term or longer-term outcome (e.g., deformity index and Stulberg).
Table 60.2
Summary of classifications schemes for LCPD
Classification | Purpose | Components | Radiographic features |
|---|---|---|---|
Waldenström | Stages of disease progression | 1. Initial | 1. Increased radiodensity, small ossific nucleus |
2. Fragmentation | 2. Fragmentation and radiolucencies of the ossific nucleus due to bone resorption | ||
3. Reossification | 3. Appearance of new bone medial/lateral femoral head | ||
4. Healed | 4. Normal radiodensity of the femoral head | ||
Extrusion index | For prognosis in early fragmentation | Migration percentage | 1. Measure amount of femoral extruded lateral to Perkins line on affected hip (A) |
Quantifies degree of extrusion | Normal contralateral hip | 2. Measure the width of unaffected femoral head along epiphysis (B) | |
3. A/B × 100 = extrusion percentage | |||
Catterall | For prognosis in mid-fragmentation | Group I | 1. 25 % involvement |
Group II | 2. 50 % involvement | ||
Categorizes the extent of head involvement | Group III | 3. 75 % involvement | |
Group IV | 4. 100 % involvement | ||
Salter-Thompson | For prognosis in early fragmentation | Type A | 1. <50 % femoral head |
Extent of subchondral fracture | Type B | 2. >50 % femoral head | |
Lateral pillar | For prognosis in mid-fragmentation | Group A | 1. No loss of lateral pillar height |
Group B | 2. Less than 50 % loss of lateral pillar height | ||
Height of lateral pillar (15–30 % lateral epiphysis) | Group B/C | 3. 50 % loss of lateral pillar height | |
Group C | 4. Greater than 50 % loss of lateral pillar height | ||
Stulberg | For outcome and prognosis at skeletal maturity | Class I | I. Normal hip joint |
Class II | II. Spherical head with large, short neck or dysplastic acetabulum | ||
Sphericity of femoral head | Class III | III. Nonspherical head (ovoid or mushroom) | |
Class IV | IV. Flat head and congruous hip joint | ||
Class V | V. Flat head and incongruous hip joint |
60.4.1 Waldenström’s Radiographic Staging
Waldenström [56] described four radiographic stages of disease progression: the initial or avascular necrosis stage (stage I), fragmentation or resorptive stage (stage II), reossification or healing stage (stage III), and healed stage (stage IV). The radiographic features of each stage are described in the section below. The duration of each stage is variable from one patient to another. Herring et al. [57] found that time from first radiographic evidence of disease to the start of fragmentation had a mean of 6 months (range, 1–14 months), with the fragmentation stage lasting 8 months (range, 2–35 months), and the reossification stage lasting 51 months (range, 2–122 months). The authors noted that the more severe the disease, the longer the duration of each stage, particularly the reossification stage [58].
60.4.2 Modified Waldenström Staging (Elizabethtown)
In 2003, Joseph et al. [59] reported their modification of the Waldenström staging described in 1972 by Canale et al. [60]. The modified staging is referred to as the Elizabethtown classification. Each of the first original three stages described by Waldenström was further subdivided into two substages as stages Ia, Ib, IIa, IIb, IIIa, IIIb, and IV. Stage Ia is the initial stage of the disease, characterized by sclerosis of the epiphysis without any loss of epiphyseal height. In stage Ib the epiphysis is sclerotic and there is slight loss of height of the epiphysis. In this stage the epiphysis is still in a single piece without fragmentation or vertical fracture lines in the epiphysis visible on the AP or frog-lateral views. In stage IIa the epiphysis shows fragmentation and bone resorption seen as radiolucent areas; one or two vertical fissures in the epiphysis are seen in either view. In stage IIb the fragmentation of the epiphysis is advanced and the maximum flattening of the epiphysis is seen. There is no evidence of new bone formation lateral to the fragmented epiphysis. In stage IIIa there is evidence of new bone formation (reossification) at the periphery of the necrotic fragment; the new bone is not of normal radiodensity and covers less than one-third the circumference of the epiphysis. In stage IIIb the new bone is of normal radiodensity and covers more than one-third the circumference of the epiphysis. In stage IV the healing is complete and there is no radiologically identifiable avascular bone. These modifications to the original classification demonstrated good inter- and intra-observer reliability (0.72 and 0.71, respectively) in a review of 610 patients. Joseph et al. [59] calculated the duration of the initial four stages (Ia to IIb) to be approximately 4 months each, and the duration of stages IIIa and IIIb was twice and thrice that of the preceding stages, respectively. The authors found that the greatest amount of epiphyseal extrusion and flattening occurred during late fragmentation, leading the authors to recommend that containment surgery should be performed prior to stage IIb.
Related posts:
Stay updated, free articles. Join our Telegram channel

Full access? Get Clinical Tree


