Chapter 9 Liver Cancer
Hepatocellular and Fibrolamellar Hepatocellular Carcinoma
Epidemiology
HCC is the sixth most common cancer worldwide and one of the major causes of cancer-related deaths worldwide: fourth after lung, stomach, and colorectal cancers.1–3 It is the most common primary liver cancer in children and young adults. Worldwide, the most common cause of HCC is hepatitis B and C infection. Other high-risk groups include patients with alcohol cirrhosis, hemochromatosis, primary biliary cirrhosis, aflatoxin exposure, and α1-antitrypsin deficiency. The annual incidence of HCC in patients with cirrhosis is 2% to 6%.4 In the Western world, the most common liver disorder is nonalcoholic fatty liver disease (NAFLD). NAFLD corresponds to the hepatic manifestation of patients with obesity, insulin resistance, hypertriglyceridemia, and low high-density lipoprotein. NAFLD can progress to cirrhosis and to HCC.
There is a geographic bias with a high incidence of 90 per 100,000 cases in the Far East, Southeast Asia, and sub-Saharan Africa. In contrast, the incidence of HCC in the United States between 1998 and 2001 was 3.3 per 100,000.5 However, there has been an increased incidence in the United States since 1978 to 1980, when the incidence was 1.3 per 100,000. It is suggested that this increased incidence may be due to hepatitis C infection. HCC in the United States is more common in non-Hispanic whites (57%), followed by blacks (13%), Chinese Americans (8%), and white Hispanics (7%). In 2009, 22,620 adults are estimated to be diagnosed with HCC in the United States with 18,160 deaths in the same time period. In North America, approximately 20% of HCC does not have underlying cirrhosis.
HCC is more common in men than in women (4:1). In the high-incidence regions of the world, the male-to-female ratio can be as high as 8:1; in the low-incidence regions, it is 2:1. The median age of diagnosis is 66 years with less than 5% diagnosed in patients younger than 40 years. The peak age of incidence is 50 to 70 years. However, in the high-incidence regions, the age of presentation is younger at 30 to 50 years, and in the Western regions of the world, patients present later, in the eighth and ninth decades.6 The patient with cirrhosis presents at an earlier age.
The relative survival of HCC in the United States is 26% at 1 year and 7% to 12% at 5 years. The 5-year survival for untreated HCC is less than 5%.6a The patients with cirrhosis and a small HCC (<2 cm) who can undergo a liver transplant have an 80% survival rate.6,7
Anatomy
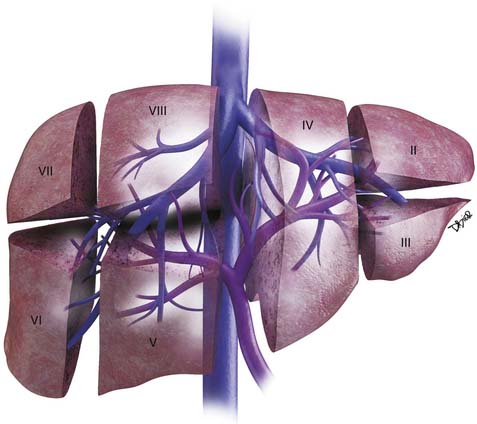
The liver is divided into the right and left lobes and is subdivided into eight anatomic segments (Figure 9-1). The segments are defined by their portal vein supply and separated from each other by the hepatic veins. The caudate lobe is considered segment I. The portal supply to the caudate lobe arises commonly from the main portal vein but may be seen from the left or right portal veins. Segments II and III of the liver are in the left lobe and are supplied by the first and second lateral branches of the left portal vein, respectively. Segment IV is also in the left lobe and is separated from II and III by the left hepatic vein and by the falciform ligament. It is supplied by the medial branches of the left portal vein. The right hepatic vein separates segments in the right lobe: segment VII from VIII and segment VI from V. Segments VII and VI are supplied by the posterior branch of the right portal vein, superior and inferior branches, respectively. Segments VIII and V are supplied by the anterior branch of the right portal vein, superior and inferior, respectively. The middle hepatic vein separates the right and left lobes, segment VIII from IV and segment V from IV. Segment V is also separated from segment IV by the gallbladder fossa (see Figure 9-1).
The liver has an assortment of vascular variants. Michel’s classification describes 10 hepatic arterial anomalies.8 The most common, type I, describes a common hepatic artery that arises from the celiac artery and bifurcates into the right and left hepatic artery, supplying the right and left lobes. Other common vascular variants include a replaced or accessory right hepatic artery from the superior mesenteric artery and a replaced or accessory left hepatic artery from the left gastric artery. Surgical intervention and transarterial chemoembolization (TACE) rely on the complete understanding of the liver arterial anatomy. Documentation of the vascular supply of the liver is essential for correct treatment planning.
Pathology
In the cirrhotic liver, the development of HCC occurs in stages.9 The transformation begins from regenerative nodules (RNs), to a premalignant lesion–dysplastic nodules (DNs), to early HCC, to advanced carcinoma.10 It has been reported that allelic loss, chromosomal changes, gene mutations, epigenetic alterations, and alterations in molecular cellular pathways play a role in this transformation.11
HCC has four main histologic classifications: trabecular, pseudoglandular, compact, and scirrhous. The most common type is the trabecular pattern, and the scirrhous is the least common. The trabecular pattern is composed of fibrous stroma separating the tumor cell plates.12 The histology grading of HCC ranges from well-differentiated to highly anaplastic tumors. This tumor grade has been found to predict survival. Grade I tumors can mimic hepatocellular adenomas, whereas grade IV tumors may mimic nonhepatocellular malignancy.
HCC can present as large or infiltrative diffuse disease. A capsule is commonly present in tumors larger than 2 cm.13,14
Clinical Presentation
The clinical presentation of HCC is nonspecific with symptoms that include right upper quadrant pain, weight loss, fullness, anorexia, abdominal swelling, vomiting, fever, fatigue, and jaundice. Many of these symptoms are shared by the underlying cirrhosis and chronic hepatitis in the absence of HCC.15,16 In the setting of cirrhosis, the development of weakness, malaise, and weight loss should raise the suspicion of an HCC.
Paraneoplastic manifestations of HCC, seen in fewer than 5% of patients with HCC, include erythrocytes, hypercholesterolemia, porphyria cutanea tarda, gynecomastia, hypercalcemia, and hyperglycemia.17
The laboratory testing for HCC includes alpha-fetoprotein (AFP) levels. AFP is the most common tumor marker used for screening patients with HCC. The normal range is 10 to 20 ng/mL. The positive predictive value (PPV) of AFP in predicting cancer depends on the etiology of the tumor. Elevated AFP is seen more commonly in the Asian countries (70%) than in the Western world (50%). A non–viral-related form has a 94% PPV compared with 70% for viral-related HCC.18 A mass in the liver with an AFP level of more than 200 ng/mL is considered diagnostic of HCC. However, in 20% of HCCs, the AFP is not elevated. Another serum marker evaluated in patients with HCC is the protein-induced vitamin K abnormality (PIVKA). PIVKA is commonly elevated in patients with HCC (80%).19 However, AFP and PIVKA may be elevated in patients with chronic hepatitis and cirrhosis without HCC.
Staging Classification
The most recent tumor-node-metastasis (TNM) staging criteria of the seventh edition of the American Joint Commission on Cancer (AJCC; Tables 9-1 and 9-2) is based on tumor number, size, and vascular invasion (T); local and distant metastatic adenopathy (N); and the presence of metastatic disease.20,21
Table 9-1 Tumor-Node-Metastasis Classification for Hepatocellular Carcinoma
| Primary Tumor (T) | |
| TX | Primary tumor cannot be assessed |
| T0 | No evidence of primary tumor |
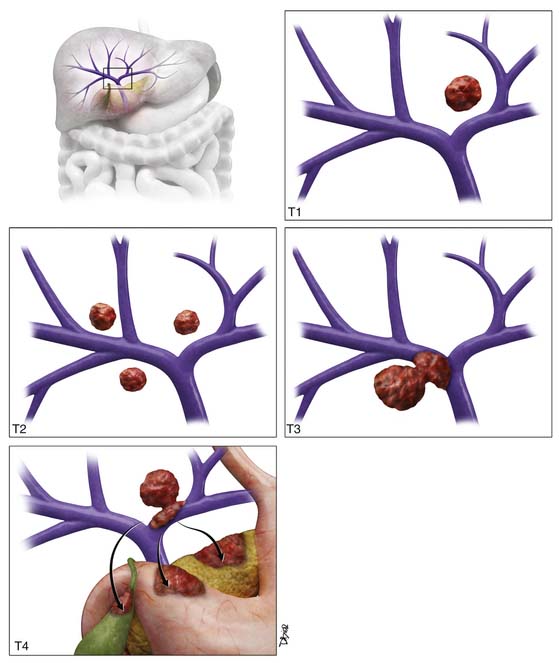
| T1 | Solitary tumor without vascular invasion |
| T2 | Solitary tumor with vascular invasion or multiple tumors none > 5 cm |
| T3a | Multiple tumors > 5 cm |
| T3b | Single tumor or multiple tumors of any size involving a major branch of the portal vein or hepatic vein |
| T4 | Tumor(s) with direct invasion of adjacent organs other than the gallbladder or with perforation of visceral peritoneum |
| Regional Lymph Nodes (N) | |
| NX | Regional lymph nodes cannot be assessed |
| N0 | No regional lymph node metastasis |
| N1 | Regional lymph node metastasis |
| Distant Metastasis (M) | |
| M0 | No distant metastasis |
| M1 | Distant metastasis |
From Greene FL, Trotti A III, Fritz AG, et aI. Liver. In: Edge SB, Byrd DR, Compton CC, et al, eds. AJCC Cancer Staging Manual. 7th ed. New York: Springer; 2010.
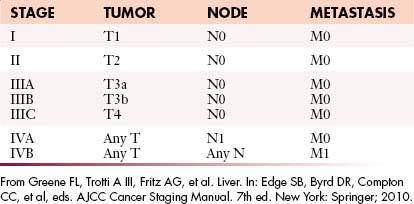
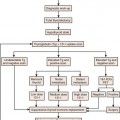
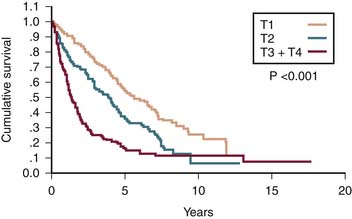
T1 tumor stage classification is for all solitary tumors regardless of size without vascular invasion (Figure 9-2). T2 tumor is defined as solitary tumors with vascular invasion or multiple tumors none larger than 5 cm (see Figure 9-2). T3 tumors are classified as multiple tumors larger than 5 cm or tumors with major vascular invasion of a major branch of the portal or hepatic veins (see Figure 9-2). T4 lesions are described as tumors that demonstrate direct invasion to adjacent organs, other than the gallbladder, or in the setting of perforation to the visceral peritoneum (see Figure 9-2). The cumulative survival for the various T stages is shown in Figure 9-3.20
The criteria for liver transplantation (LT) are based on size and number of lesions. Patients with a single lesion less than 5 cm or up to three lesions none larger than 3 cm are considered transplant candidates. The Model for End Stage Liver Disease (MELD) HCC scoring system is used to prioritize the patients on the waiting list for LT.22 A single HCC larger than 2 cm or multiple nodules increase the priority. In explanted livers in the United States, a third of the patients with the pretransplant diagnosis of HCC did not have histologic confirmation.22 Transplantation can be considered for HCC solely on the basis of lesion characterization on imaging.
Key Points Staging of hepatocellular carcinoma
• T staging is based on lesion size (>5 cm), number, and vascular and organ invasion.
• N staging is based on regional (N1) and distant nodes (N2).
• Most common distant metastases are lung and bone.
• Criteria for transplantation are a single lesion smaller than 5 cm or up to three lesions, none larger than 3 cm.
Patterns of Tumor Spread
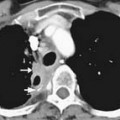
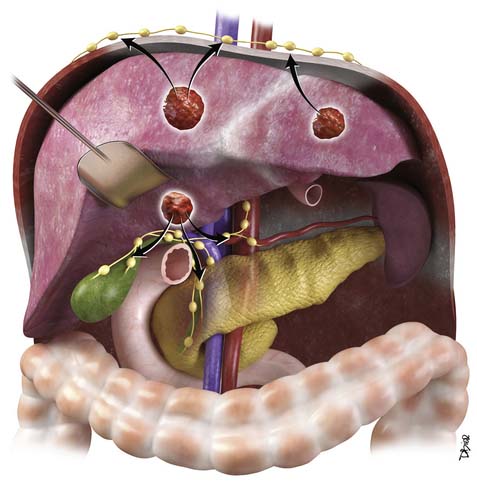
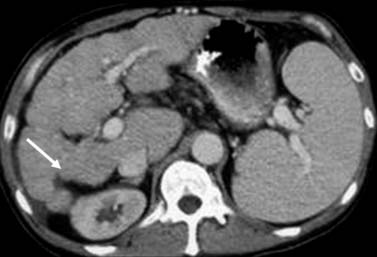
HCC may present with intrahepatic and extrahepatic tumor spread.23 This is more common with larger tumors (>5 cm). The most common type of spread of HCC is intrahepatic tumors followed by portal vein tumor thrombosis. The extrahepatic (hematogenous + lymphatic) spread has been reported in autopsy series in over half of cases, with the lung as the most common site.17 Hematogenous spread may also be seen in the adrenal glands, bone, pancreas, kidney, and spleen. Lymphatic metastases are commonly found and typically occur at the hepatic hilum (Figure 9-4).23 Other common nodal stations include anterior diaphragmatic nodes, peripancreatic nodes, perigastric nodes, retroperitoneum, paratracheal, carina, and supraclavicular nodal stations. The mortality of HCC is usually due to underlying liver failure rather than tumor spread, with most patients dying without clinical symptoms of extrahepatic metastasis.
Imaging
Primary Tumor
Ultrasound
Ultrasound (US) has been suggested as the imaging modality of choice in screening patients with chronic liver disease that are at risk of developing HCC. In a survey of physicians, members of the American Association of Study of Liver Diseases found that screening for HCC was performed by 84% of the responders.24 The most frequent screening tools were AFP and US examination.
The sensitivity of US for the detection of HCC depends on the patient population, size of the lesion, and technical skills. Lower sensitivities for detection were seen in the United States and in the smaller lesions (1-2 cm). This lower sensitivity in the United States may be due to an overweight population. The higher sensitivity was seen in Asia with a less overweight patient population. Utilizing the gold standard of explanted livers, the sensitivity of US ranges with great variability from 33% to 72%.25,26 The specificity of US ranged from 92% to 100%.27,28
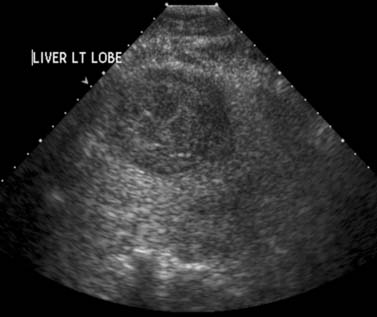
The most common sonographic appearance of HCC is a hypoechoic solid mass (Figure 9-5). This is more common in smaller, well-differentiated tumors. In larger tumors, the sonographic appearance is varied with features due to necrosis (hypoechoic), fat (hyperechoic), fibrosis (hyperechoic), hemorrhage (hyperechoic), and calcium (hyperechoic). US is commonly the imaging modality of choice for image-guided tumor biopsy.
Contrast-enhanced ultrasound (CE-US) has shown promise in the characterization of HCC. The most common imaging feature is intratumoral enhancement in the arterial phase.29 However, in some well-differentiated HCCs, there is no arterial enhancement on CE-US evaluation.29 This technique is not approved for clinical use in the United States.
Computed Tomography
Computed tomography (CT) is the most commonly used modality for the evaluation of patients with HCC. This is in part a result of availability. A liver protocol is recommended for the evaluation of patients with HCC. This consists of a precontrast CT examination of the abdomen at 5 mm with 2.5-mm reconstructed images and dynamic study with multiple phases after the intravenous injection of iodinated contrast agent. The rate of contrast injection should be 4 to 6 mL/sec. This allows optimum tumor enhancement and conspicuity.30,31 The first phase after contrast administration is the late arterial phase. This occurs at approximately 30 to 35 seconds after the intravenous administration of contrast. In our institution, we use a bolus tracking technique in which the inflow of contrast is monitored with a region of interest in the aorta at the level of the celiac artery. Once the Hounsfield units reach 100 HU, after a set delay of 17 seconds, the late arterial phase is acquired. The second phase, the portal venous phase (PVP), is obtained at approximately 60 seconds after contrast administration. The third phase of imaging, the excretory phase, is obtained at 3 to 5 minutes after intravenous contrast administration.
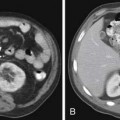
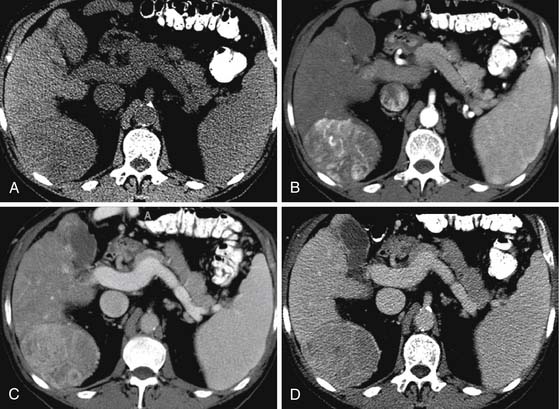
On the noncontrast CT examination, HCC is commonly seen as a low-attenuation mass relative to liver but can present as isointense or hyperintense to liver (Figure 9-6A). The noncontrast study is useful to detect calcifications, hemorrhage, and fat infiltration of the liver. HCCs are very hypervascular tumors and are best detected during the late arterial phase of contrast administration (see Figure 9-6B). The liver enhancement occurs during the second phase after contrast administration, the PVP. The tumor is less conspicuous during this phase of imaging (see Figure 9-6C). The classic pattern of enhancement is for the hypervascular mass seen on the late arterial phase to show low attenuation relative to the liver on the excretory phase. In the setting of a capsule, the capsule will demonstrate low attenuation in the late arterial phase, mixed attenuation on the PVP, and enhancement on the delayed phase (see Figure 9-6D). HCC imaging features are variable with some tumors seen only during the late arterial phase (hypervascular) or only during the excretory phase (low attenuation). A follow-up evaluation of a series of 60 hypoattenuating nodules in chronically injured liver concluded that the conversion rates to hypervascular HCC (nodule in a nodule or entire enhancement) at 1 year, 2 years, and 3 years were 15.8%, 44.3%, and 58.7%, respectively.32
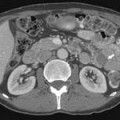
CT scan features of cirrhosis include nodular contour of the liver, an enlarged caudate lobe, relative enlargement of the left lobe, right hepatic notch, and an enlarged gallbladder fossa (Figure 9-7). In the setting of portal hypertension, an enlarged spleen, recanalized umbilical vein, and varices in the left gastric or esophageal distribution may be seen on CT.
To complicate the diagnosis of HCC, other lesions seen in the cirrhotic liver may share imaging features with HCC. As described previously, tumor development in the cirrhotic patient is a stepwise progression from an RN, to a DN, to a DN with HCC, and to HCC (well-differentiated to poorly differentiated). RNs have a dominant portal venous blood supply and may have iron content (siderotic nodules). On the precontrast CT image of the liver, siderotic RN appears higher in attenuation relative to the liver. On the multiphasic evaluation, RNs are isoattenuating to liver. DNs, similar to RNs, also have a dominant portal venous supply with some arterial feeding. Thus, some DNs may enhance in the earlier late arterial phase of contrast administration but most are isointense to liver. The DNs are also mostly isointense to liver on the excretory phase of contrast administration. This is a helpful distinction from HCC. The DN with foci of HCC appears as a mostly isoattenuating mass with some areas demonstrating early enhancement. DNs and RNs lack a capsule, another helpful distinction from HCC.
The receiver operating characteristics (ROC) analysis is used to evaluate tumor detection. The area under the curve (Az) and sensitivity for the detection of HCC for multidetector row computed tomography (MDCT) have been investigated. For MDCT contrast-enhanced dynamic imaging, the Az ranges from 0.82 to 0.99 and the sensitivity from 77% to 93%.33,34 The sensitivity of tumor detection is best for HCCs larger than 1 cm.
Key Points Computed tomography of hepatocellular carcinoma
• Multiphasic CT study is required for HCC.
• HCC enhances early, is isointense on the PVP, and is hypointense on the delayed phase.
• CT presentation of HCC may be variable and the distinction from DN difficult.
• Cirrhotic liver have nodular contour, enlarged left and caudate lobes, right hepatic notch, and enlarged gallbladder fossa.
Magnetic Resonance Imaging
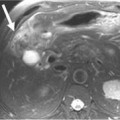
On T1-weighted images (T1WIs), HCC is usually hypointense to the liver on the in-phase and out-of-phase images (Figure 9-8A) (40% of HCC14). In a fatty liver, the lesion may be isointense to hyperintense to the liver on the out-of-phase sequence. A fat-containing HCC will be hyperintense to the liver on the in-phase images and isointense or hypointense on the out-of-phase images. Lesions with copper, protein, glycogen, or hemorrhage may present as hyperintense to liver on the T1WI (35%).14
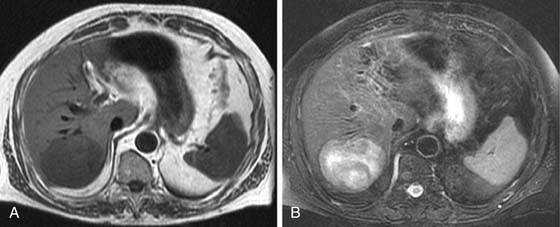
On FSE T2WI, HCC is usually hyperintense to liver (see Figure 9-8B).14 In a series of 47 HCCs, 94% of the lesions were hyperintense on T2WI.13 In other series, HCC has been described as variable in signal low or isointense to the liver on T2WI. The well-differentiated HCC may be iso- to hypointense to the liver on the T2WI.14,35 The regenerative nodules and most dysplastic nodules are hypointense to liver.36 The development of HCC from a dysplastic nodule can be detected by foci of high signal on the T2WI in an isointense or hypointense nodule.37
DWI can be used for the qualitative characterization of lesions. The quantitative characterization of HCC includes the calculation of the apparent diffusion coefficient (ADC). The ADC of HCC (1.33 mm2/sec) has been reported to be different from hemangiomas (2.95 mm2/sec) and cysts (3.63 mm2/sec). However, there is an overlap in the ADC values of other malignant masses in the liver and HCC. This area requires further investigation.
The most critical MRI series for the detection of HCC is the dynamic postgadolinium series. This sequence is obtained during a breathhold with a three-dimensional (3D) volume gradient echo sequence. The timing of the arterial phase is critical for the detection of HCC. An improperly timed acquisition may result in lower sensitivity for the detection of HCC. Because the blood supply of HCC is almost exclusively from the hepatic artery, the enhancement pattern is best during the arterial or late arterial supply.38,39
Four different techniques are used in determining the timing of the arterial phase of contrast administration: A set delay with (1) a single or (2) a double arterial phase; (3) a 1- to 2-mL test bolus; or (4) fluoro-triggered imaging. A set delay of 20 seconds, although simple, has the limitation of lacking compensation for differences in cardiac output between patients. A double arterial phase utilizes a set delay time but compensates for cardiac output differences with two sequential series after contrast administration.40 These images are usually acquired with lower matrix (lower resolution) to allow the completion during a single breathhold. The 1- to 2-mL test bolus technique compensates for cardiac output and provides excellent timing. The limitations of this technique are an increased scan time and the concern of image interpretation when the total volume of contrast to be used is less than 10 mL. Fluoro-triggered images utilize a set delay time after the visualization of contrast in the aorta or pulmonary arteries. The delay time has to take into account the timing of the center of k-space acquisition relative to the first echo. In our institution, the center of k-space is acquired at the middle of the scan. We found that a 17-second delay time from the pulmonary arteries to the center of k-space is optimum. Others have reported a delay of 8 to 9 seconds from the visualization of contrast at the level of the abdominal aorta/celiac artery when the center of k-space is obtained at the beginning of the scan.41
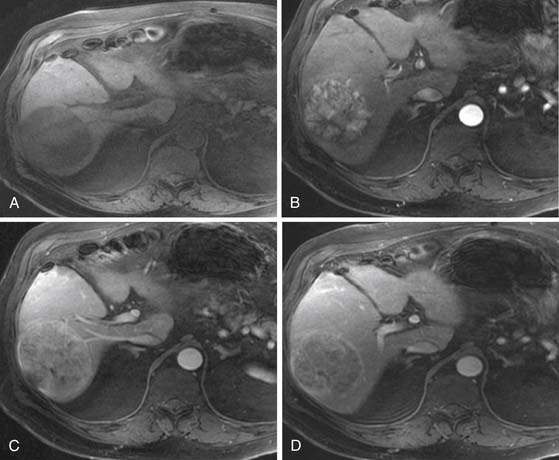
Similar to CT, the classic image features for HCC on MRI after the intravenous administration of contrast are hyper-, iso-, and hypointense to liver during the arterial phase, PVP, and excretory phase, respectively (Figure 9-9). The image features are variable. For example, some HCCs are seen only during the excretory phase of contrast administration as a hypointense mass.32,42 Delayed images show late enhancement of the fibrous capsule and hypointensity of the mass relative to liver (see Figure 9-9D).
The ROC analysis of MRI for the detection of HCC has reported sensitivity from 65% to 91% and the Az of 0.68 to 0.97.43,44 The sensitivity of the detection of HCCs larger than 1 cm for MRI has been reported as high as 94%.45 This is reduced to less than 45% for nodules smaller than 1 cm.45
MRI is also useful in characterizing nonmalignant nodules seen in the cirrhotic and noncirrhotic liver. The nonmalignant RNs are commonly small (<1 cm) and contain hemosiderin deposition. These RNs (or siderotic nodules) have low signal on T1WI and T2WI sequences.36 These nodules do not exhibit the dominant arterial enhancement seen on HCC. The premalignant DNs may be hyperintense on the T1WI and iso- or hypointense on the T2WI. This is a distinctive feature from HCC, which is commonly hyperintense on the T2WI. The DNs and RNs are commonly hypovascular on the arterial phase of enhancement.
Hepatocyte-specific agents have been used in the evaluation of HCC. Gd-EOB-(DTPA) (gadolinium ethoxybenzyl diethylenetriamine-penta-acetic acid) and Gd-BOPTA (gadobenate dimeglumine) both show the similar dynamic postgadolinium profile of other gadolinium-based contrast agents (GBCAs) for the arterial phase, PVP, and delayed phase of enhancement. On the hepatocyte phase of contrast administration, most HCCs and some DNs showed hypointensity relative to the liver.10 In some cases, HCC may be isointense to hyperintense to liver in the hepatocyte phase of contrast administration. These cases in which the HCCs demonstrate uptake of the agent, the uptake is regarded to be determined as a function of the expression of OATP1B3 (organic anion transporter 1B3) protein rather than a function of tumor differentiation or bile production.46
Even in the setting of improved preoperative imaging techniques of CT and MRI, the detection rate for tumors less than 1 cm is close to 70%. Unfortunately, over 35% of preoperative diagnosed single HCCs less than 5 cm demonstrated additional lesions in the explanted specimen.47
In larger HCCs, the mosaic pattern of enhancement may be seen on the postcontrast CT and MRI examination of the liver. This pattern is composed of enhancing nodules, low-attenuation areas, and internal septa. The enhancing nodules correspond to the viable tumor, and the low-attenuation areas are a combination of necrosis, fibrosis, and hemorrhage.48 MRI evaluation of large tumors with the mosaic pattern demonstrates variable T1WI and T2WI signal with heterogeneous nodular enhancement pattern.
Arterial Enhancing Nodule
In the cirrhotic and noncirrhotic liver, the detection of arterial enhancing nodules (AENs) can be problematic. An AEN is defined as a nodule seen only during a single phase of contrast administration, the late arterial phase. These nodules are not detected on the T1, T2, or other phases of contrast administration. The differential diagnosis for AEN includes HCC but also many other benign lesions such as focal nodular hyperplasia (FNH), adenoma, perfusion abnormalities, vascular malformation, dysplastic nodules, and others. In multiple series, a follow-up of these lesions concluded that they were likely to be benign even in the setting of cirrhosis and that follow-up evaluation or MRI evaluation was recommended.49–51 Hepatocyte contrast agents may demonstrate low signal intensity on the hepatocyte phase of contrast administration that may suggest HCC.
Key Points Imaging of arterial enhancing nodule of hepatocellular carcinoma