Liver Perfusion Imaging with CT
Marco Rengo, MD, PhD
Marco Maria Maceroni, MD,
Andrea Laghi, MD
▪ Introduction
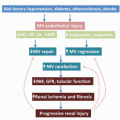
Advances in therapeutic options for primitive or metastatic liver malignancies raised the demands on diagnostic and surveillance tests. Existing imaging modalities provide limited assessment beyond morphologic and structural criteria; perfusion imaging, conversely, has potential to improve this shortcoming. Earlier detection of liver malignancies or cirrhosis may be possible on the basis of hepatic disease-related changes in blood flow (BF). The advent of multidetector CT (MDCT), thanks to its high temporal and spatial resolution, is a noninvasive and robust imaging modality for the evaluation and quantification of tissue perfusion.
Functional imaging is becoming increasingly important in both research and clinical diagnostic radiology. Perfusion computed tomography (pCT) is a readily available tool that allows an objective measurement of tissue perfusion through the mathematical analysis of CT data. pCT analysis has been validated against the current standard of reference and has been proven to be reproducible.1,2 Several papers stating a correlation between perfusion parameters and histologic results of angiogenesis, such as microvessel density, validate the use of pCT as an in vivo biomarker of angiogenesis.
A robust acquisition technique, an accurate data analysis, and an adequate interpretation of results are essential to make pCT a valid diagnostic and prognostic tool into clinical context.
▪ Background
The process of tumor neoangiogenesis plays a central role in the growth and spread of tumors, and it is currently a leading theme in oncology. Expanding tumors become hypoxic, and tumor cells express transcription factors, which induce the release of proangiogenic growth factors such as vascular endothelial growth factors (VEGF) and transforming growth factor that promote the formation of new capillaries by recruiting, activating, and stimulating endothelial cells. The newly grown vessels are immature and differ from normal capillaries. They are tortuous, irregular, and leaky (especially to macromolecules), and they are independent of the normal mechanisms of regulation of the capillary BF. Evaluation of neoangiogenesis can be used as a prognostic marker to evaluate the aggressiveness of tumor and as a potential predictive marker of antiangiogenic treatment response.
The assumption of angiogenesis process as a prognostic feature in the growth and metastatic spread of several tumors3 encouraged finding new drugs targeting tumor vascularization.4,5
For this reasons, monitoring vessel pattern changes is currently a fundamental concern in oncology. Microvascular density has been considered as a gold standard method to take count of angiogenesis or aggressiveness of many cancers.6,7 Unfortunately, microvascular density indexes require invasive tissue sampling, and therefore, it is unfeasible for monitoring response to antiangiogenic drugs; furthermore, it is also limited by random sampling errors and limited reproducibility, and thus, it is not feasible in routine clinical practice.8 It has become a challenging goal for radiologists to assess noninvasively the physiology of the tumor microcirculation, in addition to conventional morphology. Angiogenesis is now extensively studied by dynamic contrast-enhanced (DCE) magnetic resonance imaging (MRI)9,10 and 11 and MDCT.12,13 and 14 Over the last few years, substantial gains have been made with pCT imaging, and the role of CT has been investigated to assess angiogenesis in the malignant lesions of the lung, colon-rectum, liver, esophagus, and pancreas.15,16,17,18,19,20 and 21 Because the resulting pCT parameters are dependent on the kinetic model and the software employed in analysis, efforts to further improve the reproducibility and to understand the relationship with cancer angiogenesis are currently justified.
▪ CT Perfusion
Although a range of other imaging modalities ensure tissue perfusion analysis, CT is particularly suitable in everyday clinical practice due to its widespread availability and reproducibility. Another advantage of pCT is the linear relation between iodine concentration and tissue attenuation modifications, which makes mathematic modeling relatively simpler against MR imaging. Furthermore, the increasing availability of commercial software for pCT makes this technique easily incorporated into existing CT protocols. Until a few years ago, the main limitation was related to reduced anatomic coverage of the first-generation scanners and the low speed of acquisition and processing of images. With the advent of MDCT, decrease in the gantry rotation time (about 0.4 seconds), and the capability to cover major volumes at each rotation of the tube, this limit falls inexorably.2,22 Further, the development of MDCT systems has motivated growing interest to a
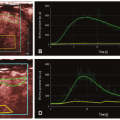
volume-based examination. The principles, on which pCT studies are based, continue to reside in continuous acquisition of a serial high temporal resolution images at stationary table (imposed by the geometry of the scanner) following rapid intravenous injection of iodinated contrast media and in assessing attenuation differences of tissue over time that indirectly reflects tissue vascularity and vascular physiology. The neoangiogenesis is a biologic phenomenon of extreme importance in growth and distant spread of the tumor. The liver pCT study represents a noninvasive tool able to provide useful information regarding the vascular network modifications; it allows an in vivo assessment of BF, blood volume (BV), the mean transit time (MTT), permeability-surface (PS) area product, arterial liver perfusion (ALP), portal liver perfusion (PLP), hepatic perfusion index (HPI), and indexes of tumor angiogenic modifications and liver function reserve. These tissue perfusion parameters reflect physiologic angiogenic markers and may be visually assessed by using colored functional maps created in pCT analysis.22 The key point in performing liver pCT is to resolve hepatic dual vasculature. Arterial and portal venous supply of the liver parenchyma enhancement may be distinctly resolved using the beginning of dominant portal venous perfusion, highlighted by peak splenic enhancement (Fig. 28-1). PLP and ALP values are computed by normalizing the slopes of the attenuation rise in arterial and portal venous phases of liver enhancement, respectively, to peak aortic enhancement. HPI is calculated by dividing the derived arterial perfusion by the sum of portal and arterial perfusion values.2,22 The average time required for blood to cross the vascular network from the arterial inlet to venous outlet is defined as MTT. Further, the PS area product for circulating molecules reflects the speed of transfer of a contrast agent from the intravascular to the extravascular/extracellular compartment. pCT is used in oncology because it is believed that it can serve as an indicator of the angiogenic events in solid tumors. By definition, angiogenesis is the formation of new blood vessels from preexisting vessels; theoretically, the pCT is capable of measuring the BV inside of the newly formed microvessels, because it gives a numerical value to the parameter of BV, expressed in mL/100 g tissue. The newly formed vessels also have an altered wall and therefore are abnormally permeable, and the pCT is able to provide an estimate of the capillary permeability through the calculation of the PS. For these reasons, the pCT would theoretically be able to quantify the phenomenon of angiogenesis in solid tumors: compared to other potential angiogenic biomarkers as the measurement of MVD, circulating levels of the VEGF, or circulating endothelial cells, it presents undeniable advantages of being noninvasive, inexpensive, and widely available.
volume-based examination. The principles, on which pCT studies are based, continue to reside in continuous acquisition of a serial high temporal resolution images at stationary table (imposed by the geometry of the scanner) following rapid intravenous injection of iodinated contrast media and in assessing attenuation differences of tissue over time that indirectly reflects tissue vascularity and vascular physiology. The neoangiogenesis is a biologic phenomenon of extreme importance in growth and distant spread of the tumor. The liver pCT study represents a noninvasive tool able to provide useful information regarding the vascular network modifications; it allows an in vivo assessment of BF, blood volume (BV), the mean transit time (MTT), permeability-surface (PS) area product, arterial liver perfusion (ALP), portal liver perfusion (PLP), hepatic perfusion index (HPI), and indexes of tumor angiogenic modifications and liver function reserve. These tissue perfusion parameters reflect physiologic angiogenic markers and may be visually assessed by using colored functional maps created in pCT analysis.22 The key point in performing liver pCT is to resolve hepatic dual vasculature. Arterial and portal venous supply of the liver parenchyma enhancement may be distinctly resolved using the beginning of dominant portal venous perfusion, highlighted by peak splenic enhancement (Fig. 28-1). PLP and ALP values are computed by normalizing the slopes of the attenuation rise in arterial and portal venous phases of liver enhancement, respectively, to peak aortic enhancement. HPI is calculated by dividing the derived arterial perfusion by the sum of portal and arterial perfusion values.2,22 The average time required for blood to cross the vascular network from the arterial inlet to venous outlet is defined as MTT. Further, the PS area product for circulating molecules reflects the speed of transfer of a contrast agent from the intravascular to the extravascular/extracellular compartment. pCT is used in oncology because it is believed that it can serve as an indicator of the angiogenic events in solid tumors. By definition, angiogenesis is the formation of new blood vessels from preexisting vessels; theoretically, the pCT is capable of measuring the BV inside of the newly formed microvessels, because it gives a numerical value to the parameter of BV, expressed in mL/100 g tissue. The newly formed vessels also have an altered wall and therefore are abnormally permeable, and the pCT is able to provide an estimate of the capillary permeability through the calculation of the PS. For these reasons, the pCT would theoretically be able to quantify the phenomenon of angiogenesis in solid tumors: compared to other potential angiogenic biomarkers as the measurement of MVD, circulating levels of the VEGF, or circulating endothelial cells, it presents undeniable advantages of being noninvasive, inexpensive, and widely available.
 Figure 28-1. Schematic diagram showing dual liver supply and time-attenuation curves for the abdominal aorta (1 = red), portal vein (2 = blue), spleen (3 = green), and normal liver (4 = brown). The peak splenic attenuation (3) is used to separate the arterial phase from the portal venous phase. The liver arterial perfusion maximal slope (LAS) and the liver portal perfusion maximal slope (LPS) are obtained as shown by red and blue dotted lines. To calculate hepatic arterial and portal perfusions, the maximal slope in each phase is divided by the peak aortic (1) and portal (2) enhancement. PV, portal vein |
▪ Perfusion CT Technique
The perfusion is by definition the transport of blood to unit of volume of tissue in the unit of time. In theory, pCT is a tool able to quantify (through the usage of mathematical models) in an objective manner (by the use of dedicated software) “real” tissue perfusion, as it only assesses the attenuation differences produced by the arrival of contrast agent (and therefore blood) to the tissues. The pCT is based on two technical requirements. The first is the acquisition of dynamic CT scans of the volume of interest before, during, and after the intravenous administration of iodinated contrast media, in order to study the variations of the attenuation over time. The density measured by CT in a voxel-by-voxel analysis (i.e., x-ray attenuation expressed in Hounsfield unit [HU]) is directly
proportional to the amount of contrast agent in the tissue; the contrast medium (CM) present in the volume of tissue is due to the presence of contrast agent in the vessels and in the interstitium (extravascular/extracellular space), by passive diffusion. The second requirement is the selection of an arterial input. The placement of a region of interest (ROI) on an artery (arterial input) allows to obtain an attenuation/time curve, expressed in HU/s, which is compared to that related to the tissue analysis obtained through the placement of an ROI (Fig. 28-1). This comparison allows one to distinguish the amount of contrast agent inside the vessels (vascular compartment) from that in the interstitium (extravascular compartment). The ensuing attenuation modifications over time are analyzed by using one of the known kinetic models (Appendix) to calculate perfusion parameters that reflect the functional status of the vascular system.23
proportional to the amount of contrast agent in the tissue; the contrast medium (CM) present in the volume of tissue is due to the presence of contrast agent in the vessels and in the interstitium (extravascular/extracellular space), by passive diffusion. The second requirement is the selection of an arterial input. The placement of a region of interest (ROI) on an artery (arterial input) allows to obtain an attenuation/time curve, expressed in HU/s, which is compared to that related to the tissue analysis obtained through the placement of an ROI (Fig. 28-1). This comparison allows one to distinguish the amount of contrast agent inside the vessels (vascular compartment) from that in the interstitium (extravascular compartment). The ensuing attenuation modifications over time are analyzed by using one of the known kinetic models (Appendix) to calculate perfusion parameters that reflect the functional status of the vascular system.23
 Figure 28-2. Simplified two-compartment model of the capillary intravascular interstitial tissue exchange system. In this system, the injected contrast (impulse) that is transported from the intravascular space (IVS) into the interstitial space (extravascular-extracellular space or EES) will in part renter the IVS and soon is washed off from both spaces. Mathematical kinetics of the tracer transport in the tissue is known as impulse retention (residue) function or IRF. As shown in this diagram, the recorded attenuation values for the early flat plateau of the IRF remains highest because the sum of contrast concentration in both IVS and EES adds up to 100%. Soon with entrance of contrast into the venules, its concentration in the system drops. This decay in attenuation reflects the first-pass extraction of contrast in this two-compartment model and in overall depends on the capillary PS area product. Intracellular space (ICS) does not participate in the exchange. AIF, arterial input function. (From Thng CH, Koh TS, Collins D, et al. Perfusion imaging in liver MRI. Magn Reson Imaging Clin N Am 2014;22(3):417-432.) |
▪ Perfusion CT Protocols
The primary objective of hepatic perfusion imaging is to increase the detection of liver disease. Distinct pCT protocols have been developed, depending on the target organ, kinetic model, CT scan configuration, and clinical objective. A typical pCT examination takes place by performing a baseline acquisition without contrast enhancement, followed by a sequential high temporal resolution acquisition after intravenous injection of CM. The baselineunenhanced CT acquisition serves as a localizer to select the ROI to be included in the dynamic series. According to the scanner configuration, a 2-cm coverage area (for a 4- or 16-row CT scanner) or a 4-cm coverage area (for a 64-row CT scanner) can be selected for dynamic scanning. Larger z-axis coverage (8 to 16 cm) is now achievable with the introduction of newer scanners with 128 to 320 rows of detectors.24 Depending on the bicompartmental kinetic of contrast media (intra- and extravascular components), two sets of physiologic data have to be quantified for contrast enhancement on CT. The intravascular phase assesses tissue perfusion (i.e., BF per unit volume or mass of tissue and relative BV, parameters usually increased in malignancies in relation to the high MVD found in neoplastic tissue). In this phase, the enhancement is mainly attributable to the distribution of contrast within the intravascular space, and it usually lasts approximately 40 to 60 seconds from the time of contrast arrival (first pass). The extravascular phase, conversely, can be used to exploit the abnormally leaky vessels to circulating molecules (contrast material) in malignant tissue, reflecting the increased vascular permeability due to immature basement membrane. In this second phase, tissue enhancement results from contrast distribution between the intra- and extravascular compartments (delayed phase) (Fig. 28-2). The two most common analytic methods to estimate tissue perfusion from the dynamic CT data are compartmental analysis and deconvolution analysis.12,21,24,25 The analytic methods used and the acquisition protocols vary from scanner to scanner and among commercial vendors. General Electric works on the deconvolution approach and allows calculation of parametric maps of BF, BV, MTT, and PS. The Philips pCT software works on the slope method to calculate the perfusion maps and to estimate the tissue peak enhancement, time to peak enhancement, and MTT. Siemens perfusion software similarly exploits the slope method to calculate perfusion and also to estimate the BV and time to peak enhancement. In Table 28.1 is reported a glossary of terms commonly used in CT perfusion.
▪ Contrast Media Administration
The shape of the bolus of CM is a key point for pCT. An optimal perfusion analysis is adequately performed by injecting a 40 to 70 mL at a rate ranging from to 3.5 to 10 mL/s.12,21,24,25 According to the linear relation between tissue enhancement and iodine concentration, it is preferable to use a higher concentration of CM (>370 mgI/mL). For compartmental analysis the use of a short and rapid bolus is recomended (40 to 50 mL administered with an injection rate between 5 and 10 mL/s) to obtain perfusion parameters, because this kinetic model requires that peak arterial iodine concentration come early the maximal increase in tissue enhancement. By using deconvolution kinetic model, lower injection rates may be used though higher rates may still be advisable by maximizing tissue enhancement and to improve the signal-to-noise ratio (50 to 70 mL administered with an injection rate between 4 and 6 mL/s). Depending on the linear relation between iodine concentration and
tissue enhancement, a higher concentration of CM (370 mg/mL or greater) is recommended; however, regardless iodine concentration, it is important to maintain an iodine injection rate of 2 g/s.21
tissue enhancement, a higher concentration of CM (370 mg/mL or greater) is recommended; however, regardless iodine concentration, it is important to maintain an iodine injection rate of 2 g/s.21