Key Facts
- •
Magnetic resonance imaging (MRI) has the capability of defining normal and abnormal articular cartilage morphology. Imaging at high-field strength (such as 3T) aids in the resolution of articular cartilage.
- •
MRI can evaluate the structure as well as the thickness of articular cartilage.
Osteoarthritis (OA) is the most common condition to affect human joints as well as a frequent cause of locomotor pain and disability. Despite its societal impact and prevalence, there is a paucity of information on the factors that cause OA to progress. Previously considered a “wear and tear” degenerative disease with little opportunity for therapeutic intervention, OA is now increasingly viewed as a dynamic process with exciting potential for new pharmacologic and surgical treatment modalities such as cartilage transplantation, osteochondral allografting or autografting, osteotomies, and tibial corticotomies with angular distraction. The appropriate deployment and selection of newer treatment interventions for OA is dependent on the development of better methods for the assessment of the disease process. Degenerative changes to articular cartilage can be described in biologic, mechanical, and morphologic terms. From a morphologic viewpoint there has been substantial progress in our ability to study cartilage using magnetic resonance imaging (MRI).
MRI, with its superior soft tissue contrast, is the best technique available for assessment of normal articular cartilage and cartilage lesions. MRI can provide morphologic information about the area of damage. Specifically, changes such as fissuring, partial- or full-thickness cartilage loss, and signal changes within residual cartilage can be detected. The ideal MRI technique for cartilage will provide accurate assessment of cartilage thickness, demonstrate internal cartilage signal changes, evaluate the subchondral bone for signal abnormalities, and demonstrate morphologic changes of the cartilage surface.
MRI PULSE SEQUENCES
Routine MRI pulse sequences available for imaging of articular cartilage include conventional T1- and T2-weighted spin echo techniques, gradient recalled echo imaging, magnetization transfer contrast imaging, and fast spin echo sequences.
Conventional T1-Weighted and T2-Weighted Imaging
Conventional T1-weighted and T2-weighted MRI do depict articular cartilage and can demonstrate defects and gross morphologic changes. T1-weighted images show excellent intrasubstance anatomic detail of hyaline cartilage. However, T1-weighted imaging does not show significant contrast between joint effusions and the cartilage surface, making surface irregularities difficult to detect. T2-weighted imaging demonstrates joint effusion and thus surface cartilage abnormalities, but because some components of cartilage have relatively short T2 relaxation times, these are not well depicted.
Gradient Recalled Echo Imaging
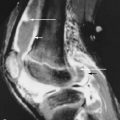
Gradient recalled echo imaging has been employed because of its three-dimensional (3D) capability and ability to provide high-resolution images with relatively short scan times. Fat-suppressed 3D spoiled gradient echo (FS-3D-SPGR) imaging has been shown to be more sensitive than standard MRI for the detection of hyaline cartilage defects in the knee. FS-3D-SPGR imaging can be, however, subject to image artifacts and ambiguity in cartilage contour ( Figure 4-1 ).

Fast Spin Echo Imaging
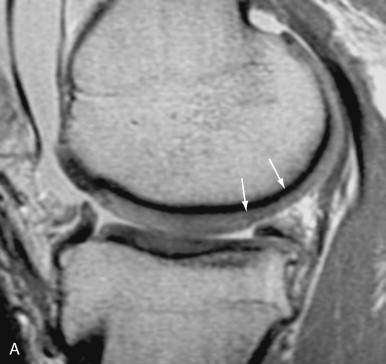
Fast spin echo imaging is another useful pulse sequence to evaluate articular cartilage ( Figure 4-2 ). Incidental magnetization transfer contrast contributes to the signal characteristics of articular cartilage on fast spin echo images and can enhance the contrast between cartilage and joint fluid. Sensitivity and specificity of fast spin echo imaging have been reported to be 87% and 94% in a study with arthroscopic correlation.

Many other MRI sequences have been proposed for cartilage imaging but have not found widespread acceptance. These include T1-weighted proton, density-weighted and T2-weighted spin echo (SE) sequences, inversion recovery (IR) sequences, two-dimensional (2D) and 3D magnetization transfer contrast (MTC) sequences projection reconstruction spectroscopic imaging (PRSI) and 2D- and 3D-driven equilibrium Fourier transform (DEFT).
Novel MRI Pulse Sequences
Cartilage, as an ordered tissue, demonstrates the effects of magnetization transfer. Several studies have demonstrated that the magnetization transfer effect can be used to separate articular cartilage from adjacent joint fluid and inflamed synovium.
Poor cartilage signal-to-noise ratio (SNR) and contrast-to-noise ratio (CNR) (SE, IR sequences), limited SNR efficiency (SE, IR), need for offline reconstruction (PRSI) or for image subtraction (MTC), and unstable sequence performance (DEFT) are among the factors that have prevented the broad dissemination and acceptance of these techniques for cartilage MRI.
The most promising novel MRI pulse sequences for cartilage imaging are water-selective excitation techniques such as 3D spoiled gradient echo with spectral spatial pulses (3D SS-SPGR), 3D steady state free precession (3D SSFP), 3D DESS and 3D fast spin echo (3D FSE) techniques. These fast sequences hold the promise of providing 3D coverage (unlike 2FSE) while yielding superior CNR between cartilage and surrounding tissues (unlike 3D SPGR) and are likely to improve the accuracy and reproducibility of cartilage MRI.
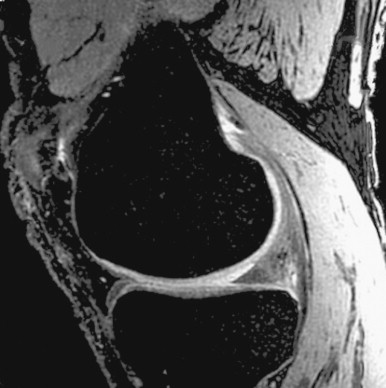
The 3D SSFP sequence is a fully balanced steady-state coherent imaging pulse sequence designed to produce high SNR images at very short sequence times (TR) ( Figure 4-3 ). The pulse sequence uses fully balanced gradients to rephase the transverse magnetization at the end of each TR interval. To achieve fat saturation in a steady state, it is important to bring the magnetization back to the steady state as quickly as possible to avoid artifacts. Therefore a half-alpha technique is used to store magnetization and then return it to steady state relatively quickly. This is repeated throughout the sequence at regular intervals. Figure 4-7 shows the sequence diagram.

3D DESS is a steady-state pulse sequence where both SSFP and time-reversed SSFP signals are acquired within the same repetition time ( Figure 4-4 ). A second gradient echo is added immediately before each radiofrequency (RF) in a 3D SSFP sequence. This additional strong T2W time-reversed SSFP signal adds onto the regular SSFP signal, resulting in improved SNR and stronger T2 contrast (see Figure 4-4 ).
3D FSE provides SE contrast. SE sequences are resistant to image artifacts from a variety of sources such as RF or static field inhomogeneity and susceptibility. Recently a single-slab version of 3D FSE has been reported ( Figure 4-5 ). Compared with conventional multi-slab 3D FSE sequences, a single-slab sequence can improve SNR, reduce total power deposition, and avoid slab-to-slab difference in image contrast. In order to reduce acquisition time, effective echo time and echo spacing, all the RF pulses are nonselective hard pulses. The duration of the excitation RF pulse is 400 μs whereas the refocusing pulse is only 500 μs. Such short pulses result in effective echo time and echo spacing of about 3 to 5 msec. The short echo time enhances T1 contrast and improves SNR; the short echo spacing reduces blurring artifact. With short echo spacing, more echoes can be acquired after each excitation, thus reducing scan time.

The basic promise of these isotropic and near-isotropic 3D imaging sequences is to provide T1- and T2-weighted contrast with unprecedented resolution in three dimensions, thereby obviating the need for acquisition of 2D sequences in the coronal, sagittal, and axial planes. In the future, 3D volume data generated in this manner can be viewed on an interactive workstation with real-time interactive display of any desired imaging plane, without loss or without significant loss in in-plane resolution.
Multiple MRI sequences have been investigated for evaluation of articular cartilage. Sequences in which the voxels (volume elements) are isotropic (the same size in each dimension) can provide images in any plane without loss of resolution, as well as provide 3D imaging.
MRI SENSITIVITY AND SPECIFICITY: CORRELATION TO ARTHROSCOPY
The sensitivity and specificity of standard MRI in detecting cartilage loss has been examined by correlating 2D FSE and/or 3D SPGR sequences with arthroscopic findings. *
* References .
The specificity of standard 2D FSE and 3D SPGR sequences is excellent, ranging between 81% and 97%. * The data reported on the sensitivity of 2D FSE and 3D SPGR sequences are inconsistent, ranging between 60% and 94%. *The sensitivity of standard MRI sequences for cartilage defects is between 60% and 94%, with a specificity between 81% and 97%. The sensitivity is greater for more severe lesions.
The severity of cartilage loss and the grade of OA is important: Kawahara et al. reported that the sensitivity of 2D FSE improved with higher grades of cartilage loss; the sensitivity reported for early, superficial cartilage lesions was only 31.8%, whereas the sensitivity for full-thickness defects was greater than 90%. Limited spatial resolution of the 2D FSE sequence in the slice direction may be the cause for this observation. Bredella et al. reported a sensitivity of only 61% for single-plane 2D FSE sequences; when two or more planes were combined in the interpretation, the sensitivity increased to 93%. These data along with the limited sensitivity observed for superficial cartilage lesions in the study by Kawahara et al. provide a strong indication that novel pulse sequences with near-isotropic resolution, such as 3D SSFP or 3D FSE, are needed in order to achieve sensitivities of cartilage MRI that are consistently greater than 90%.
QUANTITATIVE IMAGE PROCESSING AND IMAGE ANALYSIS
Quantitative image processing techniques are increasingly important for the detection and monitoring of cartilage volume, thickness, and surface, especially when the success of surgical procedures or response of medical treatment is being evaluated.
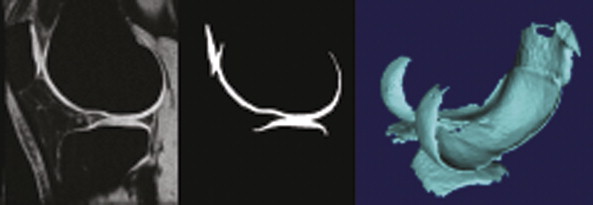
Therefore a 3D model of cartilage can be generated by segmenting it from surrounding tissue by either manual or semiautomatic segmentation based on threshold techniques ( Figure 4-6 ). With manual segmentation, the reader draws a line around the borders of femoral and tibial cartilage on every single MRI slice with a computer mouse. The semiautomatic method is similar to the manual one, with the difference that the computer generates, according to a mathematical algorithm, an estimation of the cartilage borders, which have to be controlled and eventually changed by the reader. The resultant 3D models can be used to calculate the volume, thickness ( Figure 4-7 ), and surface area of the segmented cartilage. The interreader and intrareader reproducibility of these methods has been evaluated by reading MRI data acquired from healthy volunteers or patients with mild OA.

3D measurements of total cartilage volume and cartilage thickness have evolved as the standard for quantitative MRI-based assessment of cartilage loss. *
* References .
Both measurements require segmentation of the cartilage from the surrounding tissue using techniques such as manual segmentation, intensity-based thresholding, filtering, watershed, and live wire approaches or model-based segmentation.3D measurements of total cartilage volume and cartilage thickness have evolved as the standard for quantitative MRI assessment of articular cartilage but require considerable time for evaluation, making them most useful currently for research purposes.
The ability to distinguish changes of cartilage volume and thickness over time, which is determined by the reproducibility of the technique, is a critical component of any OA outcome measure. There is significant disagreement in the literature as to the reproducibility of MRI derived measurements of cartilage loss in the knee. Coefficients of variation (COV) for repeated measurements of total cartilage volume derived from standard 3D SPGR sequences ranged from 1.8% to 8.2% and were as high as 10% to 15% in one study.
MEASUREMENT OF LONGITUDINAL PROGRESSION, IMPACT OF REPRODUCIBILITY
Wluka et al. reported that the annual rate of total tibial cartilage loss in a longitudinal study in OA patients amounted to 5.3 ± 5.2% (mean ± 1 standard deviation [SD]) (95% confidence interval [95% CI] 4.4%, 6.2%) per year, a value only slightly above most of the published reproducibility errors. The annual percentages of loss of medial and lateral tibial cartilage were 4.7 ± 6.5% and 5.3 ± 7.2%, respectively (see Figure 4-2 ). Gandy et al. did not see any discernable change in cartilage volume in OA cases that were followed with MRI for 3 years. Remarkably, radiologists’ visual readings showed progression of cartilage loss in the same cohort. Difficulties in cartilage segmentation caused by low cartilage contrast in the 3D SPGR sequence appeared to be responsible for the problems noted with quantitative cartilage measurement. This is a fundamental problem affecting all OA studies that utilize standard technology; in other words, standard 2D FSE and 3D SPGR sequences.
Hardy et al. showed that the spatial resolution of the imaging sequence is of critical importance for reducing partial volume artifacts in cartilage MRI and for improving the reproducibility of quantitative measurements of cartilage loss. Changing the slice thickness from 1.0 to 0.5 mm resulted on average in a 2% decrease in COV in the tibiofemoral compartments. Similarly, a change in in-plane resolution from 0.55 to 0.275 mm caused a threefold decrease in COV of repeated cartilage volume measurements. In addition to the high variability in published reproducibility errors and the difficulties encountered by some investigators in segmenting the articular cartilage in OA patients, the results of Hardy et al. emphasize the need for novel 3D imaging techniques with high contrast and high spatial resolution, such as the new 3D SSFP, 3D DESS, and 3D FSE sequences.
THE NATIONAL INSTITUTES OF HEALTH OSTEOARTHRITIS INITIATIVE
The National Institutes of Health (NIH) Osteoarthritis Initiative (OAI) is a public-private partnership that aims to find biologic markers for the progression of OA. For 5 to 7 years, the OAI will collect information and define disease standards on 5000 people at high risk for OA and at high risk of progressing to severe OA during the study. Efforts to develop novel therapies for OA have been frustrated by the lack of objective and measurable standards for disease progression by which new drugs can be evaluated. It is hoped that the OAI will speed progress toward better drugs. The OAI will establish and maintain a natural history database for OA that will include clinical evaluation data, radiographic and MRI images, and a biospecimen repository. Recognizing the limitations of current MRI technology, the NIH OAI has decided to invest in new hardware technology by purchasing novel 3.0T MRI systems rather than standard 1.5T MRI systems. Imaging arthritic joints at 3.0T offers the unique opportunity to image articular cartilage with unprecedented signal, thereby providing the opportunity for high-resolution, near-isotropic imaging. Exciting new technologies such as 3D SS-SPGR, 3D SSFP, 3D DESS, and 3D FSE can be brought to their full potential at 3.0T and can be combined with other novel approaches such as parallel imaging.
MRI at 3T allows improved resolution of articular cartilage and near-isotropic imaging.
T2 RELAXATION MAPPING
The biochemical and physiologic composition of cartilage offers the possibility of noninvasive MRI detection of molecular changes that may lead to cartilage destruction and OA. The transverse relaxation time (T2), which is sensitive to changes of water and collagen content of the cartilage tissue, and the anisotropy (a state in which a physical characteristic varies in value along axes in different directions) of the tissue matrix are especially useful for the early detection of cartilage changes. T2 is the time it takes for spinning protons to lose phase coherence among the nuclei spinning perpendicular to the main magnetic field. This interaction between spins results in a reduction in the transverse magnetization (T2). The decay of T2 is tissue specific, as tissue with high proton mobility has a longer T2 period than tissue with lower proton mobility.
A high correlation between water content and T2 of the cartilage allows one to generate T2 maps of the cartilage with an estimated weight error of only 2% ( Figure 4-8 ). The freedom of movement of the water is restricted by the anisotropic extracellular matrix of the cartilage tissue. The matrix differences in the particular histologic zones (superficial, transitional, and radial) lead to variable concentrations of water in the cartilage tissue. The water content decreases from the cartilage surface to the deeper zones. As a result of water distribution, the T2 values appear in different phases. Some in vitro studies on cartilage samples have shown T2 values to measure from 10 ms near subchondral bone to 50 to 60 ms at the cartilage surface. The tendency to exhibit lower T2 values in the deep radial zone has been confirmed in in vivo studies showing T2 values of 30 to 46 ms in the deeper radial zone and 55 to 65 ms at the cartilage surface.

The intactness of the collagen fibers is also an important factor in T2. Different studies have shown that the collagen content influences the MRI appearance. Damage to the network integrity leads to an increased cartilage T2. In contrast to the influence of collagen, the impact of proteoglycan (PG) loss appears to be low in terms of cartilage T2. In in vitro studies a single component of the cartilage was enzymatically erased. This is a finding unlikely to be seen in vivo in OA. Rather, a multifactor event leads to cartilage destruction. Menezes suggested that both hydration and structure are important factors.
In OA the cartilage structure is damaged, and cartilage T2 values increase because of an increase in the relative water content. A recent study has shown that in mild OA the cartilage T2 (34.4 to 41.0 ms) is significantly greater than the healthy values (32.1 to 35.0 ms), but a further increase of T2 in severe OA could not be found.
In many in vitro studies using cartilage/bone samples for creating a T2 map, magnetic fields at 7T or higher have been used. These studies used pixel resolution ranging from 30 to 78 μm. In the in vivo studies evaluating the knee cartilage, either a 1.5T or 3T magnet was used, with pixel resolution ranging from 100 to 547 μm.
For T2 cartilage mapping of the knee, multiecho is preferable to single echo data acquisition with a TE range of 10 to 100 ms. A short interecho spacing is dictated by the fast decay of cartilage T2. A decreasing SNR has to be taken into account by utilizing large bandwidth for registration of these short echo signals. A further method of reducing the interecho spacing is the use of extremity transmit/receive coils. The difficulty of reducing interecho spacing and otherwise keeping high resolution can be solved on the one hand by using a small field of view and on the other hand by larger matrix places demanding high gradient strength and rise time.
Mosher et al. described in several publications a method for calculating cartilage T2 maps by fitting the signal intensity for different pixels as a function of time, including constants as pixel intensity and T2. He furthermore suggested fitting the signal intensity of every pixel to a single exponential decay. In another report, Dardzinski et al. suggested that a better fit could be achieved if the first echo time, which includes a combination of T1 and T2 signal, is excluded. Color-coded maps of every single cartilage region can be generated from the calculated T2 signals.
A pitfall of this technique is a phenomenon called “magic angle effect,” related to the collagen anisotropy in MRI. In addition to the orientation of cartilage collagen fibers in the magnetic field, the cartilage T2 values are influenced by this phenomenon. This effect is described in different in vitro studies using cartilage samples. When the collagen fibers are aligned 55 degrees to the applied static magnetic field (B0), longer cartilage T2 results and leads to higher apparent imaging signal. The increased signal and inhomogeneous signal in the articular cartilage created by this artifact should not be confused with early degenerative changes in the cartilage substance. In daily clinical application this increased signal intensity can cause diagnostic mistakes, especially along curved surfaces. This phenomenon was evaluated in in vitro studies that showed strong influence on the MRI appearance in the radial zone, where the collagen fibrils are perpendicular to the articular surface of cartilage. Mosher et al. showed in an in vivo study that the transitional zone also influences the T2 and suggested a regional difference of cartilage tissue and fiber orientation in weight-bearing and non–weight-bearing areas. Xia et al. reported a complicated multizone structure found in the cartilage of the peripheral humerus head with a second transitional zone and a second tangential zone located at the deep part of the tissue. Not only does the orientation of collagen fibers in the magnetic field determine the increased signal, but the arrangement of PGs on the collagen frame as a structural component of the cartilage and their variable distribution influence the dipolar interactions of the water molecules.
Magic angle artifact, which occurs when the tissue is oriented at approximately 55 degrees to the main magnetic field, causes that portion of the articular cartilage to appear brighter than the other areas, potentially simulating a cartilage lesion.
T1ρ RELAXATION MAPPING
T1ρ imaging is based on spin lock MRI studies. The basic premise of this technique is that T1ρ is correlated with proteoglycan content (R 2 = 0.926). Unlike dGEMRIC studies (see later section), it does not require the use of a contrast agent but is based on an inherent tissue specific relaxation phenomenon. Greater dispersion of values between normal and OA cartilage has been reported with this technique when compared with T2 measurements. Thus T1ρ may be more sensitive for detecting earlier biochemical alterations when compared with T2 relaxation imaging. However, T1ρ in the deep radial zone depends on cartilage orientation and, similar to T2 measurements, may be subject to position-dependent changes.
SODIUM MR IMAGING (23na MRI)
One of the early events in OA is the loss of PG content or fixed charge density (FCD) in the cartilage tissue. Sodium (23Na) MRI is described as another method for early detection of OA. It is concerned with displaying cartilage regions with reduced PG. The PGs serve as a connective and stabilizing component between collagen fibers and are surrounded by glycosaminoglycans (GAGs). The molecular composition of the GAG induces a negative FCD to which the positively charged 23Na is attracted. To maintain a state of electroneutrality, a direct relationship between the concentrations of 23Na and GAG appears to exist. In the early stages of OA, GAGs are reduced, resulting in decreased 23Na concentration.
Different investigators have analyzed cartilage with Na spectroscopy and shown that the 23Na image is modified in degraded cartilage. These in vitro studies show the sensitivity of sodium MRI as a function of cartilage depletion and show that the relaxation times of 23Na change in combination with progressive loss of PGs. A 100% visibility of 23Na in cartilage and the spatial distribution of sodium in healthy cartilage have also been reported. These findings could be transferred to in vivo investigations of 23Na and calculation of FCD. Shapiro et al. reported an in vivo examination of human patellar cartilage FCD in which 23Na ranging from 140 to 350 mM corresponded to a maximum FCD of −270 mM, with lower values at the edges of the cartilage. An in vivo examination of patella cartilage in healthy volunteers and patients with symptoms of early OA reported a significantly lower FCD in the symptomatic group. These results indicate a possible method of noninvasive determination of early cartilage changes, even if further investigations are necessary to introduce it to clinical routine.
Stay updated, free articles. Join our Telegram channel

Full access? Get Clinical Tree


