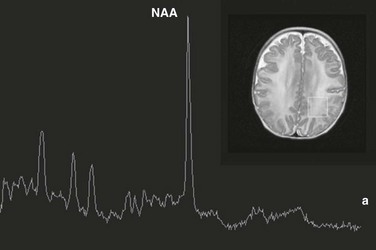
Chapter 25 Most clinical magnetic resonance (MR) scanners now allow the addition of the magnetic resonance spectroscopy (MRS) modality, which can be used to assess cellular metabolism noninvasively and is the most accessible method for studying and monitoring neurometabolic disorders in patients (Table 25-1). The most important MRS method, proton or hydrogen (1H) spectroscopy, is approved by the Food and Drug Administration (FDA) for general use in the United States and can be ordered by clinicians for their patients, if indicated. For the brain in particular, it has been proved that MRS provides additional clinically relevant information for several disease processes such as brain tumors, metabolic disorders, and systemic diseases. The signal used by magnetic resonance imaging (MRI) to create anatomic maps is generated primarily by the hydrogen nuclei, also known as protons (1H), of water molecules (H2O). In contrast, 1H MRS analyzes the signal of protons attached to other molecules. Whereas for MRI only a single peak (water) is being mapped, the output of MRS is a collection of peaks at different radiofrequencies representing proton nuclei in different chemical environments, that is, the spectrum (Fig. 25-1 and Table 25-2). MRS can measure a variety of metabolites. Typical MR spectra of normal occipital gray matter is shown in Figure 25-1. The x axis, or chemical shift axis, is a measure of the frequency shift of a proton relative to a universally fixed reference substance (tetramethylsilane at 0 ppm). In spectra in vivo, the protons of water (usually not shown) resonate at 4.7 parts per million (ppm). The ppm scale has been selected instead of Hertz (Hz = sec−1) because it is independent of the magnetic field strength. The y axis is a measure of the signal intensity, which is proportional to the concentration of a chemical. Figure 25-1 1H spectra of occipital gray matter acquired in a control subject. The most prominent peak of the 1H spectrum is the resonance at 2.0 ppm from three equivalent protons of the acetyl group of the N-acetylaspartate (NAA) molecule (see Fig. 25-1). The role of NAA and its regulation in vivo are not well understood. In the normal brain, NAA is synthesized in neurons, diffuses along axons, and is broken down in oligodendrocytes. NAA is present in high concentrations only in normal neurons and axons,1,2 and from an MRS perspective, it is a marker for adult type “healthy” neurons and axons. Proton spectra of any disease that is associated with neuronal or axonal loss will exhibit a reduction of NAA. Brain NAA increases rapidly as the brain matures, peaks at ≈10 to 15 years, and then decreases slightly over time as the number of neurons and axons declines even in the normal brain.3 tCho, Cr, and NAA can be detected readily and quantified in long echo time (TE) MRS. Short TE acquisition methods are necessary for reliable quantitation of myo-inositol (mI), which is a little-known sugarlike molecule that resonates at 3.6 ppm in the proton spectrum. It has been identified as a marker for astrocytes and is an osmolyte.4,5 mI also is involved in the metabolism of phosphatidyl inositol, a membrane phospholipid. Similar to choline, mI is altered in response to alteration of membrane metabolism or membrane damage. Both tCho and mI are high in the newborn brain but decrease rapidly to normal levels within the first 12 to 24 months after birth. Lactate is an important metabolite because it indicates anaerobic metabolism. Although lactate can be detected at pathologically elevated concentrations, in healthy tissue the lactate concentration is too low for routine detection with currently available methods. Lactate is the product of anaerobic glycolysis and increases when subsequent oxidation of lactate in the tricarboxylic acid cycle is impaired (for example, by lack of oxygen or mitochondrial disorders). Lactate also can increase in necrotic tissue and cysts. An elevation of lactate in “normal” appearing tissue would indicate global disruption or impairment of perfusion consistent with hypoxia and eventual poor outcome.6–10 Single-voxel MRS measures the MR signal of a single selected region of interest, whereas signal outside this area is suppressed. For single-voxel MRS, the magnetic field and other parameters are optimized to get the best possible spectrum from a relatively small region of the brain. Manufacturers generally provide point-resolved spectroscopy,11,12 stimulated echo acquisition mode,13 and image-selected in vivo spectroscopy.14 These sequences differ in how radiofrequency pulses and so-called gradient pulses are arranged to achieve localization. It is beyond the scope of this review to discuss details about localization methods; the interested reader is referred to the aforementioned publications. With chemical shift imaging (CSI) approaches, multiple spatially arrayed spectra (typically more than 100 spectra per slice) from slices or volumes are acquired simultaneously. Slice selection can be achieved with a selective radiofrequency pulse, as for MRI (Fig. 25-2). When it is desired that the region of interest be limited to a smaller volume, for example, to avoid bone and fat from the skull, CSI is usually combined with point-resolved spectroscopy, stimulated echo acquisition mode, or image-selected in vivo spectroscopy, but with a significantly larger volume selected than for single-voxel MRS. CSI is a very efficient method for acquiring information from different parts of the brain. An important feature is that within the examined volume of interest, any region of interest can be selected retrospectively by a process termed voxel shifting. Neonatal Hypoxic-Ischemic Encephalopathy In neonates with hypotensive injury, acute injury can be detected by MRS even when both diffusion imaging and conventional imaging are negative.15–26 Within the first 24 hours of injury, MRS can detect elevated lactate levels in the cerebral cortex or basal ganglia, depending on the pattern of injury. Reduced NAA and elevated glutamate/glutamine levels usually are detected after 24 hours. NAA and lactate can be detected using either short echo (35 ms) or long echo (144 or 288 ms) time. MI, glutamate/glutamine, and lipids can be detected only during use of the short echo technique (Fig. 25-3). The lactate/NAA peak ratio, measured in deep gray matter, is an accurate prognosticator for neonatal hypoxic-ischemic encephalopathy,27–36 whereas diffusion imaging can be limited by pseudonormalization of apparent diffusion coefficient in neonates.37 Figure 25-3 Comparison of magnetic resonance spectroscopy (MRS) of neonatal hypoxic-ishemic encephalopathy (acquired at multiple echo times [TEs]) with neonatal metabolic disease. Readers are referred to an extensive review of the role of MRS in metabolic disease and white matter disease by Cecil and Kos.38 Inborn errors of metabolism can present in the neonatal period. Leukoencephalopathies, which include a broad spectrum of inherited and acquired diseases that affect white matter, are associated with genetic enzyme defects that can lead to dysfunction and breakdown of myelin. These disease processes tend to present in infancy or childhood. Metabolic disease may be classified as acquired metabolic disorders or inborn errors of metabolism. Some examples of acquired metabolic disorders include hyperbilirubinemia and hypoglycemia, both of which may result in brain injury. Inborn errors of metabolism can be classified broadly into organic acidemias, disorders of amino acid oxidation, disorders of fatty acid oxidation, primary lactic acidosis, mitochondria function, lysosomal storage disorders, and peroxisomal disorders.39–42 Some examples of organic acid disorders include methylmalonic acidemia and propionic aciduria. In these disorders, enzymatic defects occur in the conversion of valine, isoleucine, threonine, and methionine to propionic acid, succinic acid, and methylmalonic acid. Conventional MR findings include abnormal signal change corresponding to edema in both myelinated and unmyelinated structures. The edema in the myelinated structures is characterized by a vacuolating (or spongiform) myelinopathy, which can be seen in both amino acid and organic acid disorders. In vacuolating myelinopathy, water is trapped within vacuoles that can be found within the myelin sheath layers, resulting in restricted diffusion of water. MRS of these organic acid disorders detects reduction in mI and NAA levels and elevation of glutamine and lactate levels as a result of hyperammonia, ketoacidosis, and mitochondrial dysfunction.39–43 The classic phenotype of maple syrup urine disease is a disturbance in the metabolism of the essential amino acids leucine, isoleucine, and valine. Symptoms occur by the first week of life and include seizures, vomiting and dystonia, fluctuating ophthalmoplegia, and coma. Conventional MR findings include abnormal edema in the deep cerebellar white matter, brainstem tegmentum, posterior limb of the internal capsule, perirolandic white matter, and pre- and postcentral gyrus. The accumulation of abnormal branched-chain amino acids and branched-chain α-keto acids results in a peak at 0.9 ppm. Both the changes detected by diffusion imaging and MRS may normalize after treatment is started.44,45 Urea cycle defects are characterized by a total of five disorders that involve different defects in the biosynthesis of enzymes of the urea cycle, including ornithine carbamyl transferase deficiency, carbamyl phosphate synthetase deficiency, argininosuccinic aciduria, citrullinemia, and hyperargininemia.46,47 In patients with these disorders, MRS can detect elevated glutamine levels resulting from hyperammonemia, which can be reversed with treatment. Mitochondrial disorders are caused by defects of intracellular energy metabolism and result in decreased ATP production.48–50 Leigh disease is a multisystem disorder in which the defect may be at different enzymatic mitochondrial levels, including the pyruvate dehydrogenase complex, cytochrome c oxidase, or ATP synthase. Conventional and diffusion imaging show abnormalities in signal intensity and mean diffusivity in the brainstem (pons, periaqueductal gray, substantia nigra, and medulla), the subthalamic nucleus, and the globus pallidus. MRS is used to detect lactate in these disorders. It should be noted, however, that an elevated lactate level is not specific for a mitochondrial disorder. Similarly, failure to detect lactate does not exclude the possibility of a mitochondrial abnormality. Leukoencephalopathies can be classified in multiple ways, including (1) involvement of the primary cellular organelle; (2) biochemistry; and (3) location of primary involvement (periventricular, subcortical, white matter only, and gray and white matter). The MRS correlate of these white-matter disorders have been reviewed extensively by Cecil and Kos.38 One of the most exclusive pathognomonic MRS diagnoses is that of Canavan disease. Canavan disease is an autosomal-recessive disorder arising from a deficiency of the enzyme aspartoacyclase (a cytosolic enzyme found in oligodendrocytes51) that results in an accumulation of NAA in the brain. MRS shows marked elevation of the NAA peak (Fig. 25-4). Approximately 60% of all pediatric tumors arise from the posterior fossa. In most cases these tumors are grade IV medulloblastoma, grade I pilocytic astrocytoma, or (less frequently) grade II or III ependymoma. Occasionally, a cystic/necrotic medulloblastoma may have imaging characteristics that overlap with posterior fossa pilocytic astrocytoma (Fig. 25-5). Proton spectroscopy and diffusion imaging appear to be particularly useful for diagnoses. Taurine (Tau) elevation has been observed consistently by several groups in persons with a medulloblastoma52–55 and is an important differentiator of medulloblastoma from other tumors of the posterior fossa. A possible caveat is that in our institution we have observed that taurine levels are low in some desmoplastic nodular medulloblastoma variants. Medulloblastomas also have higher levels of choline than other posterior fossa tumors.56,57
Magnetic Resonance Spectroscopy and Positron Emission Tomography
Theoretical Background of Magnetic Resonance Spectroscopy
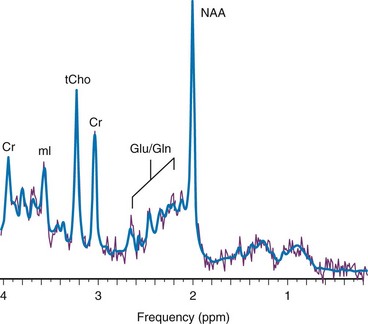
Magnetic resonance imaging uses the signal provided by the protons of the water to generate an anatomic map of the brain. In contrast, 1H magnetic resonance spectroscopy uses the signal from the protons of chemicals to generate a biochemical fingerprint of a “region of interest.” Spectra were acquired using a point resolved spectroscopy sequence with echo time of 35 ms. NAA, N-acetylaspartate; Cr, creatine; tCho, choline containing metabolites; mI, myo-inositol; Glu, glutamate; Gln, glutamine; ppm, parts per million.
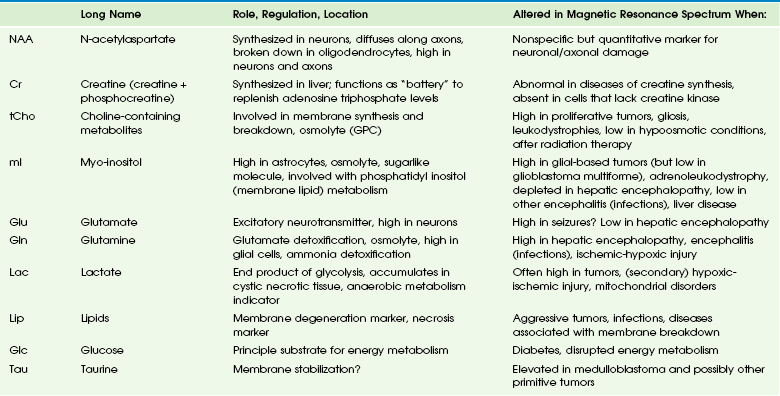
Main Metabolites of the in Vivo Proton Spectrum
Myo-Inositol
Lactate
Magnetic Resonance Spectroscopy Methods
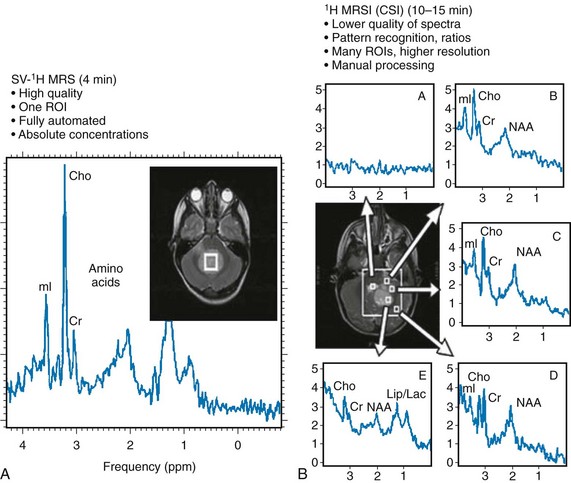
Localized Single-Voxel Spectroscopy
2-Dimensional or 3-Dimensional Chemical Shift Imaging
Clinical Applications
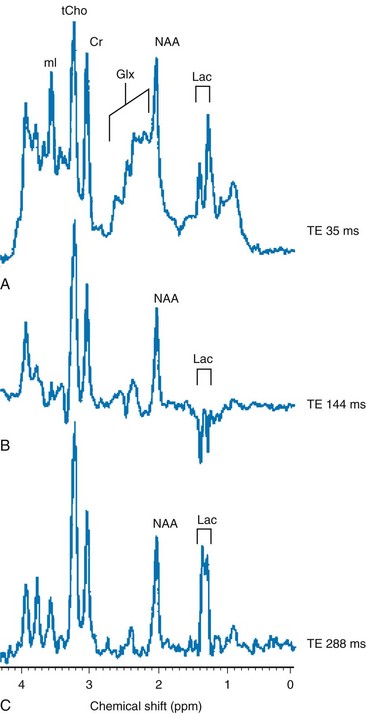
A-C show single-voxel MRS at three different echo times in the basal ganglia of a hypoxic-ischemic term infant. Note the characteristic modulation of lactate (Lac). A, A spectrum acquired using short TE (35 ms), which shows a myo-inositol (mI) peak (left side of the spectrum), an elevated glutamine/glutamine (Glx) peak next to a reduced N-acetylaspartate (NAA) peak (middle spectrum), and an elevated lactate doublet next to a lipid peak (right side of the spectrum). B, A spectrum acquired using long TE (144 ms) that shows a lactate doublet peak inverted and reduced NAA, but nonvisualization of myo-inositol, glutamate, and lipids. C, A spectrum acquired using longer TE (244 ms) that is similar to 144 ms, except that the lactate doublet reverts to the other side of the spectrum.
Metabolic Diseases and White Matter Disorders
Pediatric Brain Tumors
![]()
Stay updated, free articles. Join our Telegram channel

Full access? Get Clinical Tree


Magnetic Resonance Spectroscopy and Positron Emission Tomography