In vivo magnetic resonance spectroscopy (MRS) of the breast can be used to measure the level of choline-containing compounds, which is a biomarker of malignancy. In the diagnostic setting, MRS can provide high specificity for distinguishing benign from malignant lesions. MRS also can be used as an early response indicator in patients undergoing neoadjuvant chemotherapy. This article describes the acquisition and analysis methods used for measuring total choline levels in the breast using MRS, reviews the findings from clinical studies of diagnosis and treatment response, and discusses problems, limitations, and future developments for this promising clinical technology.
Key points
- •
In vivo magnetic resonance (MR) spectroscopy of the breast can be used to measure the level of choline-containing compounds, which is a biomarker of malignancy.
- •
In the diagnostic setting, MR spectroscopy can provide high specificity for distinguishing benign from malignant lesions, which is complementary to the high sensitivity provided from contrast-enhanced MR imaging.
- •
MR spectroscopy also can be used as an early response indicator in patients undergoing neoadjuvant chemotherapy: eventual responders tend to show a decrease in tCho levels early in therapy.
Introduction
Magnetic resonance (MR) spectroscopy is a noninvasive diagnostic modality that can measure chemical information from a selected region in the body. MR imaging scanners are designed to detect and localize the signals from hydrogen nuclei in water and lipids, and produce images. MR scanners can also acquire a chemical spectrum from a specific region. These spectra are chemical profiles with multiple peaks; the position of each peak is determined by the chemical structure, and the area under each peak is determined by the chemical concentration. Peaks from water and lipids typically dominate in vivo spectra, but it is also possible to measure small chemical compounds that are present with concentrations of approximately 1 mM or more. The measureable chemicals, and the techniques typically used to measure them, tend to be organ specific.
The most mature use of MR spectroscopy is for brain applications. Using commercially available protocols, several metabolites can be routinely detected with clinical MR scanners. This information has proved useful in oncology, hypoxia, infection, and other clinical applications. Outside of the brain, MR spectroscopy of prostate cancer is the most advanced application. Spectra from prostate cancer show increased levels of choline-containing metabolites and decreased levels of citrate and polyamines. Integration of prostate MR spectroscopy into clinical practice is currently under way: acquisition and analysis methods have become relatively standardized, and commercial packages are available on most MR scanners.
MR spectroscopy of breast cancer is a few steps behind that of the prostate in terms of development and readiness for routine clinical use. Since its first use in 1998, there have been dozens of publications describing methodologies for performing breast MR spectroscopy and assessing its utility for addressing various clinical questions. The results to date show promise: studies have reproducibly shown that breast MR spectroscopy can differentiate between benign and malignant lesions and can give early evidence of chemotherapeutic efficacy. However, the methods for performing and interpreting breast MR spectroscopy are still evolving, and clinical trials to determine the suitability of using this modality for specific clinical indications are in progress. Nevertheless, software and protocols for acquiring and analyzing breast MR spectroscopy are available today for many MR systems, and interested clinicians are actively assessing this technology in their practices.
Unlike for the brain and prostate, breast spectra typically exhibit only a single metabolite peak, located at approximately 3.2 ppm, which is elevated in cancer in comparison with normal breast tissues. Ex vivo MR spectroscopy studies have shown that there are several different metabolites that overlap and contribute to this peak, including choline, phosphocholine (PC), glycerophosphocholine (GPC), taurine, myo -inositol, and others. At field strengths up to at least 4 T, these components are not distinctly resolvable. This composite peak is commonly called total choline (tCho), or simply choline. The tCho peak is generally thought of as an indicator of cellular proliferation, and is well established as a marker of malignancy in the brain and prostate. The largest chemical constituent of the tCho peak in malignancy is thought to be PC, which is used in the production and breakdown of cell membranes. The underlying biochemistry that produces elevated tCho in cancers is still an active topic of research, but the presence of aberrant phospholipid metabolism is increasingly recognized as a hallmark of cancer.
The primary goal of most breast MR spectroscopy research has been to detect or measure the level of tCho in breast lesions and to use this as an imaging biomarker for cancer applications. This approach is complicated by the nearly ubiquitous presence of adipose tissue in the breast, which is intermixed with fibroglandular tissue and invasive carcinomas at both macroscopic and microscopic levels. Because of this adipose tissue, there are lipid peaks, often quite large, in nearly all breast spectra, which complicate the acquisition and analysis of tCho measurements. The lipid content of breast tumors has itself been a topic of research: spectroscopic measurements of the water/fat ratio in breast lesions have been shown to be useful in both diagnosis and the monitoring of treatment for breast cancer. Such lipid measurements may provide an objective means for characterizing lesion morphology. This article, however, focuses on MR spectroscopy measurements of tCho and other metabolites.
Technique
A variety of approaches has been used to measure tCho in the breast successfully. Many studies have been performed using single-voxel spectroscopy with 1.5 T MR scanners and qualitative interpretation of the spectra. More recent studies have used more advanced methods, including 3 T MR systems, 2-dimensional (2D) and 3-dimensional (3D) spectroscopic imaging, and quantitative analysis methods. At present there is no widely accepted standard methodology, and the most appropriate approach may be different for different clinical applications.
Acquisition
The measurement of metabolites with MR spectroscopy is generally limited by sensitivity considerations, as these molecules are typically present at concentrations approximately 10,000 times lower than the water and lipid signals imaged with MR imaging. The most obvious factor affecting measurement sensitivity is field strength. The majority of breast MR spectroscopy studies performed to date have used standard 1.5 T MR scanners. There have been no published reports of in vivo breast MR spectroscopy with lower-field MR scanners. Several recent publications have used 3 T MR scanners, which offer approximately twice the signal-to-noise ratio (SNR) of a 1.5 T system. The higher field strength also increases the spectral resolution, making it easier to distinguish between closely overlapping resonances in the spectral domain. There are some potential disadvantages of the higher field, which tend to increase the number of experimental corrections that are required to perform unbiased quantitative spectroscopy (eg, corrections for T 1 , T 2 , transmit, and receive efficiency). Balancing advantages and disadvantages, the higher field strength is generally thought of as beneficial for MR spectroscopy applications. Research studies from even higher-field MR systems have helped accelerate the development of techniques for MR spectroscopy of the breast. MR imaging and spectroscopy of the breast at 7 T in particular may have a role in future clinical applications, but the currently available 1.5 T and 3 T systems are both suitable for breast MR spectroscopy studies in clinical research.
In addition to field strength, the design of the breast receive coil can have a large impact on sensitivity. There is a variety of breast coils currently available on the market, varying in ergonomics, number of receive channels, and biopsy capability. The higher channel-count coils can provide increased sensitivity but with decreased homogeneity, which can complicate analysis of MR spectroscopy. The increase in parallel imaging performance provided by these coils is not typically exploited in breast MR spectroscopy, although it can have some advantage when used with fast spectroscopic imaging techniques.
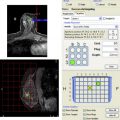
Two distinct localization approaches have been used for breast MR spectroscopy. Single-voxel spectroscopy (SVS) has been most widely used. SVS uses a STEAM (Stimulated Echo Acquisition Mode) or PRESS (Point-Resolved Spectroscopy) pulse sequence to select the MR signal from a single cuboid volume called a voxel. A single spectrum is produced, which represents the average chemical signal from the voxel. Sequences for SVS are widely available, and some manufacturers provide specific SVS protocols optimized for breast MR spectroscopy. An alternative localization technique is chemical-shift imaging or MR spectroscopic imaging. In this technique, a larger volume is excited, and 2D or 3D phase encoding is used to produce a spatially resolved grid of spectra.
The sensitivity of MR spectroscopic imaging and SVS are the same, which means that for a given voxel size and acquisition time they both produce the same SNR in each voxel. In that time, however, SVS produces a single spectrum from one region, whereas MR spectroscopic imaging produces a matrix of spectra over a larger region. However, MR spectroscopic imaging generally requires more time to acquire because the full phase encoding must be sampled before reconstruction. Of note, some breast MR spectroscopic imaging studies have used a phase-encoding scheme with weighted averaging to increase SNR and reduce the leakage of signals between adjacent voxels in the MR spectroscopic imaging grid, but this also causes blurring. Commonly these studies only report the nominal voxel size, but in terms of SNR the effective voxel size is substantially larger than the nominal size, and this should be considered when comparing studies.
SVS and MR spectroscopic imaging offer distinct advantages and disadvantages for breast MR spectroscopy. SVS can generally produce better spectral quality, as it has better localization performance, and the scanner calibrations (B 0 shim, flip angle, water and fat suppression) can be better optimized over the smaller region. Furthermore, SVS is less sensitive to subject motion during the scan, and is more easily used for quantitative spectroscopy analyses. However, SVS requires that the voxel placement be performed while the patient is in the scanner. Some expertise is required to perform this quickly and consistently, and it can be difficult to integrate into the clinical workflow.
MR spectroscopic imaging has the advantage of producing a grid of spectra providing information about how the chemical content varies in space. This grid can be used to produce metabolite maps that show the spatial variation of metabolites throughout the breast. Having the spatial information also allows the reviewer to select the region of interest retrospectively, thus reducing the need for real-time expertise during the MR scan and improving the workflow for MR spectroscopy acquisition. The additional spatial information opens the door to a variety of analysis approaches: it is possible to characterize a lesion using the worst-case spectrum, taking an average over the lesion with or without retrospective grid shifting, measuring the heterogeneity over the lesion, or comparing the lesion with adjacent normal glandular tissue. Finally, although MR spectroscopic imaging requires more time than SVS to acquire a water-reference scan for quality control or quantification purposes, recent work using fast encoding and optimized acquisition protocols have shown that it is possible to acquire reference spectra in acceptable measurement times.
Breast MR spectroscopy protocols typically use water suppression to reduce the size of the water peak in the spectrum, which can introduce baseline distortions if left unsuppressed. Lipid suppression is also sometimes used for the same purpose. It can be advantageous, however, to leave some residual water and/or lipid resonances for use in performing frequency correction, phase correction, and referencing. If lipids are left unsuppressed, echo-time averaging can be used to reduce sideband artifacts. The size of the sideband artifacts can vary substantially between MR scanners, and most clinical systems have smaller sidebands than were reported originally at 4 T.
Both SVS and MR spectroscopic imaging techniques produce better quality spectra if the B 0 field is uniform across the region of interest. A uniform B 0 field leads to narrow spectral line widths, which increases SNR, provides better separation of different chemical resonances, and improves fitting of spectral peaks. In MR spectroscopic imaging, an inhomogeneous B 0 field also increases signal leakage between voxels and subsequently causes baseline distortions. The scanner’s B 0 field is typically very uniform when empty, but introducing a body into the scanner produces distortions of the B 0 field caused by differences in magnetic susceptibility of the various tissues.
The distortions are largest at the interface between different materials, such as between adipose and glandular tissues or between skin and air. These distortions can be partially corrected by “shimming” the B 0 field, which consists of measuring the B 0 field variations and adjusting electrical currents in the compensating shim coils. The shimming capabilities vary between different scanner models, but most systems can reasonably correct macroscopic B 0 distortions using automated shimming techniques. In the breast, there are also microscopic B 0 distortions generated at each interface between water and fat. These distortions are not correctable with shim coils, and lead to spectra with larger line widths than are found in brain or prostate spectra. The best spectral resolution is obtained in highly uniform regions, such as cysts and focal masses with no adipose tissue. With practical voxel sizes, most voxels include a mixture of lesion, gland, and adipose tissues, and regions with more adipose content will produce spectra with larger line widths. Spectral resolution is an important quality metric for breast MR spectroscopy, with typically reported full-width at half-maximum (FWHM) of approximately 0.25 ppm (16 Hz at 1.5 T, 32 Hz at 3 T) for the unsuppressed water resonance. If the spectral resolution is poor after automated shimming, manual adjustment of shim currents can often give better results but requires expertise and a minute or two of time.
Analysis
Software packages provided by MR system vendors can be used for processing breast spectra, but spectroscopy software such as jMRUI or custom-built code are also commonly used. Preprocessing of breast spectroscopy data should be minimal and consistent. Light filtering is common, but using excessive filtering can smooth out spectral noise and create artificial resonances that can be misinterpreted. Frequency referencing and phasing are often necessary to compensate for scanner miscalibration or motion during the scan. Frequency referencing should be done relative to the unsuppressed water peak, as the water-lipid frequency difference can vary with B 0 shim quality. A subjective quality assessment should be performed by a reviewer with experience in spectroscopy to confirm successful preprocessing and identify spectral artifacts. Objective quality metrics should also be calculated, most importantly the unsuppressed water FWHM to assess shim quality and the unsuppressed water SNR to assess sensitivity.
Detection is a critical part of all spectral analyses, and in many studies the detection of a tCho peak itself has been used as the primary outcome of the measurement. Detection can be assessed subjectively by one or more reviewers with experience in spectroscopy. More objectively, detection can be defined as a tCho peak above a predetermined SNR threshold, most commonly SNR ≥ 2 or greater. Note that even SNR-based detection can be somewhat subjective if performed manually, as the baseline correction (if used) can influence the result. Furthermore, the SNR measurement will vary with different acquisition parameters and filtering, and several different definitions of SNR are still commonly used.
Many experimental factors can affect the measurement sensitivity and, thus, the SNR of the tCho peak, including field strength, receive coil sensitivity profile, system electronics, and numerous sequence parameters such as voxel size, averaging, flip angle, and readout bandwidth. Quantitative analysis methods seek to compensate for all of the experimental factors and produce a measurement of the metabolite concentration in absolute units. Using a quantitative metric enables comparison of results across different systems, field strengths, and vendors, and potentially with ex vivo assays.
Quantification of tCho with internal referencing
Two approaches have been used for performing absolute quantification in breast MR spectroscopy. The most commonly used approach is internal referencing, whereby the tCho signal is normalized by the unsuppressed water signal from the same region, producing a concentration in units of moles per kg water. This approach assumes all tCho metabolites are in an aqueous compartment and not in adipose tissue. The strength of this approach is its simplicity. Because water and tCho are measured from the same region, experimental effects such as poor B 0 shim, variable receive sensitivity, localization imperfections, and flip-angle variations affect the tCho and water peak similarly, so the ratio of tCho to water is unaffected. It also compensates for the presence of adipose tissue within a voxel, as this decreases tCho and water equally. This approach does require a separate measurement of the unsuppressed, fully relaxed water signal, which can be done quickly with SVS but may require a long time with MR spectroscopic imaging acquisitions. Although this method is independent of the volumetric water concentration, it is sensitive to the nuclear MR visibility and T 2 relaxation rate of water. The water T 2 has been shown to change in response to therapy, and also differs between benign and malignant lesions. With SVS the water T 2 can and should be measured, but this may require a prohibitively long acquisition time when used with MR spectroscopic imaging.
Quantification of tCho with external referencing
The second approach for quantifying breast spectra uses external referencing. In this approach, a phantom with a known chemical concentration is placed within the field of view of the breast coils. MR spectroscopy measurements are acquired from both the subject and the reference phantom, and the in vivo concentrations are calculated by correcting for the differences between the reference phantom and the in vivo measurement. The differences can be substantial, and may include voxel size, B 0 shim differences, transmit and receive efficiency, and adipose partial volume. It has the distinct advantage that it is entirely independent of the water signal in the breast. It is not yet clear which of these two approaches is preferred. To date there have been more studies using the internal referencing approach, likely owing to its simplicity, but there is some vendor support for the external referencing approach.
Semiquantitative analyses of tCho
Semiquantitative approaches use an easily measured parameter, such as tCho SNR, peak integral, or peak height, as an indicator of the tCho level in the lesion. This strategy is termed semiquantitative because it produces a continuous quantity that can be used for statistical treatments (reproducibility, receiver-operator characteristic [ROC] analyses, and so forth), but it does not attempt to correct for all experimental factors as in the fully quantitative methods. This approach can be useful for a controlled single-site study, or in longitudinal studies where many experimental factors can be controlled, but the results are not as generalizable as with the fully quantitative methods. Adding additional corrections, such as normalizing by voxel volume or correcting for receive coil sensitivity, brings these measurements closer to absolute quantification in terms of both generalizability and complexity.
Potential applications
Diagnosis
The most established use of breast MR spectroscopy is to distinguish between benign and malignant lesions in the diagnostic setting using the elevated tCho level as an indicator of malignancy. MR imaging is now established as the most accurate imaging modality for diagnosing breast cancer, but although it has high sensitivity (92%), its specificity is lower (78%) and more variable. MR spectroscopy has the potential for improving the accuracy of an MR scan by offering better specificity. A substantial body of work has investigated the diagnostic performance of MR spectroscopy in the breast. A recent meta-analysis by Baltzer and Dietzel compiled the results from 19 studies and found that MR spectroscopy alone had combined sensitivity of 73% and specificity of 88%. Specificity of MR spectroscopy was also relatively consistent across studies, whereas the sensitivity was variable: a seemingly ideal complement to the diagnostic performance of MR imaging. This level of performance is remarkable considering the large variation in methods used across these studies, including both SVS and MR spectroscopic imaging acquisitions, and analyses ranging from detection to absolute quantification.
The first report measuring tCho in the human breast was by Roebuck and colleagues in 1998. In this work 17 subjects were studied with single-voxel MR spectroscopy, and tCho levels were quantified using an external referencing method. Although the tCho concentrations themselves were not different between the benign and malignant groups, it was noted that a tCho resonance was more likely to be detected in malignant lesions. The investigators therefore proposed using the detectability of a tCho peak as a marker of malignancy, and showed good diagnostic performance (sensitivity 70%, specificity 86%). Several subsequent articles adopted the detectability approach and reported similar results. Katz-Brull and colleagues performed a meta-analysis of 5 studies, all using comparable acquisition methods and qualitative tCho detection as a marker of malignancy, and found a combined sensitivity/specificity of 83%/85%. Tse and colleagues later imposed the criterion of SNR of 2 or greater to make the tCho detection more objective, an improvement that has been widely adopted and has produced comparable diagnostic performance.
Of note, all of the aforementioned studies using detection as a criterion of malignancy used a variable voxel size to best match the lesion geometry. If the voxel size is adjusted to match the lesion size, the larger lesions are measured with greater sensitivity than are smaller lesions, and lower concentrations of tCho can be detected. Some studies have reported that in the diagnostic setting, malignant lesions are larger than benign lesions, although some studies have reported no difference in size. Therefore lesion size is a potential confounder in that a larger mass is more likely to exhibit detectable tCho than is a smaller mass with the same tCho concentration. To control for this effect, Tozaki and Fukuma performed an MR spectroscopy study using detection as the criterion for malignancy, but using a fixed voxel size (3.375 mL). This approach resulted in specificity (85%) that was comparable to the variable-voxel studies, but with a notably lower sensitivity (44%). These results suggest that using variable voxel size can potentially improve the diagnostic performance of the MR spectroscopy measurement, but it should be recognized that this may reflect lesion size as well as metabolism.
Using tCho detectability as an indicator of malignancy has been very successful to date. However, with the greater sensitivity provided by newer breast coil designs and higher-field MR scanners, it is now well established that tCho can be detected in normal fibroglandular tissues and many different types of benign lesion. Under these circumstances, diagnosis can be performed using quantitative and semiquantitative measurements, combined with a ROC-curve analysis selecting an optimal threshold for distinguishing between benign and malignant lesions.
The most widely used fully quantitative approach is the internal reference technique. The initial studies performed with this technique on a 4 T system found that malignant lesions had a higher average [tCho] (2.2 mmol/kg) than benign lesions (0.2 mmol/kg), and using a cutoff of 1.0 mmol/kg produced sensitivity of 61% and specificity of 83%. Subsequent studies have been performed using water internal referencing on 1.5 T clinical MR scanners. Thakur and colleagues reported sensitivity/specificity of 96%/93%, Baek and colleagues reported sensitivity/specificity of 66%/92%, and Sah and colleagues reported sensitivity/specificity of 76%/75%. Across these studies, the mean [tCho] in malignant lesions ranged from 2.7 to 5.3 mmol/kg, whereas in benign lesions the mean [tCho] ranged from 0.1 to 1.6 mmol/kg. Dorrius and colleagues also used water as an internal reference, but assumed a fixed tissue water concentration (82%) to report volumetric concentrations, with proportionally smaller numerical values. With this metric, they found the highest [tCho] in malignant lesions averaged 4.1 mM while benign lesions averaged 1.2 mM, and these could be distinguished with 100% accuracy using a cutoff of a 1.5 mM. Diagnostic results with external referencing have only been reported by 2 groups, but have found concentrations comparable with internal referencing results. Roebuck and colleagues found malignancies with tCho concentrations from 0.4 to 2.0 mM but, because of a single high-concentration benign lesion (tubular adenoma 5.8 mM), did not find the quantitative results diagnostic. Mizukoshi and colleagues more recently used external referencing methods for a large diagnostic study of 208 cases and found sensitivity/specificity of 68%/70%, with malignant lesions averaging 1.1 mmol/kg and benign lesions averaging 0.4 mmol/kg. Across these quantitative studies the concentrations are reasonably consistent, but there are variations in concentration levels, optimal cutoff, and diagnostic performance.
The most common semiquantitative approach is to use the tCho SNR as an indirect indicator of the tCho concentration. Lipnick and colleagues used a single-voxel 2D localized correlated spectroscopy (L-COSY) technique to measure both tCho and fat peaks, and found that with a threshold of 2 the tCho SNR gave nearly 100% accuracy with a 1-mL voxel size. Jacobs and colleagues and Baek and colleagues both used 2D MR spectroscopic imaging at 1.5 T with 1-mL nominal voxel sizes, and found similar SNR thresholds (4 and 3.6) and similar sensitivity/specificities of 85%/85% and 81/78%, respectively. Gruber and colleagues used 3D MR spectroscopic imaging at 3 T and found that an SNR threshold of 2.6 led to sensitivity/specificity of 97%/84%. Rather than tCho SNR, Sardanelli and colleagues used the peak integral from their spectral processing software as a semiquantitative metric, used SVS with a variable voxel size, and explored the impact of normalizing the integral by the voxel size. Unexpectedly they found that the raw tCho integral, which reflects both tCho concentration and lesion size, gave better diagnostic performance (sensitivity/specificity 90%/92%) than normalized integral (sensitivity/specificity 84%/89%).
All three analysis approaches, namely detection, absolute quantification, and semiquantitative metrics, have been used successfully for diagnosing breast lesions. In the meta-analysis by Baltzer and Dietzel, no statistically significant difference in performance was found between the different analysis approaches, although there appears to be a trend that the fully quantitative methods have somewhat lower performance than the total pooled result. This seems to be a paradox, as the quantitative methods should in theory provide a more direct measure of the lesion metabolism, and therefore provide better specificity for distinguishing benign from malignant lesions. One likely contributing factor is that the corrections used in quantitative methods add noise to the measurements, thus decreasing the overall performance. This drawback potentially adds to the complexity of quantitative methods, and future work is required to measure and minimize the impact of these corrections. Another explanation is that lesion size and homogeneity affects the tCho SNR and improves its performance via mechanisms that are corrected with quantitative methods. In addition to the previously mentioned size bias in studies with variable voxel sizes, a large, homogeneous lesion can also produce a higher tCho SNR than a smaller lesion with the same concentration, even when measured with methods using a fixed voxel size, owing to better B 0 shim quality, reduced partial volume, and (with MR spectroscopic imaging) point-spread function effects. These factors are at least partially corrected with the quantitative methods.
Limitations of breast MR spectroscopy
A major limitation of breast MR spectroscopy in diagnosis is its low measurement sensitivity (SNR) in comparison with imaging. Although MR imaging can characterize small lesions, most diagnostic MR spectroscopy studies have focused on lesions with a size of 10 mm or greater. In smaller lesions, the measurement sensitivity is too low to measure even high concentrations of tCho. Because of this, diagnostic sensitivity is poorer when studying smaller lesions. This feature was noted by Katz-Brull and colleagues in their meta-analysis of studies using tCho detection, in which they found decreasing diagnostic sensitivity with smaller lesion sizes. Tozaki and Fukuma, who included small lesions in their diagnostic study, reported a diagnostic sensitivity of 82% in lesions larger than 15 mm in maximum length, but only 42% when considering all lesions. False-negative lesions had a significantly smaller size (mean 13 mm) compared with true positive lesions (mean 25 mm). The same problem exists when using quantitative methods. Baek, who performed quantitative analyses using water as an internal reference, also reported lower diagnostic sensitivity in smaller lesions, with sensitivity of 82% for lesions greater than 3 cm, 70% for lesions 2 to 3 cm, and 46% for lesions 1 to 2 cm. This size limitation has a major impact on the clinical utility of MR spectroscopy for diagnosis.
Some investigators have looked to MR spectroscopy to reduce the need for biopsy in benign lesions. This approach would require a high negative predictive value, that is, very few false-negative findings. Several studies have reported no false negatives, but the majority of studies have reported malignant cases with no detectable tCho. Avoiding biopsy may be possible by lowering the threshold for malignancy, and considering only larger lesions that give better SNR. Unfortunately, the greater clinical need is to avoid biopsy on the smaller lesions, which are more difficult to biopsy and characterize morphologically.
The specificity of MR spectroscopy appears to be reasonably high and consistent, but most studies have reported some false positives. There does not seem to be a specific benign pathology implicated, as there have been false positives reported in cases of tubular adenoma, fibroadenoma, fibrocystic changes, intraductal papilloma, and atypical hyperplasia. One proposed method for improving specificity is to consider the precise frequency of the tCho peak. Stanwell and colleagues reported that in normal fibroglandular tissue there is often a “tCho” peak, but it is centered at 3.28 ppm, as opposed to malignancies that show a tCho peak at 3.22 ppm. Their explanation is that the composition of tCho is different in these 2 cases, with normal tissue having more GPC, taurine, and myo -inositol, and malignant lesions having higher PC. Subsequent studies generally support this idea, but have found mixed results. Tozaki and Fukuma considered a tCho peak of 3.28 ppm as a benign finding and reported an overall accuracy of 63.2%, whereas if they had treated this as a malignant finding their accuracy would have dropped to 60.8%. Basara and colleagues also reported improved accuracy when considering peak frequency. Baltzer and colleagues observed that all benign tCho peaks were at 3.28 ppm, but the frequency of malignant tCho was variable. Dorrius and colleagues did not find a frequency difference between benign and malignant cases, and Tozaki and colleagues noted that one malignant case had tCho at 3.27 ppm. One explanation for the mixed findings is that accurate frequency referencing can be challenging. There is a small frequency difference (∼4 Hz at 1.5 T) relative to the typical spectral resolution and respiratory variations found in the breast, and both B 0 inhomogeneity and chemical-shift artifacts can make the frequency assignments within a single spectrum inconsistent. Furthermore, if the tCho peak has contributions from multiple metabolites it should exhibit a continuously variable frequency rather than one of two distinct values. Nevertheless, the evidence indicates that this may have diagnostic value and merits further assessment.
The future for using MR spectroscopy in diagnosing breast lesions appears promising. Continued work on refining acquisition and analysis methods is required, but it seems likely that this will lead to a standardized approach, which is needed for setting criteria for malignancy that can be generalized between sites. The low SNR of spectroscopy is a serious limitation: MR spectroscopy does not seem likely to be useful for diagnosing small lesions (<10 mm) that can be detected with contrast-enhanced MR imaging. Because of this, MR spectroscopy will remain an adjunct to MR imaging, and the question of whether MR spectroscopy will become part of standard diagnostic practice will depend on its ability to add specificity when combined with an MR imaging study.
Treatment Response
MR spectroscopic measurements of tCho have also been used to monitor response to neoadjuvant chemotherapy (NCT) in breast cancer. While MR imaging is commonly used for assessing residual disease, there remains a need for imaging biomarkers that can identify response early in the course of therapy so that treatment can be modified for the best possible outcome. Contrast-enhanced MR imaging has also shown promise as an early response indicator, particularly when using volumetric measurements that can distinguish responders from nonresponders before the second cycle of therapy. The tCho concentration within a tumor has also been proposed as an early response indicator, based on the idea that therapy-induced changes in cell proliferation should logically precede anatomic changes.
The first observation regarding tCho and therapy response was by Kvistad and colleagues, who observed in a single subject that a tumor that had a detectable tCho peak before treatment exhibited no tCho after treatment. A subsequent work by Jagannathan and colleagues observed that a tCho peak either decreased or disappeared in 10 subjects receiving chemotherapy, indicating that tCho levels were sensitive to treatment. Since these early studies there have been a dozen published reports of studies using tCho for monitoring therapy response in breast cancer, reviewed recently by Sharma and colleagues. These studies, however, are highly variable in methodology used for measuring tCho, timing of the monitoring scans, and the response outcome.
Pathologic response is a widely used outcome for assessing the efficacy of NCT. The majority of the studies comparing MR spectroscopy with pathologic outcome support the finding that early decreases in tCho are associated with pathologic response. Baek and colleagues found that decreases in the tCho concentration were larger in pathologic complete responders, but only at their second follow-up time point (69 days); at their earliest follow-up scan (20 days) there was no difference between responders and nonresponders. Tozaki and colleagues reported that using quantitative external referencing, pathologic responders showed a larger drop in [tCho] than nonresponders after 2 cycles of chemotherapy. A subsequent report from the same group found in a small study (7 patients) that a decrease in the semiquantitative tCho integral after the first cycle of chemotherapy was associated with pathologic response. As part of a multiparametric imaging study that included MR spectroscopic imaging, Jacobs and colleagues showed a significant decrease in tCho SNR for pathologic complete responders after one cycle of chemotherapy, and no significant difference for nonresponders. By contrast, Bathen and colleagues observed that both pathologic responders and nonresponders showed decreased tCho SNR after once cycle of chemotherapy, with no significant difference between the groups.
Other studies have compared MR spectroscopy measurements with clinical outcomes based on imaging size measurements or palpation. Meisamy and colleagues used quantitative internal referencing, and found that a decrease in [tCho] measured 1 day after the initial treatment was associated with a size response at the end of chemotherapy, based on modified Response Evaluation Criteria in Solid Tumors (RECIST). Their initial study demonstrated 100% accuracy in 13 subjects, whereas a follow-up report including 28 cases showed 82% accuracy in distinguishing responders from nonresponders. Baek and colleagues also compared quantitative internal referencing with RECIST-based size changes, and found that a tCho decrease after one cycle was associated with response. Using an MR spectroscopic imaging protocol, Danishad and colleagues found that decreases in tCho SNR after one cycle of therapy were associated with response based on bidimensional palpation.
Looking across all these studies, it appears that early tCho decreases are likely to indicate successful therapy. Three of these studies also tried to determine whether MR spectroscopy could identify responders earlier than MR imaging size measurements. These findings were inconclusive: in each study MR imaging was also able to distinguish response as early as MR spectroscopy. Several studies also assessed whether pretreatment tCho levels were associated with response. Only one study found that responders had a higher pretreatment tCho than nonresponders, with the other 5 studies finding no difference between the groups.
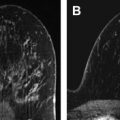
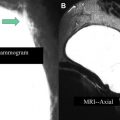
Most of these studies applied MR imaging and MR spectroscopy after the first or second cycle of therapy, which can be very practical, as the scanning can be done when the patient returns to the clinic to begin the next treatment cycle. An exception is the study design of Meisamy and colleagues, in which patients were scanned 1 day after receiving the first course of treatment. No subsequent studies using this early time point have yet been reported, although the ACRIN 6657 extension study, which assessed response with MR spectroscopy 1 to 4 days after starting therapy, has completed accrual, and results are expected soon. One advantage of this very early time point is that it minimizes the potentially confounding effect of anatomic response, as shown in the example of Fig. 1 . In this patient with invasive ductal carcinoma, [tCho] decreased 1 day after beginning neoadjuvant chemotherapy while breast MR imaging demonstrated no anatomic changes. As in the diagnostic setting, the various methods for measuring tCho can be affected by lesion size and heterogeneity, and it may be challenging to separate the effects of metabolic and anatomic changes. The analysis methodology, combined with the voxel sizing strategy, can affect these relative contributions. In some studies the voxel size was modified to match the changing lesion size over the course of therapy. In this case, the semiquantitative methods may reflect both metabolic and anatomic changes, which introduces bias but may lead to better performance.
Related posts:
 Breast Magnetic Resonance Imaging Technique at 1.5 T and 3 T
 Updates and Revisions to the BI-RADS Magnetic Resonance Imaging Lexicon
Screening MR Imaging Versus Screening Ultrasound
BI-RADS 3 for Magnetic Resonance Imaging
Updates and Revisions to the BI-RADS Magnetic Resonance Imaging Lexicon
Screening MR Imaging Versus Screening Ultrasound
BI-RADS 3 for Magnetic Resonance Imaging
 Evaluation of Breast Silicone Implants
 Magnetic Resonance Imaging–Guided Biopsy of the Breast
Stay updated, free articles. Join our Telegram channel

Full access? Get Clinical Tree


