Fig. 10.1
Image of static-fluid MR urography (SSFSE T2) 8 cm thick which demonstrates considerable right hydroureteronephrosis (fibrous tissue due to multiple episodes of endometriosis in the distal third of the ureter)
The second method consists in the acquisition of multiple thin layers (multislice technique, 3–5 mm thick) with 3D TSE (or SSFSE) T2W sequences subsequently processed with various algorithms including the most widely used MIP algorithm. For improved urographic image quality on oblique and lateral MIP images, a 50 % overlap between the source images is recommended and should be considered during the evaluation of both partition images and 3D reconstructions. Compared to the previous these sequences have the advantage of allowing an improved assessment of details. The longest duration and possible masking by other structures are among the disadvantages that should be remembered (e.g., ascites, bowel loops, etc.). The 3D TSE T2-weighted sequences are obtained with respiratory triggering (Fig. 10.2).
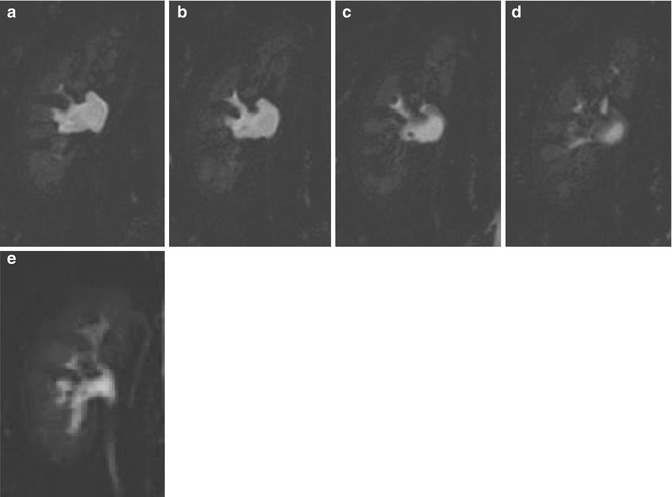
Fig. 10.2
Multislice acquisition partition images (a–d) (3D TSE T2W, 3 mm thick) that demonstrate a small hypointense area in the context of the renal pelvis, only intuitable in MIP elaborations (e). It refers to the presence of a millimetric calculi
T2-weighted sequences are indicated in particular for hydronephrosis assessment not allowing, however, to recognize the cause of the obstruction [3]. Static-fluid MR urography does not require the excretion of contrast agent and is therefore useful for demonstrating the collecting system of an obstructed, poorly excreting kidney [4]; it permits the assessment of the urinary tract in particular if it is dilated, while it is not accurate in the evaluation of the urinary tract in poor condition or just not dilated. In these latter cases (patients with non-dilated systems), the use of hydration, diuretics, and, according to some authors, compression may enhance the quality of MR urography [5].
CE-MRU images are obtained with fat-suppressed 3D GE T1W sequences (THRIVE, VIBE, LAVA, etc.) after the administration of intravenous contrast agent. The recommended acquisition plan is coronal with a wide FOV in order to allow the study of the entire urinary tract in one acquisition. To obtain a better spatial resolution, in particular for the study of the intrarenal urinary tract, it is good to use a kidney-targeted FOV. 3D sequences will result in about 70 layers of 1.5 mm, which have to be reconstructed with MIP algorithm (Fig. 10.3).
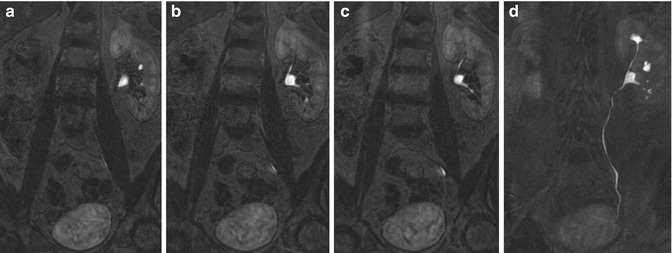
Fig. 10.3
3D GE T1 THRIVE partition images with 1.5 mm-thick (a–c) and relative MIP reconstruction (5 cm) (d) focused on the left kidney and urinary tract
During reporting both partition and reconstruction images are evaluated. For patients with a limited capacity to hold their breath, the use of EPI sequence (reduced acquisition time) has been described; these techniques are characterized, however, by low spatial resolution [6]. The 3D GE T1W sequences are obtained with the breath-hold technique. It has been shown that the use of standard doses (0.1 mmol/kg) of gadolinium has as a consequence an excessive concentration of the latter in the urinary tract which reduces the signal intensity of the urine due to T2* effects. Best results are obtained with reduced doses (0.01–0.05 mmol/kg) [7]. Recently the use of a liver-specific contrast agent with minimal renal excretion (Gd-EOB-DTPA) which would allow adequate signal from the urinary tract in the absence of T2* artifacts has been proposed. The quality of MR urography images is also improved by the administration of a diuretic (furosemide) at a relatively low dose of 0.05–0.1 mg/kg from 1 to 5 min before the administration of contrast agent. Furosemide leads to greater distension of the urinary tract, better distribution of contrast agent, and reduced concentration of the latter in the urine, thus reducing the T2* effect. The contraindications to the administration of furosemide are hypersensitivity to the drug, hypotension, and anuria, so there are no absolute contraindications (Fig. 10.4) [8–12].
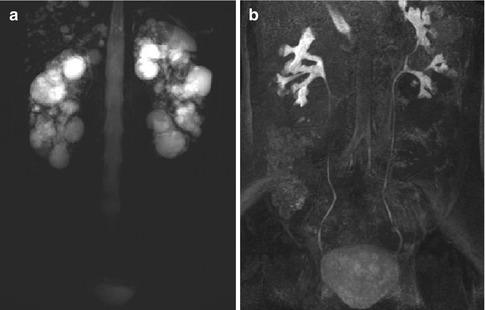
Fig. 10.4
Patients with polycystic kidneys (APDK); static-fluid-MR urography SSFSE T2W 8 cm thick (a) where the pelvis and calyces are not properly evaluated in relation to the high signal intensity from multiple cysts; MIP processing sequence of excretory MR urography 3D GE T1 THRIVE (b) in which the intra- and extrarenal excretory pathways are the only ones appearing hyperintense (which do not exhibit expansion)
Another possible MR study is the use of diffusion-weighted imaging (DWI) sequences, which provides functional but not anatomical information, in particular about the degree of freedom of movement of the water molecules inside cells and tissues. The sequences most commonly used are the echo planar (EPI) with selective saturation of fatty tissue, if possible optimized using respiratory gating; they are fast running, but with poor spatial resolution. We recommend the use of at least a pair of b-values (usually 0 and a b-values ranging between 800 and 1,000 s/mm2 × 10–3 with 1.5 T magnets), in order to create a corresponding ADC map and to avoid, or at least resolve, typical artifacts as, e.g., “shine-through.” Tissues in which cells are highly packed, or in which cells show a high nucleus-cytoplasm ratio, will tend to have a high signal in DWI sequences and consequently low intensity in ADC maps, as well as low numerical value of ADC, and vice versa. In clinical practice, these sequences may be useful, for example, in the differential diagnosis between hydronephrosis (Fig. 10.5) and pyonephrosis (the presence of purulent material determines signal restriction which can be seen as a hyperintensity in DWI and hypointensity on the ADC maps), in the evaluation of extension and especially in follow-up of pyelonephritis and abscesses without the need to use a contrast agent (e.g., pregnant women), as well as in the differential diagnosis between different masses (although there is still no uniqueness on the values of the ADC, often too similar between tumors histologically different), in which the neoplastic lesion tends to have higher signal restriction than that of the adjacent renal tissue, due to the high cellularity, usually seen in malignancies.
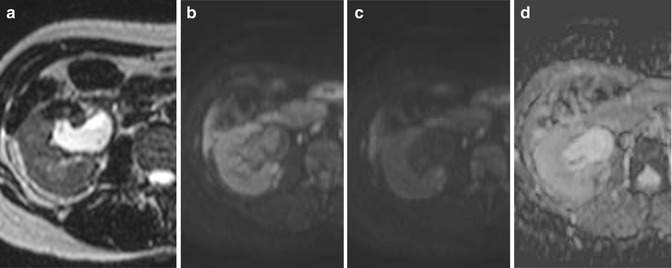
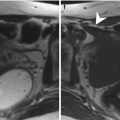
Fig. 10.5
SE breath-hold image T2W-SENSE with a thickness of 3 mm (a) that shows the presence of a moderate dilatation of the right renal pelvis in a context of hydronephrosis, with only a slight inhomogeneity of signal; DWI with b = 500 (b), signal intensity of the content of the renal pelvis comparable to that of the adjacent parenchyma, in relation to the T2* effect of urine that determines the permanence of high signal intensity in the sequences with DWI values b to medium–low; DWI with b = 1,000 (c) where you can appreciate the distinct hypointensity of the content of the renal pelvis, evidence of the high diffusibility of water molecules, confirmed in its ADC map that shows clear hyperintensity (d)
In addition to the sequences targeted for the study of the urinary tract are performed sequences for the study of renal parenchyma.
10.1.3 Patient Preparation
The patient usually lies supine with the arms raised above the head. Patients should empty the bladder before starting the exam. The use of oral negative contrast material to avoid hyperintense signal from intestinal loops may be useful even if not habitually used.
10.2 Clinical Applications
10.2.1 Congenital Anomalies
MRI is appropriate for the study of various congenital anomalies such as duplication of the excretory system, megaureter, and ureteropelvic junction (UPJ) obstruction syndromes [13, 14]. Duplication of the ureter may be incomplete or complete (Fig. 10.6a), and in the latter case the upper ureter pole typically inserts inferior and medial to the lower pole ureter and is more frequently the site of obstruction and may be associated with ureterocele (Fig. 10.7). MRI also allows evaluation of possible ectopic outlets.
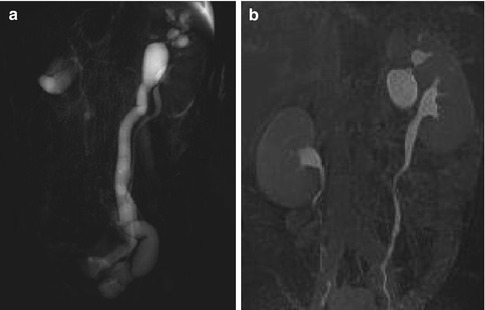
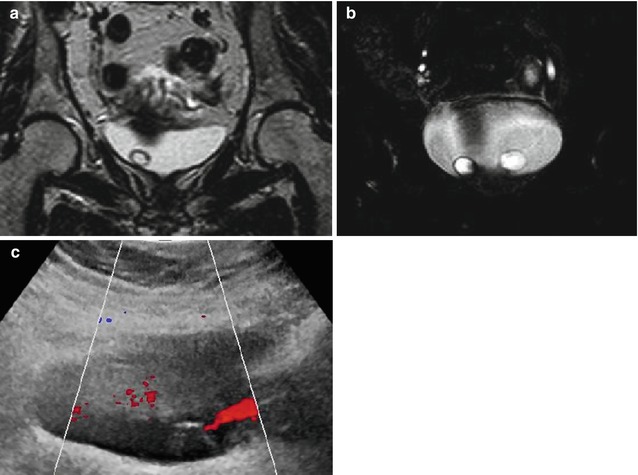
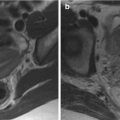
Fig. 10.6
(a) Static-fluid MR SSFSE T2W with a thickness of 8 cm which demonstrates a left double district with hydroureteronephrosis originating from the upper third of the kidney; (b) MIP processing of the excretory MR urography sequence 3D GE T1W THRIVE: it provides not only morphological but also functional information, demonstrating delayed opacification of the ureter originating from the upper third; it is possible to appreciate the dilatation of the renal pelvis and major calyces, attributable to reduced and delayed excretion capacity of that portion of the kidney; opacification of the urinary tract originating from the middle and lower third is normal
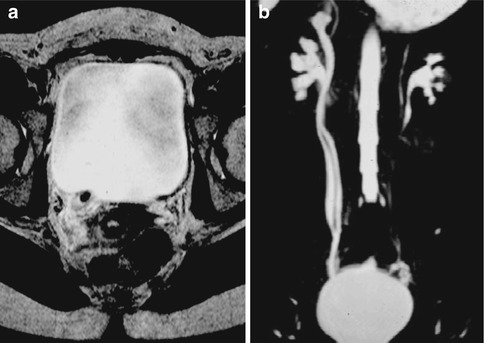
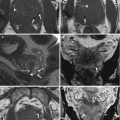
Fig. 10.7
SE T2W breath-hold image SENSE 3 mm thick (a), acquired on a coronal plane passing through the bladder, which demonstrates the presence of a round mass with well-recognizable walls, regular and hypointense, with internal signal intensity comparable to that of the bladder urine; in partition image (b) of multislice 3D TSE T2W acquisition (with a thickness of 3 mm), the presence of similar mass is observed also on the left, in a context of bilateral ureterocele, comparable to what is observed in the echo-Doppler imaging (c)
Ureteropelvic junction (UPJ) obstruction syndrome is the most frequent reason of urinary obstruction in children. There are many different causes, and among the more frequent we can list scars, vascular compressions, and impaired ureteral innervation. UPJ is the most common site of urinary obstruction in children. In vascular compression cases may be useful to perform an angiography sequence to clearly demonstrate the responsible vessel (Fig. 10.8).
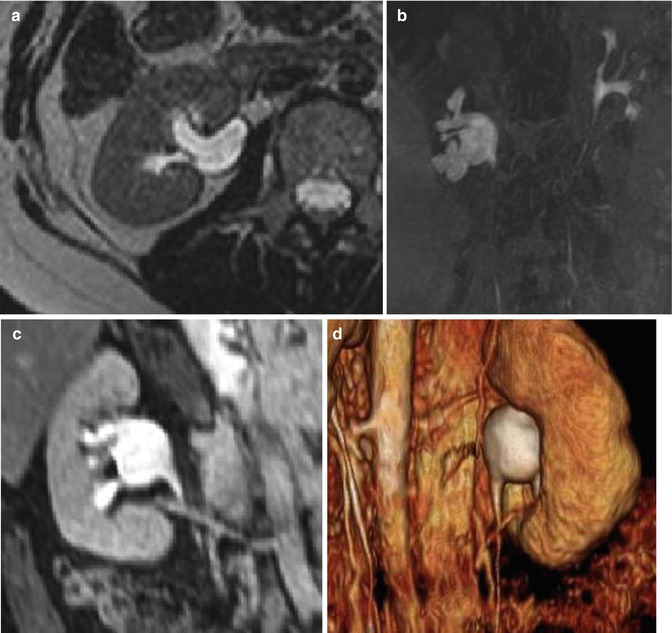
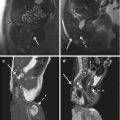
Fig. 10.8
A right kidney-targeted image SE T2W breath-hold SENSE with a thickness of 3 mm (a) acquired on the axial plane, which shows a moderate hydronephrosis of the pelvis and calyces. (b) MIP processing of excretory MR 3D GE T1W THRIVE sequence shows an abrupt change in caliber, on the right, between the renal pelvis and ureter at the ureteropelvic junction. Oblique MPR obtained from 3D GE T1W THRIVE sequences (c) and three-dimensional volume-rendered image (d) performed after injection of contrast material highlight the presence of a lower polar renal artery; in the segment below the ureter shows a normal caliber in a context to be referred to ureteropelvic junction syndrome
10.2.2 Urolithiasis
MR imaging is useful, in second place than ultrasonography, especially in the evaluation of urolithiasis in pediatric patients and pregnant women [14]. Most urinary tract calculi appear as signal voids in both T1W and T2W sequences. At both static-fluid and excretory MR urographies, calculi appear as hypointense surrounded by urine or contrast material that is hyperintense (Fig. 10.9). T2-weighted sequences also allow to highlight the ureteral edema and perinephric and periureteral fluid with suffusion of fat at these sites. Small stones can be misunderstood, especially in static-fluid MR images of large thickness. In this regard, the partition images of the 3D TSE sequences and conventional additional sequences at the site of the obstruction are useful (Figs. 10.9, 10.10, and 10.11).