Cognitive functions are fundamental to being human. Although tremendous progress has been made in the science of cognition using neuroimaging, the clinical applications of neuroimaging are just beginning to be realized. This article focuses on selected technologies, analysis techniques, and applications that have, or will soon have, direct clinical impact. The authors discuss how cognition can be imaged using MR imaging, functional MR imaging, positron emission tomography, magnetoencephalography and electroencephalography, and MR imaging diffusion tensor imaging. A unifying theme of this article is the concept that a more complete understanding of cognition only comes through integration of multimodal structural and functional imaging technologies.
Cognitive functions are fundamental to being human. Although tremendous progress has been made in the science of cognition using neuroimaging, the clinical applications of neuroimaging are just beginning to be realized. Rather than give an exhaustive review of the neuroimaging of cognition, this article focuses on selected technologies, analysis techniques, and applications that have, or will soon have, direct clinical impact. The authors discuss how cognition can be imaged using MR imaging, functional MR (fMR) imaging, positron emission tomography (PET), magnetoencephalography and electroencephalography (MEG/EEG), and MR imaging diffusion tensor (DT) imaging. Many of these technologies have been topics in other articles, so the authors briefly introduce a few new ones in terms of image integration across the more familiar modalities.
Technologies for functional imaging
Cognition is a large topic and the authors focus on cognition of primary sensory areas, language, and memory. A unifying theme of this article is the concept that a more complete understanding of cognition only comes through integration of imaging technologies. The imaging technologies are structural (MR imaging, DT imaging, CT) and functional (PET, fMR imaging, MEG/EEG, optical) techniques, and both have important roles in imaging cognition. Further, functional techniques can be thought of as originating from two sources: neuroelectric (EEG and MEG) and hemodynamic (PET, single photon computed tomography (SPECT), fMR imaging, optical). Exploring the structure-function relationships found with neuroimaging is an area of intense research. Understanding the structure-function relationship requires the integration across imaging modalities, and even by integrating behavioral metrics .
Each imaging technology has its own individual strengths and weaknesses, typically with some trade-off between temporal and spatial resolution. The electromagnetic imaging techniques include MEG and EEG, which may not be thought of as imaging at all, yet do have excellent temporal resolution because they measure the underlying neural currents directly, on the order of milliseconds, although with limited spatial localization. fMR imaging has excellent spatial resolution, on the order of millimeters, but it depends on the hemodynamic response, which limits the temporal resolution. By combining imaging technologies, it is possible to optimize the temporal and spatial scale, to localize accurately and characterize cognition noninvasively.
Using sensory stimulation to probe for disorders of higher cognitive function
Although cognitive studies often use tasks that involve higher cognitive function, using sensory stimuli that have a cognitive correlate, such as the mismatch negativity and steady-state responses, has a long history .
Mismatch negativity
The auditory mismatch response is a component of the MEG/EEG response elicited by any change (“deviant”) in auditory stimulation (“standard”), usually peaking at 80 to 200 milliseconds from change onset . The mismatch response is elicited, for example, when a sound changes in frequency, duration, or intensity. The mismatch response is elicited in the absence of attention (ie, when no task performance is required), although clear modulation by attention of the mismatch responses has been described . MEG/EEG source analysis , and depth recordings in humans and animals , suggest that the mismatch response is generated in the posterior superior temporal gyrus (STG), in or near Heschl’s gyrus. Prior work has suggested that the mismatch response is a composite of several different neural generators, including parietal and frontal generators, in addition to STG sources. Others suggest that the STG source of the mismatch response results from the anterior and posterior components of the N1 response, known as N1a and N1p, respectively . The N1p may be generated in the associative auditory cortex and the planum temporale (earlier latency than the anterior component) and the N1a may have a genesis just anterior and lateral to the primary auditory cortex ( Fig. 1 ). The mismatch response may originate in or near the N1a generator or slightly anterior to it .
Most , but not all , studies have reported a reduced mismatch response in neural diseases that have a reduction in inhibition, such as schizophrenia. Electrophysiologic investigations suggest that the reduced mismatch response is localized in the posterior STG , the site of reduced volume measurements in the STG as measured by MR imaging. The mismatch response reliability is excellent , which makes it a good tool for clinical use.
For use in the imaging of normal and impaired cognition, the mismatch response may be used to determine the integrity of particular neurotransmitter systems. For example, some studies indicate that the excitatory glutamate receptors interacting with the inhibitor gamma-aminobutyric acid (GABA) system are closely related to the abnormalities of the mismatch response in many disorders of cognition, and typified by schizophrenia . The monkey equivalent of the human mismatch response was abolished by microinjections of competitive and noncompetitive glutamate N-methyl d-aspartate (NMDA) receptor antagonists, without noticeable effects on the temporally preceding activity in lower laminae or the deviant alone stimuli . A similar inherent modulation was observed on surface potentials in schizophrenia . Further, Javitt has shown that exogenously administered NMDA receptor antagonists also result in a reduction of the mismatch response similar to that observed in schizophrenia. These findings are supported by animal models that demonstrate recurrent inhibition of NMDA-receptor neurons by way of GABAergic interneurons . These results suggest that noninvasive imaging of the mismatch negativity may have a direct impact on the clinical care of patients, such as in schizophrenia, especially when combined with other measurements and imaging techniques.
Spectral analysis of cognitive processes using visual stimuli
Bertrand and colleagues have investigated visual cognition using various paradigms and showed that during a visual object recognition, a burst of neural activity near 40 Hz (known as the gamma-band frequency) correlates strikingly with many cognitive acts. The gamma-band activity typically occurs within two time windows after presentation of a visual stimulus: one phase-locked (evoked) to the stimulus at about 180 milliseconds and another, which is not phase-locked to the stimulus (induced), which peaks at approximately 400 milliseconds after stimulus presentation .
The timing of neural events is crucial for normal brain function, and is probably most important for the coordination of cognitive acts, especially for object recognition. Disruption of the precise timing of cortical events may explain the diverse cognitive deficits in dyslexia, depression, and schizophrenia . Neural activity in the gamma frequency band (30 – 80 Hz or broader, centered on 40 Hz) has been hypothesized to reflect the synchronization of neural assemblies involved in the “binding” of various features of an object within a single sensory modality and across modalities, and also across time . At the cellular level, Traub and colleagues have presented evidence that interneurons with GABA A -mediated synaptic transmission interacting with glutamate-mediated cells provide the substrate for gamma oscillations in the cortex. A rich literature suggests that gamma-band activity may bind information across distant sites in the brain, known as the temporal binding hypothesis . Neural modeling, using sophisticated, biologically based simulations based on cellular physiology, suggest a complex interplay in the excitatory and inhibitory cells in generating intrinsic rhythms in the brain, and that different frequency bands have complementary roles in brain function , which is supported by recent cellular research .
Auditory steady-state response
A robust early neural response is the auditory steady-state response (ASSR). It has a maximal peak when the stimulation frequency, typically presented as brief auditory clicks, is presented at 40 Hz. Several studies using the ASSR in schizophrenia show a deficit in the 40-Hz response ( Fig. 2 ) in the ability to follow the stimulus, in frequency and phase . In a separate study, the ASSR was increased in Alzheimer’s disease patients, compared with normal controls, which was suggested to represent decreased inhibition and adaptation in auditory processing .
Connectivity
Although early sensory processes may be used to measure processes that are involved in disorders of cognition, cognitive functions require precise coordination of neural activity across long distances in the brain. These connections are typically made through large white matter tracts in the brain, which ensure precise timing across distant brain areas. Imaging connectivity in the brain involves structural and functional components, both of which are accessible through functional imaging. The nonstructural connectivity is often further classified as functional connectivity and effective connectivity. Functional connectivity quantifies the correlation of activity between two areas, and effective connectivity measures the influence of one area on another. The covariance approach is a type of effective connectivity of a large-scale interconnected network, in contrast to traditional subtraction methods (stimulus-type contrasts) that assume that there is a change in activation in discrete brain areas .
Structural connectivity
Diffusion tensor imaging
Structural connectivity measures, such as DT imaging, have recently demonstrated the capability to detect subtle white matter microstructural variations across the brain and among individuals, and to find alterations in a number of brain disorders. Microscopic white matter alterations have been observed with DT imaging in a number of conditions, including Alzheimer’s disease, HIV infection, premature birth, chronic alcoholism, autism, multiple sclerosis, schizophrenia, and numerous other conditions . Fractional anisotropy (FA) reflects diffusion anisotropy, presumably from microstructural obstacles that cause water molecules to diffuse in a particular direction. The obstacles that the water may encounter may be caused by the amount and integrity of myelin sheaths around axons, the diameter of the neurons, and the degree of facilitated diffusion that may reflect active transport within neurons.
Diffusion tensor imaging combined with other neuroimaging technologies
To understand the relationship of structure-function, diffusion measures such as FA and function (PET or fMR imaging) may be correlated within subjects or across subjects. The function might be the age of the subject, the timing of a behavioral response, or the latency of an evoked potential. For example, the normal aging prefrontal white matter is selectively susceptible to FA decline, consistent with prefrontal cognitive impairment in normal aging . Antisaccade latency in schizophrenia is strongly correlated with FA in established white matter pathways in the antisaccade processing network.
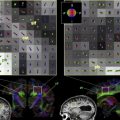
Another study found a relationship between the timing of behavior, in this case the choice reaction time (CRT), and the physical properties of white matter . Using DT imaging, the FA was found to be correlated regionally with the CRT on a visual task. Specifically, the timing of CRT across a group of young, healthy subjects was highly correlated with the FA in visual projection and association pathways supporting visuospatial attention ( Fig. 3 ). The investigators suggest that the localization of the CRT-FA correlations to predominately visual and parietal fiber tracts, but not to motor pathways or the corpus callosum, indicates that individual differences in visual CRT performance are associated with variations in the white matter underlying the visuospatial attention network, as opposed to pathways supporting motor movement or interhemispheric transmission.
Clinically, it has been shown that evoked potentials and evoked magnetic fields may also be correlated with measures from DT imaging in disorders that affect cognition. Evoked potentials and neuromagnetic fields are an effective clinical diagnostic tool in a wide number of neurologic and psychiatric disorders . Despite the clinical usefulness of evoked fields and potentials, the exact underlying mechanisms causing evoked potential abnormalities, such as prolonged latency or reduced magnitude, now are better understood with the use of structural and functional neuroimaging. Recent reports have demonstrated correlations between neuromagnetic and neuroelectric evoked response abnormalities and atrophy of the supporting white matter in a wide range of disorders (eg, multiple sclerosis , schizophrenia , and cognitive impairment in normal aging) . For example, white matter lesion load in multiple sclerosis correlates with prolonged latencies . The concordance between evoked response abnormalities and white matter pathology has promoted a model for neurologic cognitive impairment, based on alterations in nerve conduction velocity. One controversial model maintains that white matter degeneration (eg, demyelination or axon loss) leads to altered nerve conduction velocity, which disrupts the proper temporal synchronization of nerve impulses that are required for normal cognitive function .
Klingberg and colleagues found certain function-structure relationships in the human brain by investigating patients who had reading dyslexia. They reported that the FA values in the bilateral temporal junction were decreased in subjects with poor reading ability, compared with age-matched control subjects. Specifically, the FA was correlated with the reading ability score. This finding suggests that myelination is decreased in or near the classic Wernicke’s area in patients who have reading disorders.
Functional connectivity
Resting state connectivity
A particular case of functional connectivity is the so-called “default mode” or resting state, first characterized using PET and extended with fMR imaging studies. It quantified the spatial correlation of brain activity in the absence of a cognitive task, typically performed by having the subjects fixate on a visual cue, such as a cross-hair, without any other cognitive task . The resting state map is typically computed by calculating the resting state connectivity, using a seed voxel to calculate voxels that are correlated with the seed voxel ( Fig. 4 ). This baseline activity in the resting state has spatial correlations that involve the same prefrontal medial temporal lobe and parietal lobe systems involved in some memory tasks. Although speculative, it may be that the memory system, especially the declarative memory system, might be activated in the so-called “resting state” .
Related posts:
 Imaging of the Mind: Yesterday’s Triumphs and Tomorrow’s Challenges
Understanding Autism and Related Disorders: What has Imaging Taught Us?
Neuroimaging in Posttraumatic Stress Disorder and Other Stress-Related Disorders
Mood Disorders
The Role of Imaging in United States Courtrooms
Imaging of the Mind: Yesterday’s Triumphs and Tomorrow’s Challenges
Understanding Autism and Related Disorders: What has Imaging Taught Us?
Neuroimaging in Posttraumatic Stress Disorder and Other Stress-Related Disorders
Mood Disorders
The Role of Imaging in United States Courtrooms
 Visualizing White Matter Pathways in the Living Human Brain: Diffusion Tensor Imaging and Beyond
Stay updated, free articles. Join our Telegram channel

Full access? Get Clinical Tree


