Measurement Analysis
June Yamrozik
Many manufacturers have software packages available to analyze the mechanics of the heart. This chapter will show the cardiac magnetic resonance imaging (MRI) technologist how to measure the right ventricle (RV) and left ventricle (LV). The terms end diastole volume (EDV), end systole volume (ESV), stroke volume (SV), ejection fraction (EF) will be defined and easily understood. Phase contrast magnetic resonance (PCMR) will be illustrated and provide the technologist with an understanding of how to calculate this data and the type of flow that is being analyzed. A brief description of wall motion and delayed hyperenhancement imaging will be discussed.
MEASUREMENT ANALYSIS OF THE RIGHT AND LEFT VENTRICLE
Cardiac MRI is one modality that gives accurate measurements of cardiac function. People with cardiomyopathy, congestive heart failure, myocardial infarction, pulmonary hypertension, and arrhythmogenic right ventricular dysphasia (ARVD) will have a cardiac function study done at our institution. Also, cardiac function MRI is sometimes ordered as a comparison to other studies because of its precise results, especially in circumstances for pacemaker placement where an accurate EF is necessary.
SHORT AXIS PLANE POSITIONING OF THE RIGHT AND LEFT VENTRICLE
Measuring Short Axis Images of Left Ventricle in Diastole and Systole
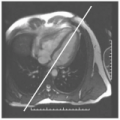
A stack of SA images from the base of heart to the apex with an 8-mm slice thickness and zero gap is performed at our institution. This is positioned from a four-chamber image and is centered parallel to the mitral annulus and perpendicular to the septum as shown in Fig. 6-1. The sequence that is utilized is steady state free precession (SSFP).
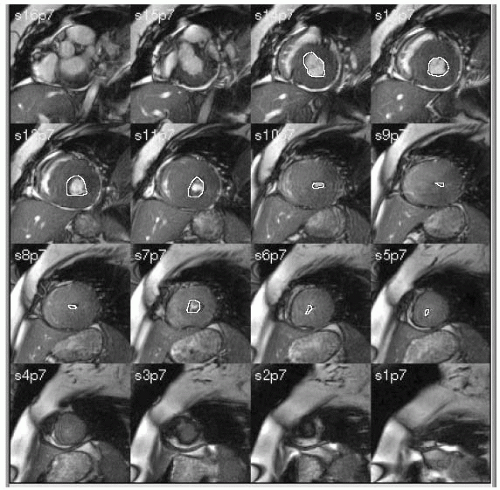
After the images are processed, they are analyzed to access heart function. The images are measured from the base of heart to the apex. The starting point is at the mitral valve level of the LV. It is important to exclude the left atrium. The epicardial and endocardial borders of the heart are measured in diastole. Diastole is when the heart is at maximum dilation. It is normally the first phase of the SSFP cine sequence (see Fig. 6-2). The heart also needs to be measured in systole. Systole is when the volume of the heart cavity is squeezed to peak contraction. To locate systole, start with the first image of the heart which is normally diastole and sort
through the images one by one, to watch the heart contract. When the heart is at its maximum contraction the following image will dilate. Measure the endocardial borders of the heart in systole from base to apex (see Fig. 6-3).
through the images one by one, to watch the heart contract. When the heart is at its maximum contraction the following image will dilate. Measure the endocardial borders of the heart in systole from base to apex (see Fig. 6-3).
 FIGURE 6-1 Positioning for short axis (SA) function imaging. Center perpendicular to the septum and parallel to the mitral annulus from a four-chamber image. |
Measuring Right Ventricle from Short Axis Image in Diastole and Systole
Diastole and systole will be the same phases of the heart that were measured on the LV. The RV is difficult to
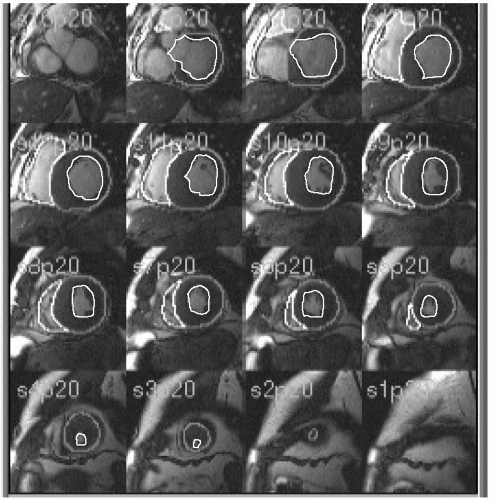
locate on the base image. The right ventricular outflow tract (RVOT) is what to look for on the basilar image. The beginning of the RV will be seen coming off the pulmonary artery (PA) region. Measure the endocardial borders of the RV in diastole. Make sure that the right atrium is excluded (see Fig. 6-4). Measure the endocardial borders of the RV in systole (see Fig. 6-5).
locate on the base image. The right ventricular outflow tract (RVOT) is what to look for on the basilar image. The beginning of the RV will be seen coming off the pulmonary artery (PA) region. Measure the endocardial borders of the RV in diastole. Make sure that the right atrium is excluded (see Fig. 6-4). Measure the endocardial borders of the RV in systole (see Fig. 6-5).
TRANSVERSE PLANE POSITIONING OF THE RIGHT AND LEFT VENTRICLE
Measuring Right Ventricle and Left Ventricle in Transverse Plane
Transverse (axial) SSFP images are obtained from the PA to the apex of the heart with an 8-mm slice thickness
and zero gap. The starting image is demonstrated in Fig. 6-6. Once again diastole and systolic measurements are performed. Look for the beginning of the RV coming from the PA. Start measuring the LV at the left ventricular outflow tract (LVOT) region. Measure the epicardial and endocardial borders of the LV in diastole. Measure the endocardial borders of the RV in diastole as shown in Fig. 6-7. In systole, measure the endocardial borders of the RV and LV (see Fig. 6-8). The epicardial borders of the RV are not measured routinely at our institution because the myocardium around the RV


and zero gap. The starting image is demonstrated in Fig. 6-6. Once again diastole and systolic measurements are performed. Look for the beginning of the RV coming from the PA. Start measuring the LV at the left ventricular outflow tract (LVOT) region. Measure the epicardial and endocardial borders of the LV in diastole. Measure the endocardial borders of the RV in diastole as shown in Fig. 6-7. In systole, measure the endocardial borders of the RV and LV (see Fig. 6-8). The epicardial borders of the RV are not measured routinely at our institution because the myocardium around the RV
Stay updated, free articles. Join our Telegram channel

Full access? Get Clinical Tree


