Measurement Techniques


Rheumatoid Arthritis Measurements


image


CV Junction Trauma Measurements


image


image
(Left) Sagittal graphic of craniocervical junction shows Wackenheim clival line (red) extending tangent to the normal odontoid position. The line is drawn from the dorsum sellae to the tip of clivus.

image
(Right) Sagittal graphic of the craniocervical junction shows Chamberlain line (red), drawn from the posterior hard palate to opisthion, and McGregor line (yellow), drawn from the posterior hard palate to the lowest point of the occipital bone.

image
(Left) Sagittal graphic of craniocervical junction shows lines comprising the Powers ratio (BC/OA), where normal is < 1. BC = basion to C1 posterior arch, OA = opisthion and midpoint of the posterior aspect of anterior C1 arch.


image
(Right) Sagittal graphic shows lines comprising the Lee method. BC2SL and C2O should just intersect tangentially with the posterosuperior aspect of the dens and the highest point on the atlas spinolaminar line respectively in normal state. Deviation suggests AOD.

image
(Left) Sagittal graphic shows basion dental interval (BDI) in red, which should be < 12-12.5 mm in children on plain films and < 8.5 mm in adults on CT. Black lines define basion axial interval (BAI) image 
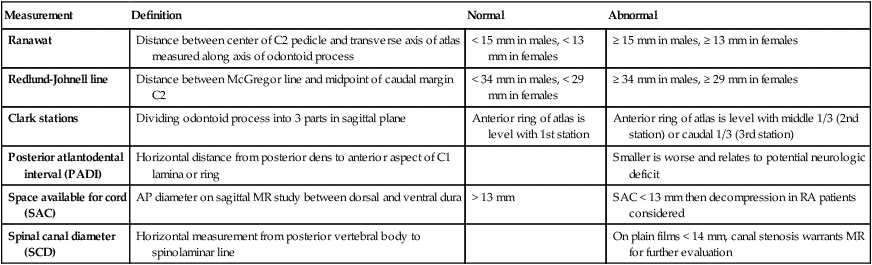
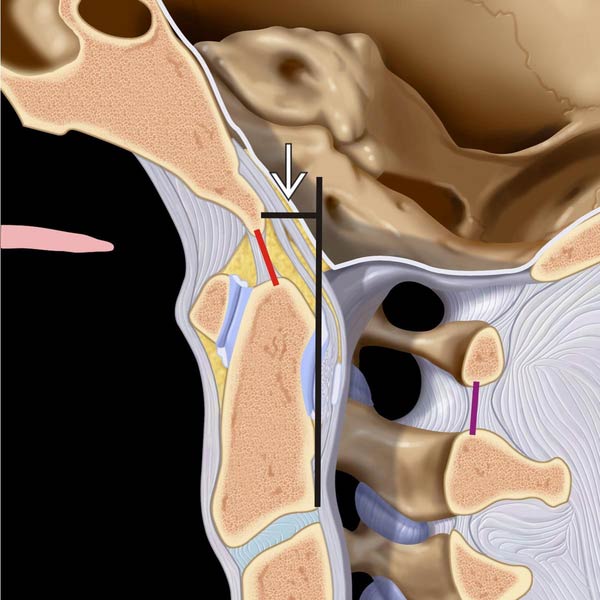
extending from basion to line extended along posterior margin of C2, which should be < 12 mm on plain films. C1-C2 spinolaminar line is shown in purple (< 8 mm in adults).


image
(Right) Sagittal graphic shows atlantodental interval (green) and spinal canal diameter (red).


image
(Left) Sagittal CT reconstruction in AOD shows widening image 
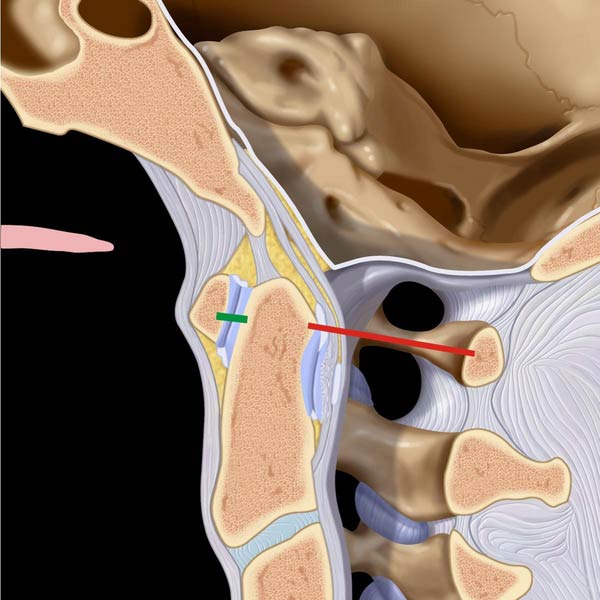
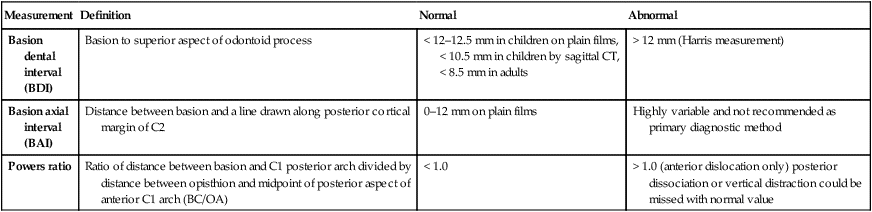
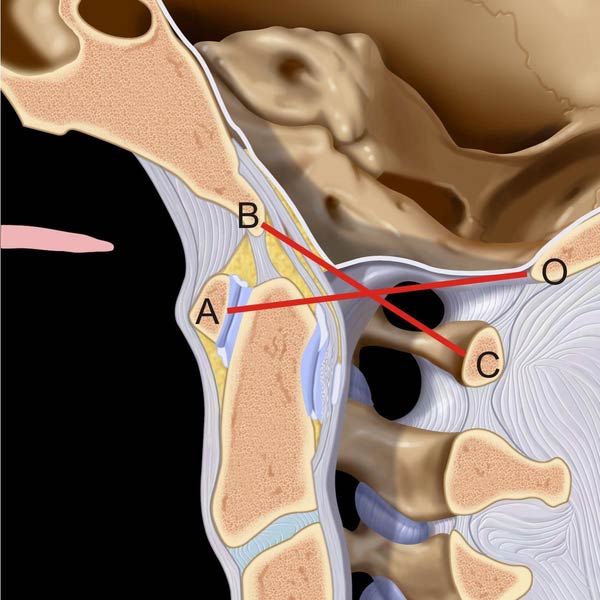
of the BDI > 8.5 mm in this adult. Note the normal Wackenheim line relationship.

image
(Right) Sagittal CT reconstruction in AOD shows widening of the C0-C1 junction image 
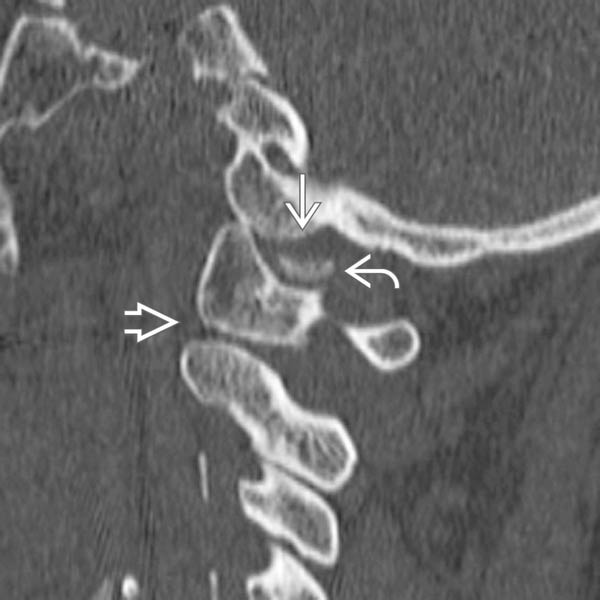
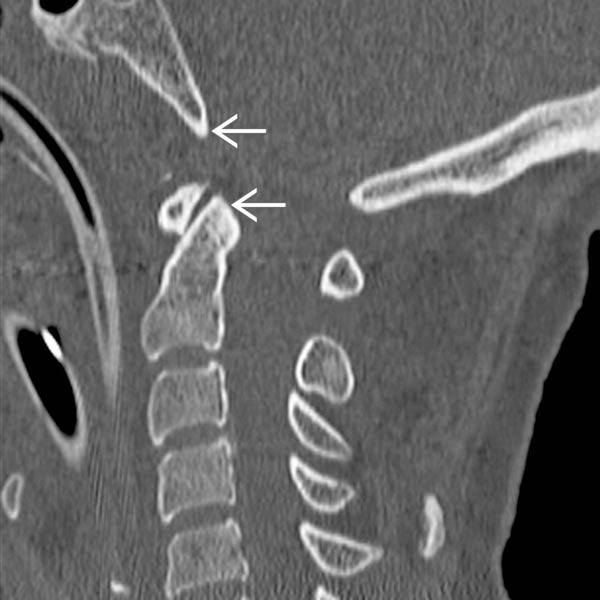
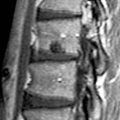
with anterior subluxation of the condyle. Condylar fragment is present in the joint space image
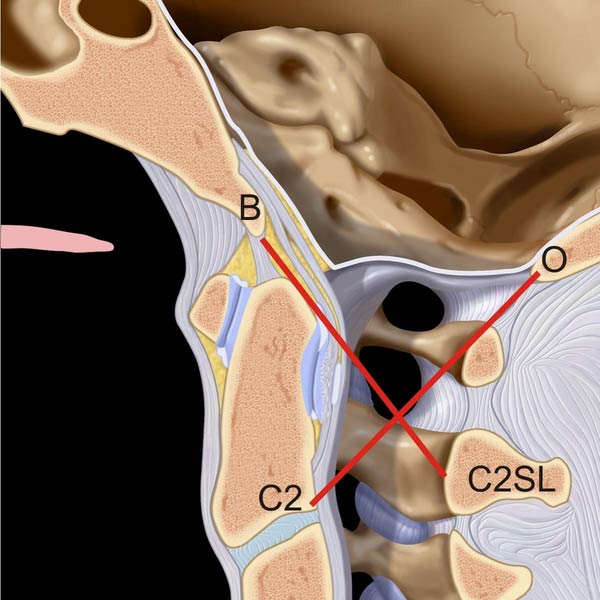
. Note the normal C1-C2 relationship image.

image
(Left) Sagittal STIR MR in AOD shows widening of BDI with ↑ T2 signal image 
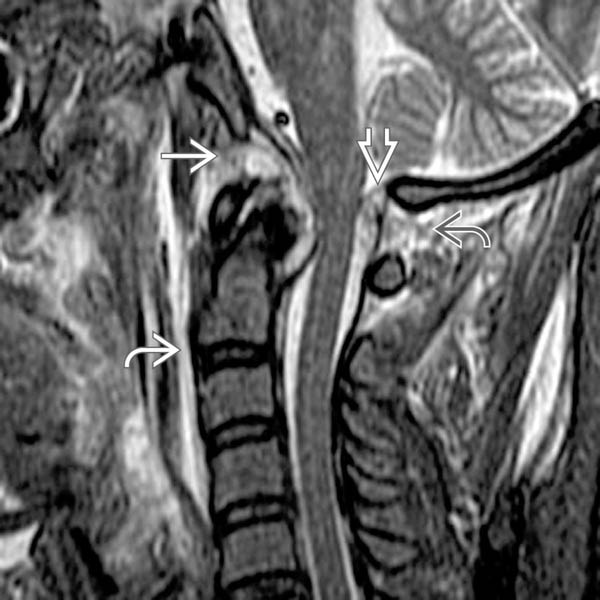
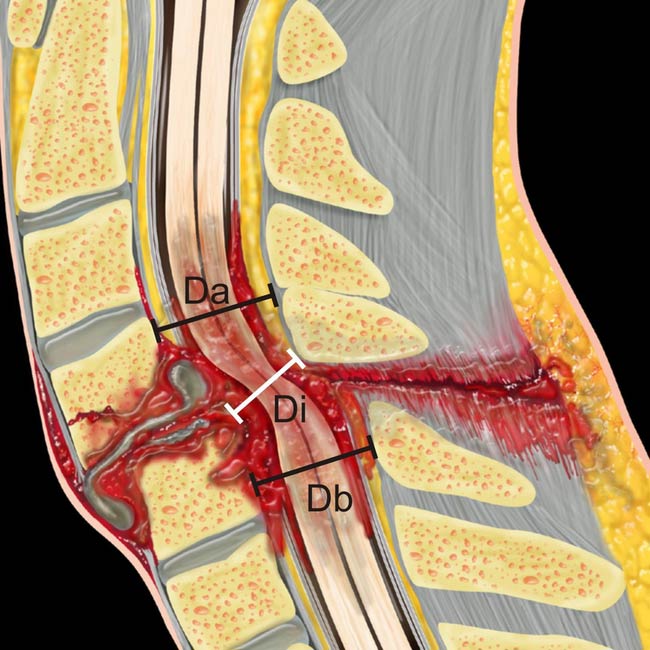
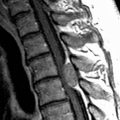
from alar and apical ligament rupture. Note also prevertebral edema image and posterior interspinous ligament disruption image. Posterior epidural hemorrhage image contributes to subarachnoid space narrowing.


image
(Right) Coronal CT reconstruction in AOD shows marked widening of the C0-C1 joint space image
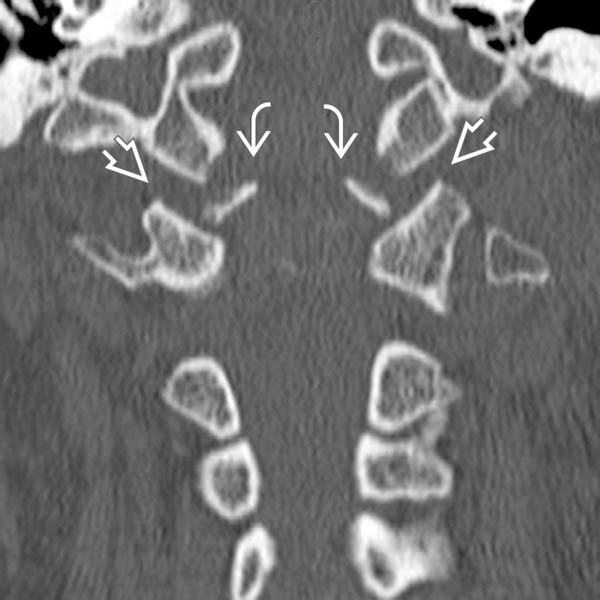
, which should be approximately 2 mm. Bilateral symmetric avulsion fractures off of the condyles are present image.

image
(Left) Sagittal graphic shows the maximum canal compromise measurement. Di is the anteroposterior canal diameter at the level of maximum injury, Da is the AP canal diameter at the nearest normal level above the level of injury. Db is AP canal diameter at nearest normal level below level of injury.

Only gold members can continue reading. Log In or Register to continue

Stay updated, free articles. Join our Telegram channel

Oct 5, 2016 | Posted by in NEUROLOGICAL IMAGING | Comments Off on Measurement Techniques

Full access? Get Clinical Tree

Get Clinical Tree app for offline access