- •
Myocardial strain is potentially a better measure of regional contractile function than motion of the endocardial border or tissue velocity, because strain directly quantifies the change in shape of regions of myocardium.
- •
The most common elements of the strain tensor used to quantify regional left ventricular function are circumferential shortening (E cc ), radial thickening (E rr ), and longitudinal shortening (E ll ).
- •
CMR methods to assess strain or strain rate include myocardial tagging, harmonic phase analysis (HARP), displacement encoding with stimulated echoes (DENSE), strain-encoded imaging (SENC), and velocity-encoded phase contrast. These methods can be classified as tissue tracking techniques.
- •
Myocardial tagging, which was developed nearly 20 years ago, is the most widely used and well-validated CMR tissue tracking technique.
- •
HARP is an automated image analysis method that greatly reduces the time required to quantify displacement and strain from tagged images.
- •
DENSE is a cardiac magnetic resonance (CMR) tissue tracking method in which displacement, rather than velocity, is encoded into the signal phase. This is achieved by acquiring the displacement-encoded stimulated echo. In practice DENSE and refined HARP methods employ similar physics and analysis algorithms.
- •
SENC directly images strain normal to the imaging plane.
- •
CMR tissue tracking methods that quantify myocardial strain have potential application to all heart diseases that alter regional contractile function. The most common example is ischemic heart disease.
- •
CMR tissue tracking measurements of the temporal evolution of regional strain also may be useful in the assessment of mechanical dyssynchrony.
This chapter discusses the quantification of cardiac function, specifically the “mechanical,” or contractile, function. Nearly all heart diseases lead to contractile dysfunction of the left ventricle (LV). Depending on the specific disease, contractile function may be impaired throughout the LV, or the degree of dysfunction may vary significantly by region. The clinical finding of contractile dysfunction is typically made by qualitative visual assessment of cine images acquired using echocardiography, radionuclide scintigraphy, or CMR. Although qualitative assessment of cine images is the clinical standard, these methods are subjective and observer dependent. In addition to conventional cine imaging, echocardiography and CMR can perform quantitative tissue tracking to quantify regional contractile function. Reliable and easy-to-use quantitative methods could potentially reduce subjectivity and variability in the assessment of regional function. Quantitative echocardiographic techniques include tissue Doppler imaging and speckle tracking. Quantitative CMR techniques include myocardial tagging, HARP, DENSE, SENC, and velocity-encoded phase contrast.
Quantitative assessment of function requires accurate techniques to measure the regional function. The capacity to “measure” the regional function must be well understood. Measuring the function of some region in the heart muscle can be described by more than one quantity and in relation to its muscle’s contraction and relaxation. Typical motion measurements are selected to be universal, so researchers, physicians, and technicians from different backgrounds may understand these measurements without confusion or further explanation. Obviously, because the function of the heart muscle (myocardium) is mechanical, the terms used are based on mechanics and physics.
This chapter specifies the measurements used to describe the regional function. Specifically, it discusses the quantities’ velocity, displacement, and strain. A group of secondary measurements are discussed as well. The chapter then describes different CMR methods that can help one obtain some of these mechanical measurements. The focus is mainly on MR tagging, DENSE, and SENC. For each method, the chapter describes the basic concept, the measurements that can be obtained, the expected measurements in healthy population and variations in selected populations of cardiac diseases, and some of the limitations and considerations.
WHICH QUANTITIES DESCRIBE REGIONAL FUNCTION?
There are many quantities that can be used to measure regional function, but the focus here is on three quantities: velocity, displacement, and strain. Secondary measurements that can be obtained from these basic ones, such as strain rate or rotation, are also discussed.
VELOCITY: HOW FAST IS THE WALL MOVING?
Qualitative assessment of regional function is usually done by observing the speed at which the ventricular wall appears to move in cine, whether it is obtained using echocardiography, CT, or CMR. The quantity to describe the speed of the wall is the velocity, which is measured as a distance covered by a moving object per second. The velocity has a direction, or mathematically, it is not a scalar but a vector. Given that, it is useful to measure the motion in a specific direction to become meaningful. In the case of LV, it is plausible to measure the velocity of the wall as measured in the radial direction toward the center of the ventricle. This “radial” motion describes the expected inward motion of the wall during systole to reduce the cavity inside the ventricles and eject the blood through the aortic and pulmonary valves.
The instantaneous velocity of a piece of tissue is measured by dividing the displacement that this piece of tissue moves in a very short period of time over that period of time. In healthy people, the instantaneous velocity at any phase of the cardiac cycle is not uniform over the regions of the heart. The peak instantaneous velocities occur in mid-systole and at early and late diastole.
DISPLACEMENT: HOW FAR DOES THE WALL MOVE?
The other measure of motion is displacement, which is the total distance a piece of tissue moves over a period of time. The motion of the wall during systole is measured by the displacement that occurs from the end-diastole to end-systole. Displacement and speed are related and can be deduced from each other. A series of velocity measurements acquired at different instants of time in the cardiac cycle can be added to measure the overall displacement. Conversely, velocity can be measured from a sequence of displacement measurements at different instants of time. The velocity is the mathematical derivative of displacement.
The displacement at any instant in the cardiac cycle does not reflect the rate of deformation of the tissue. However, obtaining a sequence of displacement measurements at different instants during the cardiac cycle captures the dynamics of the heart.
STRAIN: A MEASURE OF CONTRACTILITY?
Although velocity and displacement describe the motion of tissue, they do not describe the deformations that occur to the tissue. A piece of noncontracting (dysfunctional) tissue can be moving very fast because of pulling (tethering) by another active piece of tissue. A healthy piece of myocardium is expected to contract and relax, causing deformations in its shape. A third quantity can measure these deformations and changes to the shape of the tissue. Strain, defined as the change in some length of a piece of tissue per unit length, can be that measure. The strain can take negative and positive values. The increase in length of a piece of tissue is measured in positive strain values, whereas a decrease in length (shortening) because of contraction (for example) is measured in negative strain values.
By definition, strain (E) is a tensor quantity, as it describes the change in shape of a one-, two-, or three-dimensional (1D, 2D, or 3D) solid element. The measured deformation strain differs according to which length, or direction, is considered. For analyzing cardiac function, the principal strains may be measured; however, it is more common to report the radial, circumferential, and longitudinal strains, because they are aligned with the natural coordinate system of the heart and are easy to interpret. Typical strain values for a normal heart are approximately -0.25 to -0.50 for radial thickening (E RR ), -0.13 to -0.25 for circumferential shortening (E CC ), and -0.13 to -0.20 for longitudinal shortening (E LL ). These values indicate that a small 3D element of myocardium, during systole, will stretch approximately 25% to 50% in the radial direction, shorten approximately 13% to 25% in the circumferential direction, and shorten approximately 13% to 20% in the longitudinal direction relative to its initial shape at the reference time of end-diastole. Other strain quantities are the principal strains that describe the maximum deformations (shortening and lengthening) of a piece of tissue. It is also possible to estimate the shear strains that are generated during myocardial contraction; however, the clinical use of this information is not well established. Figure 4-1 illustrates the directions of commonly used strains.

Strain in general can be measured from displacement. On the other hand, strain rate, which is the rate of change in strain, can be measured from the strain by simple derivative of time, or regional velocity using spatial derivatives. Overall, the rate of change of any quantity with time is measured, mathematically, as the time derivative. Techniques that measure the displacement (e.g., MR tagging and DENSE, which are described later) compute the strain by measuring spatial difference in displacement. However, strain can be directly imaged using SENC, without obtaining the intermediate measurements of displacement or velocity.
OTHER MEASUREMENTS
Other measures of motion can also be used to describe regional function, but in general they can be derived from the basic displacement or velocity measurements. For example, there is interest in measuring the rotation of the LV around the long axis. This is measured from the displacement by measuring the average displacement along the circumferential direction. The angular velocity is similarly measured from the velocity measurements. Another measurement is the twisting (torsion) of the LV, which is the difference in rotation between the base and apex of the LV.
The deformation of the LV shows a twist around the long axis, seen as the rotation of the base in an opposite direction relative to the apex. This twist accompanies shortening in the longitudinal direction (from base to apex); therefore, the LV looks as if squeezed to eject the blood out of its cavity.
Obviously, the twist occurs as a result of the rotation of any point of the myocardium around the long axis. In a way, this motion (or displacement, as described earlier) is an angular motion, and could be considered a regional motion. However, it is hard to consider it to be a form of regional function, because the rotation (like displacement) could be caused by the contraction of other regions tethered to the rotating region.
MAGNETIC RESONANCE TAGGING: NONINVASIVE MARKERS
The first techniques to help detect and measure the motion inside the myocardium was by inserting small beads that were opaque to the imaging modality so it could be detected in the images and tracked to obtain the motion. Because these methods were invasive, it was solely used for research, and clinical applications were unthinkable. Moreover these physical markers interfered with the measured motion, because their existence inside the tissue would affect the regional motion. Luckily CMR provided a noninvasive alternative. CMR was shown to be capable of creating virtual markers inside the tissue that have exactly the same benefits for tracking the motion as the physical beads, but without the disadvantages, such as the need for surgical intervention or compromising the function.
MR tagging is the technique for doing so. Tagging has been proposed by Zerhouni et al. as a method for visualizing the motion of the myocardium, and significant improvements have been achieved by Axel. Practically, MR tagging currently is the most used CMR technique for measuring regional function of the heart. As a side note, consider one of the pitfalls of CMR, the proliferation of techniques with awkward naming. MR tagging is one of these, in which the name does not reveal the exact role of the technique. Perhaps a name such as virtual markers would have been a better description of what MR tagging actually does.
The Technique
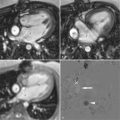
The MR tags are generated by a special modification of the CMR scanner’s pulse sequence that makes the magnetization of the tissue nonuniform so that some regions of the myocardium appear darker than others when images are acquired. These dark regions reveal that the magnetization of the corresponding tissue of the myocardium is suppressed; it stays suppressed for about 1 second before resuming its normal magnetization. Therefore, these MR tags do not last long, and the dark regions return to normal intensity across all the tissue. Hence, the MR tags gradually fade and completely disappear in about a second. During this period of time, if images are acquired in a sequence during the cardiac cycle and played as a cine movie, the MR tagging pattern appears to deform with the motion of the myocardium-similar to the motion of physical beads implanted inside the myocardium. This means that the MR tags reveal the motion inside the myocardium and, with proper design of the tagging pattern and appropriate tools, can be used to measure the motion. The exact shape of the tagged regions is called the tagging pattern, such as the line tags in Figure 4-2 . Axel introduced the spatial modulation of magnetization (SPAMM) pulse sequence, which is the most efficient pulse sequence to create regular tag patterns. Moreover, SPAMM creates multiple regular tags that appear as lines (see Fig. 4-2 ) or rectangular grids. Because of their regular shape, it is possible to obtain the motion of the whole heart in view. Because of its simple and effective ability to produce tagged MR images, the SPAMM sequence and its variations are available on most commercial CMR scanners.

Common Tag Patterns
The use of the SPAMM pulse sequence enables the generation of a rectilinear tag patterns using a very efficient pulse sequence. The use of 1D SPAMM generates parallel saturated surfaces orthogonal to the imaging plane. This results in parallel dark lines appearing on the acquired images. The use of two consecutive 1D SPAMM sequences generates a grid of tags composed of two sets of intersecting parallel lines. These two sets are typically designed to be orthogonal to each other. Because the motion of the heart on the plane can be described by two orthogonal sets of linear tags, a grid tag is a more efficient way to depict the in-plane motion (see Fig. 4-2 ). For automatic motion analysis, at least two orthogonal tag lines are needed for measuring the displacement or strain. This is double the acquisition time needed to acquire grid tag patterns. However, the line tags have better quality, described by the contrast-to-noise ratio (CNR), which is the ratio of the contrast between the bright and dark tag lines to the amount of noise in the image. Higher CNR indicates better image quality than images with lower CNR.
Analyzing Magnetic Resonance Tagged Images Using Harmonic Phase Analysis
Despite its wide availability on all CMR scanners, MR tagging is not used widely in clinical applications. This is mainly attributed to the lack of suitable methods to obtain measurements of regional function from the images. Most of the developed techniques were very time consuming, which made it very hard to apply MR tagging to studies with large number of subjects. This by itself was a great obstacle against exploring the usefulness of tagging in assessing regional function in cardiac disease.
This setback for MR tagging has been steadily changing because of two factors. First, there is a renewed interest in measuring the mechanical activities of the heart and its applications. This is more obvious in the case of determining dyssynchrony for CRT. The second and more important reason is the development of new methods that reduce the image analysis time required to measure the regional motion. The most widely used technique now is the HARP technique, which enables measuring of regional function from the tagged images produced from any of the available commercial scanners.
Examples
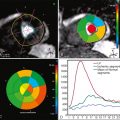
Figure 4-3 shows a screen shot of analyzed tagged MR images with HARP in a normal healthy heart. The technique is capable of measuring the circumferential strain. The curves have negative values, reflecting the fractional shortening in the circumferential strain. The lowest points on the curves are the maximum shortening, which is expected to occur around end-systole. Not all the regions of the myocardium reach maximum shortening at the same time-the lateral wall is slightly delayed from the septum. In the same example, a collection of points making a circular mesh can be tracked during the cardiac cycle. The overall rotation of the mesh points around the center prescribes the rotation of that slice of the heart around the long axis. Figure 4-4 shows three meshes created in the basal, mid-ventricular, and apical slices of the LV.


Related posts:


Stay updated, free articles. Join our Telegram channel

Full access? Get Clinical Tree


