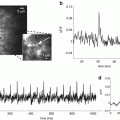
Fig. 9.1
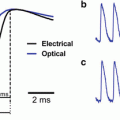
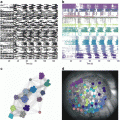
Voltage-sensitive dye and optical recording system. (a) The chemical structure (upper) and wavelength dependence (lower) of a merocyanine-rhodanine dye NK2761. Fractional changes in transmitted light intensity (ΔI/I: the change in light intensity divided by DC-background intensity) related to the action potential are plotted against wavelengths of incident light. (b) Schematic drawing of a 1,020-element optical recording system
Di-2-ANEPEQ had the largest S/N of the fluorescence dyes tested in the embryonic chick brain, while its photobleaching was faster and the recovery of neural responses after staining was slower than those of the other fluorescence dyes (Mullah et al. 2013). Although RH414 and RH795 were previously shown to be useful in other preparations (Grinvald et al. 1984, 1988; Obaid et al. 2004), these dyes exhibited very small or undetectable signals in the embryonic brain. The fractional change in fluorescence dyes was larger than that of absorption dyes, whereas its S/N was lower because of more noise. Even with di-2-ANEPEQ, which performed the best among the fluorescence dyes screened, its S/N was inferior (approximately 20 %) to that of NK2761 (Mullah et al. 2013). Nevertheless, fluorescence dyes may be a better option when optical recording is performed at a later developmental stage or when postnatal/posthatched animals, in which the translucency of tissue is low, are used.
Each voltage-sensitive dye has its own action spectrum, which is species- and tissue-specific. In the embryonic brain of chickens and rats, the action spectra of the merocyanine-rhodanine dyes including NK2761 are such that the transmitted light intensity increases (decrease in absorption) in the range of 500–620 nm, and decreases (increase in absorption) in the range of 630–750 nm, with the cross-over occurring at around 630 nm (Momose-Sato et al. 1995b) (Fig. 9.1a). The largest change in transmitted light intensity occurs at around 700 nm. This wavelength-dependency is useful because it allows one to distinguish membrane potential-related optical signals from intrinsic optical changes or other mechanical artifacts: voltage-dependent optical responses are detected at 700 nm, but not at 630 nm, while intrinsic signals and mechanical artifacts are observed at both wavelengths (also see Sect. 2.4).
A voltage-sensitive dye is usually applied to tissue by bathing the preparation to be recorded in a solution of the dye. To stain neurons well, it is often useful to remove meningial tissue surrounding the brain. Within a short time the dye binds to the cell membrane, after which excess dye is washed away with physiological solution. As an alternative approach to selectively labeling a specific neural population, relatively hydrophobic fluorescence styryl dyes (di-8-ANEPPS and di-12-ANEPPQ) have been employed in the embryonic nervous system (Tsau et al. 1996; Wenner et al. 1996). These dyes were injected into a nerve or axon tract and transported retrogradely to the parent neuronal somata by lateral diffusion, which enabled the selective labeling of a specific subpopulation of neurons. Recently, Ca2+-indicators have been applied to embryonic and neonatal brains by electroporation (Bonnot et al. 2005; O’Donovan et al. 2008). This method has not yet been employed for voltage-sensitive dyes, but might be in the future.
When applying dyes to early embryonic preparations, certain physicochemical properties including the osmotic behavior of the dye should be considered, because the early embryonic cells are primitive and may be sensitive to small changes in the environment. To prevent toxic actions of the dye, a brief staining with low concentrations is preferable, but the staining conditions depend on several factors including the affinity of the preparation for the dye and tissue thickness. Usually, NK2761 is loaded for 5–20 min at a concentration of 0.1–0.4 mg/ml. Under these conditions, neither a pharmacological nor a phototoxic action of the dye is observed for evoked action potentials and postsynaptic potentials, while spontaneous activity is sometimes transiently suppressed by staining.
The fractional change in dye absorption (ΔA/A) and fluorescence (ΔF/F) is proportional to the magnitude of the changes in membrane potential in each cell and process, and to the membrane area of activated neural elements within the optically detected field, assuming that the amount of dye bound to the membrane is uniform (Orbach et al. 1985; Kamino et al. 1989a). In absorption measurements, ΔA/A is equal to −ΔI/(I before staining − I after staining ), where A and I are light absorbance of the dye and light intensity transmitted through the preparation, respectively, and ΔA and ΔI are their changes (Ross et al. 1977). In the majority of embryonic experiments, preparations have already been stained before being placed in the recording chamber. This is done to maximize diffusion of the dye into the tissue, but prevents the measuring of I before staining and I after staining from the same preparation. In embryonic preparations, variations in I before staining /I after staining between regions are relatively small (Momose-Sato and Sato 2006), and thus, the optical signal has usually been expressed as ΔI/I after staining , assuming this to be linearly related to ΔA/A. By measuring the size of the optical signals and examining their distribution, functional arrangements of the response cells can be assessed. This optical mapping method has been used to analyze the functional arrangement of the response area such as the cranial motor and sensory nuclei (see Sect. 3.2).
2.3 Optical Recording Systems
Several reviews concerning optical recording systems have been published (Salzberg 1983; Grinvald 1985; Cohen and Lesher 1986; Grinvald et al. 1988; Wu and Cohen 1993; Wu et al. 1998). Technical information is also available at http://www.redshirtimaging.com and described elsewhere in this issue. In optical recordings with voltage-sensitive dyes, high sensitivity and high temporal resolution together with an adequate spatial resolution are required to detect small optical signals (10−4–10−2 as a fractional change) occurring with a time course of milliseconds. When designing and constructing recording systems for monitoring embryonic neural activity, the following basic requirements should be considered. First, the temporal resolution should be high enough to detect the action potential, which has a similar time course as that in adults. Second, slow changes in membrane potential, such as embryonic postsynaptic potentials that last more than a second, should be detectable. Third, the S/N should be as large as possible, hopefully sufficient to permit recording without averaging because the embryonic postsynaptic potential fatigues very rapidly. Finally, it is important to ensure that the dynamic range matches the fractional changes of the signals to be recorded, and that the system does not saturate. In absorption measurements in vitro embryonic preparations, the signals arise from a baseline of high intensity transmitted light. In this situation, a photodiode array or CMOS camera is preferable because other detectors such as a CCD camera would saturate at such high light intensities and the signal would be lost. In the case of fluorescence signals at low light levels, a cooled CCD camera might perform better. Overall, the choice of detection systems needs to be tailored to the preparation and the type of signals.
In our own studies using absorbance signals from merocyanine-rhodanine dyes, home-made optical recording systems with a 12 × 12 (144-elements) or 34 × 34 (1,020-elements) photodiode array have been used (Hirota et al. 1995; Momose-Sato et al. 2001a). In other laboratories, commercially available equipment (NeuroPDA, RedShirtImaging, Fairfield, CT; MiCAM, Brain Vision Inc., Tsukuba, Japan; ARGUS-50/PDA, Hamamatsu Photonics, Hamamatsu, Japan; Deltaron-1700, Fujifilm, Tokyo, Japan: the former two systems are now available) has been applied to the developing nervous system. In general, the systems are composed of three main parts: an optics system, a detection system, and a recording system with a computer. Figure 9.1b shows a schematic representation of the 1,020-element optical recording system, which is set for absorption measurements. The optics system is based on a biological microscope mounted on a vibration isolation table. Bright field illumination is provided by a 300 W tungsten-halogen lamp driven by a stable direct current (DC) power supply. In other laboratories, a 100–150 W tungsten-halogen lamp has also been used as a light source. Incident light is collimated, passed through a heat filter, rendered quasi-monochromatic with an interference filter, and focused onto the preparation, which is placed on the stage of a microscope. An interference filter should be selected depending on the wavelength dependency of the dye (see Sect. 2.2). For the merocyanine-rhodanine dye NK2761, an interference filter with a transmission maximum at 700 ± 11–15 nm (half width) has been used. An objective and a photographic eyepiece form a magnified real image of the preparation on the photodiode array. The focus is usually set on the surface of the preparation, but the optical signals seem to include activity from every depth, as it has been shown that the interior region of the embryonic brain is well stained with the dye (Sato et al. 1995), and that neuronal responses in the dorsally located cranial nerve nucleus can be detected from the ventral surface (Momose-Sato et al. 1991b).
The transmitted light intensity at the image plane is detected with a photosensitive device such as an array of silicon photodiodes. The spatial resolution in purely optical terms depends on the magnification of the microscope and the size of one photodetector. In our 1,020-element photodiode array system, each of the 1.35 × 1.35 mm2 active elements of the array is separated by an insulating area 0.15 mm in width. Thus, each pixel of the array detects light from a region of 54 × 54 μm2 of the preparation when a magnification of 25× (objective 10× and eyepiece 2.5×) is used to cover the entire region of a medulla slice. Using a 12 × 12-element photodiode array, in which each element has a 1.40 × 1.40 mm2 active area, together with a water immersion 40× objective and a 6.7× photographic eyepiece, a spatial resolution of 5.2 × 5.2 μm2 has been achieved, with which action potentials in the embryonic chick cervical vagus nerve bundle have been detected in single sweeps (K. Kamino, unpublished observation).
In the 1,020-element recording system shown in Fig. 9.1b, the outputs from the 1,020 elements of the photodiode array are fed into individual current-to-voltage converters followed by individual pre-amplifiers. The amplified outputs are fed into 32 sets of 32-channel analog multiplexers and then sent to a discretely designed subranging type analog-to-digital converter system. An advantage of this circuit is that the optical signal is detected with a resolution of 18 bits without AC-coupling, so that the embryonic slow responses can be recorded without a distortion of signal waveform. On the other hand, a drift in the DC baseline associated with dye bleaching causes some problems with long-term recordings. As an alternative method, in the 144-element optical recording system and currently modified 1,020-element system, the AC component of each output from individual pre-amplifiers is further amplified via AC-coupled circuits with low-cut filters (time constant, 3 s) and then digitally recorded. The frame rate provided by these systems is 1 kHz or more, which is sufficient to resolve individual action potentials and postsynaptic potentials.
2.4 Components of the Optical Signal
In optical recording systems, each element of the photodiode array detects optical signals from many neurons and processes when the dye is loaded by bath-application. Because the spatial resolution is not fine enough, optical signals often contain several components, such as antidromic action potentials, orthodromic action potentials, and postsynaptic potentials. One useful way to identify the origin of an optical signal is to analyze the waveform of the signal. Figure 9.2A, B show schematic representations of possible components of the optical signal. In Fig. 9.2A, examples are shown for optical responses evoked by stimulation of the preganglionic fibers in the embryonic chick superior cervical ganglion. Figure 9.2A(a) presents a case in which synaptic functions have not been generated or are blocked pharmacologically. Figure 9.2A(b) shows a case in which synaptic function is present. The upper, middle, and lower panels display possible structures included in the detected area, the observed optical signals, and possible components of the signal, respectively. The observed optical signals are composed of fast spike-like and slow signals. Physiological and pharmacological analyses have indicated that the fast signal corresponds to the presynaptic action potential (pre-AP) and postsynaptic firing (post-AP), and the slow signal, to the excitatory postsynaptic potential (EPSP) (also see Sect. 3.1). In the case of a mixed nerve such as the vagus nerve shown in Fig. 9.2B, the situation is more complex as the nerve contains motor and sensory nerve fibers that cannot be surgically separated. Therefore, stimulation simultaneously evokes antidromic action potentials in motoneurons and orthodromic action potentials in sensory nerve fibers, which are difficult to distinguish in the region where the motor and sensory nuclei functionally overlap.
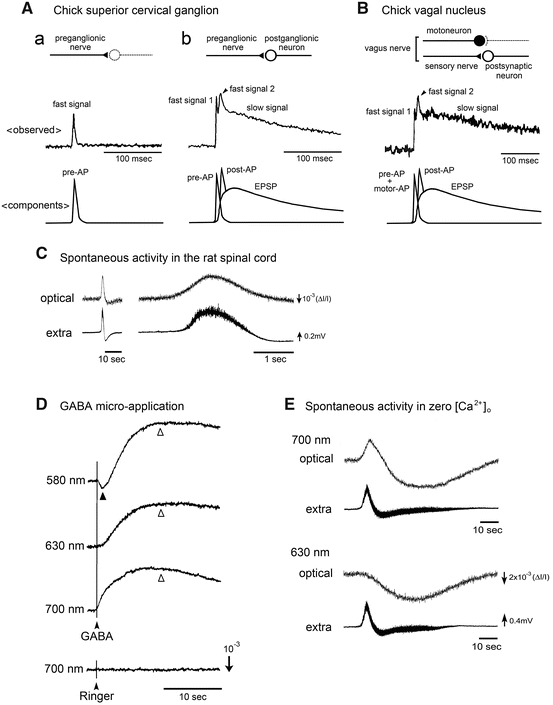

Fig. 9.2
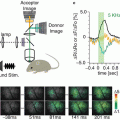
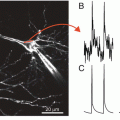
Representation of different components of the optical signal. (A–B): Plausible origins of the fast and slow components of the optical signal evoked by stimulation of the preganglionic fibers in the chick superior cervical ganglion (A) and by stimulation of the vagus nerve in the chick brainstem (B). A(a) shows the case in which synaptic functions have not been generated or are blocked pharmacologically. A(b) and B show the case in which synaptic function is present. The upper panels show possible structures contributing to the optical signal. The middle panels display the detected optical signals. The lower panels present possible components of the optical signal. Pre-AP, post-AP, motor-AP, and EPSP indicate the presynaptic action potential, postsynaptic firing, action potential in motoneurons, and excitatory postsynaptic potential, respectively. (C) Optical (upper traces) and electrophysiological (lower traces) recordings of spontaneous activity from the lumbar spinal cord of an E17 rat embryo. The right traces are the expanded time base of the left traces. The electrophysiological recordings were made from the ventral root with a suction electrode. The optical signal exhibited a smooth waveform, which resembled the DC potential change of the electrical signal. (D) Optical signals evoked by micro-application of GABA in the chick brainstem. The recordings were made at 580 nm (top trace), 630 nm (second trace), and 700 nm (third trace). The thin line with an arrowhead shows the timing of GABA’s application. The first component indicated by a solid triangle is the voltage-dependent extrinsic signal, and the second component indicated by open triangles is the intrinsic light scattering change. Note that the first extrinsic component is downward at 580 nm (decrease in absorption/increase in transmitted light intensity), upward at 700 nm, and null at 630 nm, which is the isosbestic wavelength of NK2761. The lower trace represents a control, which was obtained by micro-application of Ringer’s solution. (E) Spontaneous activity recorded from the rat lumbar spinal cord in a zero-[Ca2+]o solution. At 700 nm (upper traces), the optical signal showed a biphasic waveform, while at 630 nm (lower traces), only a long-lasting downward signal was observed
Action potential-related fast optical signals are not clearly identified in some recordings although they are expected to be present. For example, dorsal root stimulation in the embryonic chick and neonatal rat spinal cords evoked action potential-related fast signals and EPSP-related slow signals in the dorsal horn, while only a slow component was detected in the ventral region (Arai et al. 1999; Mochida et al. 2001a; Ziskind-Conhaim and Redman 2005). In association with correlated wave activity, bursting discharges were electrically recorded in the cranial and spinal motor nerves, while the corresponding spike-like discharges were not relevant to optical recordings (Momose-Sato et al. 2005, 2007c, 2009, 2012a; Ren et al. 2006) (Fig. 9.2C). The amplitude of the optical signal is proportional to the magnitude of the change in membrane potential in each cell and process, and to the membrane area of activated neural elements within the receptive field of one photodiode. Thus, if the action potentials are asynchronous between neighboring neurons or originate from a small active membrane area, they are possibly undetected as clear spike-like signals.
Optical signals are classified into two groups: an extrinsic signal that depends on the absorption or fluorescence of the dye, and an intrinsic signal (Cohen and Salzberg 1978; Bonhoeffer and Grinvald 1995; Sato et al. 2004b). To check whether the detected signal contains any intrinsic optical change, the following procedures are useful. First, each voltage-sensitive dye has its own action spectrum, and thus, the wavelength dependence of the detected signals is one criterion to show that they are related to changes in membrane potential. Second, measurements from unstained preparations can be used to characterize the intrinsic signal.
Intrinsic light scattering changes are sometimes detected along with the voltage-dependent extrinsic signal in in vitro embryonic preparations. The micro-application of glutamate, γ-aminobutyric acid (GABA), and glycine to the embryonic brainstem slices induces a biphasic optical signal (Sato et al. 1997, 2001; Momose-Sato et al. 1998). An example is shown for GABA in Fig. 9.2D. The first component (indicated with a solid triangle) is wavelength-dependent and corresponds to membrane depolarization. The second, large slow component (indicated with open triangles) shows the same sign independent of wavelength and is observed in unstained preparations, indicating that this is an intrinsic optical change. Intrinsic signals with large amplitudes have also been reported in two studies in relation with correlated wave activity. One study found an increase in light transmission accompanying a non-synaptic wave recorded in a low or zero-[Ca2+]o solution in the rat medulla-spinal cord (Ren et al. 2006) (Fig. 9.2E). In the other study, two types of intrinsic signals, a slow decrease and a fast rhythmic increase in light transmission, were observed in association with the spontaneous episode of activity in the chick spinal cord (Arai et al. 2007). Intrinsic signals in in vitro preparations have been attributed to several factors including alterations in cellular volume and extracellular space, organelle swelling or dendritic beading, and neurosecretion at the active terminal (Salzberg et al. 1985; Sato et al. 2004b). The intrinsic signals induced by the micro-application of glutamate and GABA/glycine seem to be associated with cell swelling and cell shrinkage, respectively (Sato et al. 1997, 2001; Momose-Sato et al. 1998). The mechanisms underlying the intrinsic signals that accompany correlated activity are not well understood. Nevertheless, these signals can be used to complement the information obtained by imaging using extrinsic dyes, without the risk of phototoxicity (Arai et al. 2007).
Whether the optical signals detected from the embryonic brain contain a glial component is an important question; however, this has not yet been fully clarified. Glial differentiation generally occurs later in development after neuronal differentiation and migration are largely complete. The mature neuroglial form in the chick embryo has not been reported earlier than E8, while glial progenitor cells and radial glia-like structures appear earlier (Thomas et al. 2000; Korn and Cramer 2008). Optical signals similar to those recorded with NK2761 are observed using the voltage-sensitive dye, NK3630 (RH482), which is known to be relatively insensitive to changes in the membrane potential of glial cells (Konnerth et al. 1987). Although this result does not allow us to identify the relative contribution of glial components because the affinity of the dye for glial progenitor cells and radial glia remains unknown, it appears likely that adult-type astrocytes and oligodendrocytes are not the main contributors to the optical signal. It has been shown that Ca2+ waves propagate through radial glia in the developing neocortex (Weissman et al. 2004), and the contribution of these cells to the optical signal, especially to correlated wave activity discussed later in Sect. 4 in this chapter, should be examined further.
3 Application to the Study of Developing Neuronal Circuits
Optical recordings give dynamic spatio-temporal information on neural responses, and the visualization of neural circuits during their formative stages opens up many new avenues for experiments. Since the first application of voltage-sensitive dyes to the embryonic nervous system (Sakai et al. 1985; Kamino et al. 1989b), extensive investigations have been devoted to ontogenetic analyses of specific neuronal circuits in the brainstem, forebrain, spinal cord, and peripheral nervous system (Table 9.1). Some of these have been discussed previously in detail (Momose-Sato et al. 2001a; Momose-Sato and Sato 2006, 2011; Glover et al. 2008; O’Donovan et al. 2008), and here we briefly outline the key characteristics that have been revealed by optical studies.
Table 9.1
Application of voltage-sensitive dyes to the embryonic nervous system
Chick olfactory system (I) | Sato et al. (2007) |
Chick visual system (II) | Miyakawa et al. (2004) |
Chick oculomotor, trochlear and abducens nuclei (III, IV, VI) | Glover et al. (2003)a |
Chick trigeminal nucleus (V) | Sakai et al. (1985) Momose-Sato and Sato (2014b) Sato et al. (1999) |
Chick vestibulo-cochlear nucleus (VIII) | Asako et al. (1999) Glover et al. (2003)a Momose-Sato et al. (2006) Sato and Momose-Sato (2003) |
Chick glossopharyngeal nucleus (IX) | Momose-Sato et al. (2007b) |
Chick vagal nucleus (X) (including pharmacological studies on NTS neurons) | Komuro et al. (1991) Momose-Sato and Sato (2005) Sato and Momose-Sato (2004a) |
Chick spinal cord | Mochida et al. (2001a) |
Rat trigeminal nucleus (V) | |
Rat facial nucleus (VII) | Momose-Sato et al. (2007c) |
Rat glossopharyngeal nucleus (IX) | Momose-Sato et al. (2011) |
Rat vagal nucleus (X) | |
Rat respiratory center | Onimaru and Homma (2005) Ikeda et al. (2004) |
Rat spinal cord | Demir et al. (2002) |
Peripheral nervous system | |
Correlated wave activity | |
Chick | Arai et al. (2007) Komuro et al. (1993) Momose-Sato and Sato (2014a) |
Rat | Ren et al. (2006) |
Mouse | |
Dye screening and improvements in optical recording systems | Hirota et al. (1995) Momose-Sato et al. (1995b) Mullah et al. (2013) Tsau et al. (1996) Wenner et al. (1996) |
3.1 Identification of the Action Potential and Postsynaptic Response
The functional development of specific neuronal circuits has been most extensively studied in the chick vagal pathway (Table 9.1) (for reviews see Momose-Sato and Sato 2006, 2011), and the characteristics of optical signals as antidromic and orthodromic action potentials and postsynaptic responses were first established in this system. Following electrical stimulation of the vagus nerve, tetrodotoxin (TTX)-dependent fast spike-like signals were detected in the dorsal region of the brainstem, which correspond to antidromically evoked action potentials in vagal motoneurons and orthodromically propagated action potentials in vagal afferents (Kamino et al. 1989b). By comparing the spatial distribution of optical signals with anatomical information, the sources of the signals have been identified as the dorsal motor nucleus of the vagus nerve (DMNV) and the nucleus of the tractus solitarius (NTS), respectively. In addition to the TTX-dependent fast optical signals, slower and longer-lasting signals appear in the NTS at the later stage (Komuro et al. 1991). These signals were diminished by lowering the extracellular Ca2+ concentration and abolished by Mn2+ and Cd2+, and were also sensitive to glutamate receptor antagonists, indicating that they represent excitatory postsynaptic potentials (EPSPs) in second-order neurons within the NTS. The early phase of these signals was mediated by the non-N-methyl-d-aspartate (NMDA) receptor, whereas the later phase was dependent on the NMDA receptor’s function (Komuro et al. 1991; Momose-Sato et al. 1994). These EPSP-related optical signals were easily fatigued at the earliest stages of their appearance and increased in amplitude and robustness with development, demonstrating that voltage-sensitive dye recordings provide information about synaptic strength during the formation and later maturation of synapses.
Fast spike-like and slow optical signals with similar characteristics to those identified in the chick vagal pathway have also been observed in other cranial nuclei and spinal cord (Table 9.1). An exceptional finding was that Ca2+-dependent action potentials were detected in the rat DMNV during particular developmental stages (Momose-Sato et al. 1999b). Ca2+ spikes were observed from E14 to a few days after birth (Fukuda et al. 1987; Momose-Sato et al. 1999b), suggesting that they are transiently expressed during development.
3.2 Functional Organization of the Motor and Sensory Nuclei
By combining voltage-sensitive dye recording and pharmacological manipulation, it is possible to chart the development of afferent and efferent projections and of central synaptic connections. The antidromic action potentials in motoneurons and orthodromic action potentials in afferent nerves can be detected at very early stages, as the motor and sensory axons are extending out of and into the brain and spinal cord. For example, action potentials in the chick glossopharyngeal and vagal pathways appear from Hamburger-Hamilton stages 23–24 (E3.5–E4) (Momose-Sato et al. 1991b, 2007b; Sato et al. 2002b), and those in the rat vagal pathway can be detected as early as E12 (Sato et al. 2000). Comparing the time of appearance of the optical signals with the birthdates of neural populations, it has been suggested that the motor and sensory neurons are electrically excitable soon after the final mitosis and as their axons are going to or from the periphery.
The time of appearance of slow optical signals indicates an expression of functional synaptic transmission. The onset of synaptic function in the chick embryo is earliest in the visual system (stage 27, E5.5) (Miyakawa et al. 2004), followed by the olfactory bulb, ophthalmic nucleus of the trigeminal nerve, spinal cord at stages 28–29 (E6) (Sato et al. 1999, 2007; Mochida et al. 2001a; Momose-Sato and Sato 2014b), and then the other systems at stage 30 (E7) (Momose-Sato et al. 1991b, 1994; Sato et al. 1999; Sato and Momose-Sato 2003, 2004b). In the rat embryo, the development of synaptic function has been studied in the trigeminal, glossopharyngeal, and vagal pathways, in which the EPSP-related slow optical signals appear at E14–E15 (Sato et al. 1998; Momose-Sato et al. 2004, 2011). As expected from NMDA receptor mediation of postsynaptic responses, the EPSP can be revealed at slightly earlier stages by eliminating Mg2+ from the bathing solution. This suggests that the NMDA receptor’s function of postsynaptic neurons and glutamate-releasing activity in the sensory terminals have already been generated prior to the expression of non-NMDA receptors, and the onset of synaptic function is regulated by extracellular Mg2+.
Stay updated, free articles. Join our Telegram channel

Full access? Get Clinical Tree


