Fig. 7.1
Photodiode array, absorption spectra and signal-to-noise ratio. (a) WuTech 469 V photodiode array, a commercial version of the photodiode arrays developed by Cohen group (Cohen and Lesher 1986). WuTech 469 V has an integrated design with all 464 diode amplifiers housed together with the fiber optic bundles. This reduces both light and electrical interference. The hexagonal optic fiber bundle contains 469 optical fibers. Each of fibers is glued to a PIN photodiode and each diode is wired to a dedicated two-stage amplifier (b) Circuit diagram of one amplifier channel. The first stage converts the photocurrent outflow of the diode into voltage; the reset switch and the coupling capacitor C subtract the DC component in the light. The second stage provides a 100× voltage gain to boost the effective dynamic range. (c) The absorption spectrum of unstained slices (unfilled circles) and a slice stained with NK3630 (solid dots). (d) VSD signal amplitude at different wavelengths. Note that the maximum amplitude is not at the peak absorbance. (e) Signal-to-noise ratio at different wavelengths. (Modified from Jin et al. 2002)
Photo-current from each diode is fed into a two stage amplifier circuit (Fig. 7.1b). The first stage converts the photocurrent into voltage-signal, about 5 V in our absorption measurements. This voltage signal has two components: one is a large DC voltage corresponding to resting light intensity. The second component is the dye signal, a small fractional change in the resting light. This signal ranges from 10−5 to 10−3 for absorption measurements and 10−3 to 10−2 for fluorescent measurements. For absorption measurements, the output of the first stage amplifier has a very small signal of 0.05–5 mV riding on top of a large 5 V resting light signal. If, for example, this 5 V + 0.5 mV is digitized directly by a 14 bit A/D converter, the 0.5 mV signal would be digitized by less than 1 bit, which is not sufficiently precise. In order to digitize 0.5 mV signal with at least 7 bit range, a DC subtraction circuit is used between the first and second stage amplifiers, for a hardware background subtraction (Fig. 7.1b).
The DC subtraction is done at the beginning of each recording trial when the illumination light is turned on. At this time the “reset” switch is closed and the capacitor C is charged to the output voltage of the resting light intensity. After about 80 ms when the C is fully charged, the reset switch is opened to allow recording to begin. Since the capacitor is charged to the same voltage as the resting light intensity at the input of the second stage, the voltage from the first stage and the voltage on the capacitor will be equal and have opposite polarities, resulting in a subtracted zero resting light intensity voltage. The second stage can then apply 100× to 1,000× voltage gain to the signal. As a result, a 100× voltage gain will extend the dynamic range of the imaging device by ~8 bit. Since resting light intensity on different detectors can differ largely, each diode needs a dedicated DC subtraction circuit between the first and second amplifier stage (Cohen and Lesher 1986; Wu and Cohen 1993). For this reason, the photodiode array with high spatial resolution is bulky and difficult to manufacture.
We use a 14 bit data acquisition board (Microstar Laboratories, Bellevue, WA) installed in a desktop PC computer. The second stage amplifier also contains a low pass filter with 333 Hz corner frequency; this hardware filter will further improve the quality of the analog signal before digitizing. The sampling speed needs to be faster than any events to be measured, usually 1,000–2,000 frames/s are adequate for imaging brain slices.
7 Microscope and Light Source
For imaging with absorption dyes, inexpensive low NA objectives and a conventional 100 W tungsten halogen lamp from an ordinary research microscope can provide excellent results. 735 nm LED illuminator (ThorLabs) can also be used for illumination. LED illuminator runs cool, which appears to be better than the hot halogen lamp. However, LED can flicker at much higher frequency and so it is much more difficult to reduce the light fluctuation down to 10−5 of the illumination intensity (ordinary “super stable” LED driver uses switching circuit and only provides noise level down to 10−3). Battery and a constant current source with linear (non-switching) circuits may be necessary for powering the LED.
For large imaging field such as that shown in Figs. 7.5, 7.6, and 7.7, we use a 5× 0.12 NA objective (Zeiss). When working with smaller imaging fields, 20× (0.6 NA, water immersion, Zeiss) or 40× (0.75 NA, water immersion, Zeiss) can be used accordingly. When a 5× objective is used, each photodetector of a 464-diode array receives light from a tissue area of 150 μm in diameter.
In absorption measurements in brain slice, the resting light intensity is usually about one billion photons per millisecond on each optical detector. The dye molecules absorb most of the light in the wavelength used for the measurement. Unstained tissue slices absorb an insignificant fraction of the light (Fig. 7.1c). The resting light intensity on each photodiode is about 109 photons per milliseconds.
For in vivo imaging of mammalian cortex with fluorescent dyes, high light gathering optics are necessary. We use a 5× “macroscope”, which provides an imaging field of 4 mm in diameter (Kleinfeld and Delaney 1996; Prechtl, Cohen et al. 1997). The macroscope uses a commercial video camera lens (Navitar, 25 mm F0.95). This inexpensive camera lens provides a high numerical aperture of 0.45, compared to an ordinary 4× microscope objective (~0.12 NA). Such a high numerical aperture can gather about 100 times more light, significantly increasing the signal-to-noise ratio for in vivo fluorescent imaging. A tungsten halogen filament lamp (12 V, 100 W, Zeiss) or 630 nm LED (ThorLabs) can be used for illumination. Again the LED may need to be powered by a battery and a linear constant current source.
8 Optical Filters
Figure 7.1c shows the absorption spectrum of a cortical slice stained with dye NK3630 and an unstained slice. The unstained slice has a relatively even transmission with a tendency to absorb less at longer wavelengths (Fig. 7.1c, open circles). The stained slice has a peak of absorption around 670 nm (Fig. 7.1c, solid circles) and the peak stays the same after a long wash with dye-free ACSF. The light transmission at 670 nm (peak absorption) through a 400 μm well stained slice is reduced to 1/10–1/50 of that of unstained slices.
In Fig. 7.1d, e, the amplitudes of the dye signal (dI/I) and signal-to-noise ratio are plotted against wavelength. The dI/I and signal-to-noise ratio reaches a maximum at 705 nm. The signal decreases significantly at wavelengths shorter than 690 nm and reaches a minimum at ~675 nm. At wavelengths shorter than 670 nm the signal became larger but the polarity of the signal reverses. The signal reaches a second maximum at 660 nm. After the 660 nm peak, the signal decreases gradually and becomes undetectable at wavelengths of 550 nm or shorter. The signal-to-noise ratio at the 660 nm was not large in our actual measurement (Fig. 7.1e), probably due to less resting light at the wavelength. The plots in Fig. 7.1c–e indicate several useful wavelengths: for non-ratiometric measurement, band pass filtering around 705 nm should yield the largest signal; an alternating illumination at 700 and 660 nm may be used for ratiometric measurements; illumination at 675 nm should provide a minimum VSD signal, which can be used for measuring light scattering or for distinguishing VSD from broad-band intrinsic signals.
Optical filters for NK3630 should have a center wavelength around 705 nm. The bandwidth of the filter depends upon several factors: When the signal is small and shot noise is a limiting factor, a wider bandpass allows more light and thus increases the signal-to-noise ratio. In this case, the filter should have a center wavelength of 715 nm and a bandwidth of ±30 nm. When measuring large signals and when a long total recording time is needed, a narrow band filter of 705 ± 15 nm should be used to reduce the illumination intensity. When the illumination light is strong enough, using narrow band filters helps to get larger signals and reduce dye bleaching and phototoxicity. Since the measurement wavelength is between 700 and 750 nm (Fig. 7.1d, e), the heat filter (infrared filter) in front of the light housing absorbs most energy in this range. For absorption measurements, this heat filter must be removed from the light path.
When the 735 nm LED illuminator is used for NK3630, the excitation filter may be omitted. This increases the light throughput significantly. However, the LED provides high intensity from 735 to 755 nm, which gives little VSD signal but large intrinsic optical signals (light scattering). The intrinsic optical signal appears as a large and slow drift of the baseline of the VSD recording traces (Fig. 7.3b-2, trace 2). In some recordings a flat baseline is preferred and a narrow band filter of 735 ± 10 nm can be used to reduce intrinsic signal.
For imaging mammalian cortex with the blue dyes, a filter cube (from Chroma or Semrock) is used, with a 630 ± 15 nm excitation filter, 655 nm dichroic mirror (Chroma Technology) and a 695 nm long pass filter. This filter cube fits well for both halogen lamp and LED. Köhler illumination is achieved with the macroscope.
9 Detecting Vibration Noise
Vibration noise is often the dominant noise source when recording absorption signals from brain slices. Vibration causes a movement of the image related to a photodetector and thus causes a fluctuation of the light intensity. Absorption measurement is characterized by small fractional changes and a high resting light intensity, so it is more sensitive to movement of the preparation compared to fluorescence measurements.
Vibration noise is proportional to the resting light intensity while shot noise is proportional to the square root of the light intensity. Thus when illumination intensity increases, vibration noise will ultimately become dominant. Above the level where vibration noise equals the shot noise, signal-to-noise ratio will no longer increase with higher illumination intensity. Therefore vibration control in many situations determines the ultimate signal-to-noise ratio.
In practice, we use the following method to evaluate the vibration noise on any given experimental set-up. (1) Under Koehler illumination, reduce the field diaphragm of the microscope so that a clear image of the diaphragm (as a round hole with a sharp edge) is formed in the field of view and projects the image onto the diode array. The sharp edge of the image generates a near maximum contrast on the imaging system. Due to vibration, the edge may move in the image plane so that the light intensity on some detectors recording the diaphragm edge will fluctuate between minimum and maximum. The intensity change on these photodetectors will reflect the worst possible scenario of vibration noise. The power spectrum of the signals from these noisy detectors viewing the edge of the field diaphragm can help to determine the vibration source. In many modern buildings, ~30 Hz floor vibrations are caused by ventilation fan motors attached to the building structure. Vibrations at less than 5 Hz sometimes come from movement of the building in wind, or resonance of the floor. When the experimental stage is properly isolated, noise at the edge of the field diaphragm should be no larger than that in the center of the aperture, indicating that the dominant noise is no longer vibration, but shot noise. With the chamber and preparation inserted into the light path, the vibration noise may also become larger because of the vibration of the water-air interface. A cover slip or water immersion lens can eliminate this vibration noise.
We find that many air tables and active isolation platforms perform poorly in filtering vibrations below 5 Hz. A novel isolation stage designed for atomic force microscopy, the “Minus K” table (www.minusk.com), is approximately ten times better at attenuating these frequencies than some standard air tables. With the Minus K table, the vibration noise can be reduced to below the level of shot noise at a resting light intensity of ~1011 photons/ms/mm2.
10 Data Acquisition and Analysis
NeuroPlex, developed by A. Cohen and C. Bleau of RedShirtImaging, LLC, Decatur, GA, is a versatile program for acquiring and analyzing VSD data. The program can display the data in the form of traces for numerical analysis and pseudo color images for studying the spatiotemporal patterns. Data analysis can also be done with scripts written in MatLab (Mathworks). The singular value decomposition (SVD) method (Precthl et al. 1997) is a very effective way for removing random noise (e.g., shot noise) from the signal.
The figures in this chapter are examples of data display where the signal from the local field potential (LFP) electrode and that of an optical detector viewing the same location are plotted together. The spatiotemporal patterns of the activity are often presented with pseudo color maps (Senseman et al. 1990). To compose a pseudo color map, the signal from each individual detector is normalized to its own maximum amplitude (peak = 1 and baseline/negative peak = 0), and a scale of 16 or 256 colors is linearly assigned to the values between 0 and 1.
The imaging data are acquired at a high rate, usually at approximately 1,600 frames per second. Figures in published papers usually include only a few frames selected from this large imaging series. The signal-to-noise ratio is usually defined as the amplitude of the VSD signal divided by the root mean square (RMS) value of the baseline noise. Since most population neuronal activity in the neocortex is below 100 Hz, a low pass filter can be used to reduce RMS noise and improve the signal-to-noise ratio.
11 Sensitivity
The sensitivity of VSD measurement can be estimated by comparing the measurement with LFP recorded from the same tissue. Achieving a high sensitivity comparable to LFP recordings is important not only for detecting small population activity, but also for detecting spatiotemporal patterns when multiple trial averaging is not allowed.
In the experiment shown in Fig. 7.2, we used a rat neocortical slice stained with NK3630. Cortical layers II–III were monitored optically and a LFP electrode was placed inside of the imaging field of the array (Fig. 7.2a). Electrical stimulation is delivered in deep cortical layers and the evoked neuronal response in layers II–III is monitored both optically by the diode array and electrically by the local field potential electrode (Fig. 7.2b). At low stimulus intensities (0.8–2 V, 0.04 ms), the amplitude of the VSD and LFP is approximately linear with the stimulus intensity (Fig. 7.2d). Although the thresholds for VSD and LFP measurements varied in different slices, we found that the sensitivity of the VSD measurement is always higher than that of the LFP if the slice was properly stained (Jin et al. 2002).
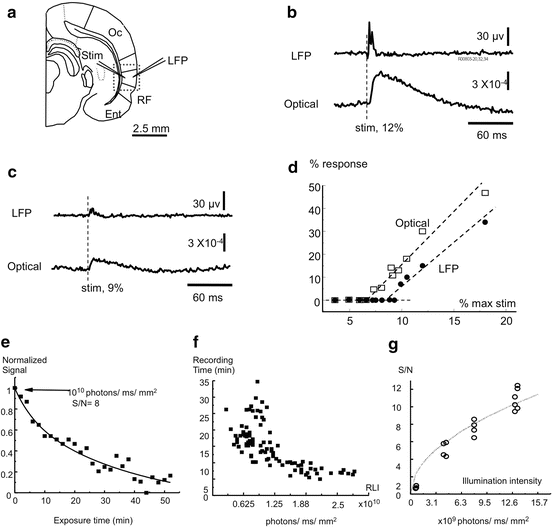

Fig. 7.2
Sensitivity of VSD imaging, dye bleaching and total recording time. (a) Experimental arrangement. Rat cortical slices are stained with NK3630 and imaged with a 5× 0.12 NA objective. The broken line marks the imaging field. Local field potential (LFP) is recorded from layer II–III, where a photo detector is viewing an area of 200 × 200 μm2 of the tissue recorded by the electrode. Electrical stimulation (Stim) is delivered to deep layers. (b) At 12 % of the stimulation intensity that generated a maximal response, neuronal response is visible in both LFP and VSD signals. Note that stimulation artifact does not appear in the VSD signal. (c) A smaller stimulus evokes a reduced response in both VSD and LFP signals. A series of stimuli around the response threshold were applied to test the sensitivity of VSD recordings. (d) A plot of response amplitude at different stimulation intensities. Note that both VSD signals (squares) and LFP signals (dots) are linearly related to the stimulation intensity, and the sensitivity of VSD appears higher than that of the LFP. (e) Reduction of VSD signals due to light exposure. The slice was stained with NK3630 and exposed to an illumination intensity of 5 × 10¹¹ photons/ms/mm2 (resting light intensity was ~1010 photons/ms/mm2). The exposures were 2 min trials with 2 min intermittent dark periods. (f) The total recording time is defined as the exposure time needed for the VSD signals to decrease to 50 % of the pre-exposure amplitude. The plot was composed of data from ~25 locations in four slices. (g) Signal-to-noise ratio of absorption measurement at different resting light intensities. The signal is the neuronal response in cortical layer II–III evoked by an electrical stimulation in deep layers. (Modified from Jin et al. 2002)
In an ideal situation, the sensitivity of the measurement is limited only by the shot noise (the statistical fluctuations in the photon flux). In measurements using absorption dyes, the shot noise can be dominant when the resting light intensity is higher than 5 × 10⁹ photons/ms/mm2. This resting light intensity can be achieved with an ordinary 100 W tungsten-halogen filament lamp. Since the amplitude of the VSD signal is proportional to the resting light intensity while the shot noise is proportional to the square root of the resting light intensity, the signal-to-noise ratio is proportional to the square root of the resting light intensity (Cohen and Lesher 1986). Therefore increasing the illumination light can increase the signal-to-noise ratio. The diode array is a noise free imaging device in a wide range of light intensities when the shot noise dominates, because the dark noise of the system becomes negligible. However, the resting light intensity cannot be increased infinitely. Due to dye bleaching and phototoxicity, resting light intensity is a limiting factor for total recording time from a given field of view (see below).
12 Phototoxicity, Bleaching and Total Recording Time
When stained slices are continuously exposed to high intensity light (e.g., ~1012 photons/ms/mm2), noticeable decline of both LFP and VSD signals is observed after 5–10 min. We refer to this reduction in electrical activity caused by light exposure as phototoxicity or photodynamic damage (Cohen and Salzberg 1978). Phototoxicity in cortical slices appears to be irreversible even after a long dark recovery period. Absorption dyes have much less phototoxicity than the fluorescent dye RH795 in brain slice experiments, probably because the latter produces free radicals when it is in the excited state.
Intermittent light exposure significantly reduces phototoxicity. With the same high intensity of 1012 photons/ms/mm2, when the exposure was broken into 2 min sessions with 2 min dark intervals, the phototoxicity of NK3630 was smaller. The LFP signals decreased <30 % after 60 min of total exposure time. The optical signals, however, decreased ~90 % (Fig. 7.2e). We refer to the reduction in optical signal while LFP signals remain unchanged as “bleaching”. After long light exposure, bleaching is visible even by eye, as loss of color in the exposed area. Optical signals can not be recovered in the bleached area even if the preparation is re-stained.
We define the total recording time as the exposure time needed to reduce the amplitude of the optical signal to 50 % of the pre-exposure level. Figure 7.2f shows the total recording time at different resting light intensities. Figure 7.2g shows the signal-to-noise ratio at four resting light intensities. Combining the results in Fig. 7.2f, g, we conclude that when illumination intensity is adjusted for a signal-to-noise ratio of 8–10, the total recording time is about 15–30 min. This time can be divided into hundreds of intermittent recording sessions (e.g., 100 of 8 s trials), enough for most of applications.
The total recording time of the fluorescent dye RH795 seems to be limited by phototoxicity. When slices stained with RH795 were illuminated with 520 nm light at an intensity of ~1012 photons/ms/mm2, both LFP and optical signals disappeared in a few trials of 2 min exposures. After the signals disappeared, the fluorescence of the stained tissue remained at ~80 % of the pre-exposure level, suggesting that phototoxicity occurred and bleaching was insignificant.
13 Waveforms of the Population VSD Signal
When a single neuron was simultaneously monitored by a photo detector and an intracellular electrode, the waveforms of the two recordings were remarkably similar (Fig. 7.3a; Ross et al. 1977; Zecevic 1996). However, for population activity, the VSD signal may be greatly different from that recorded with an electrode.
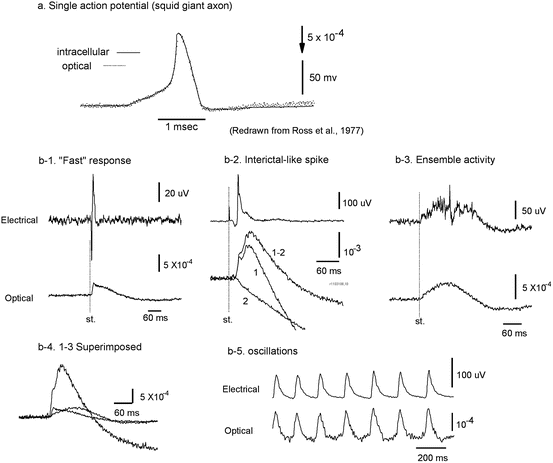

Fig. 7.3
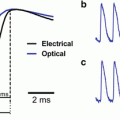
Waveform of optical and electrical recordings. (a) VSD and intracellular recordings from a squid giant axon. The axon was stained with absorption dye XVII and the optical signal was measured at 705 nm (dotted trace). The actual membrane potential change (smooth trace) was simultaneously recorded by an intracellular electrode. The time course of the VSD signal mirrored precisely the time course of membrane potential change. (Redrawn from Ross et al. 1977, with permission from Springer). (b) LFP recordings (top traces) and VSD recordings (bottom traces) during different types of population activity. The recordings were simultaneously made from the same location in cortical layers II–III of rat somatosensory cortical slices. (b–1) A short latency activity (fast response) was evoked by an electrical shock to the white matter; the slice was bathed in normal ACSF. (b–2) An evoked interictal spike (Tsau et al. 1999); the slice was bathed in 10 μM bicuculline. During this activity, a large fraction of neurons were activated and changes in light scattering also contributed to the signal. Here, trace 1 is the light intensity change at 705 nm; trace 2 is the intensity change at 520 nm, presumably the light scattering signal; subtraction of the signal at the two wavelengths (trace 1–2) estimates the VSD signal without contamination from light scattering signal. (b–3) An evoked population oscillation (Wu et al. 2001). (b–4) VSD traces of b–1, b–2 (trace 1–2), and b–3 are superimposed, showing the difference in amplitude and time course. (b–5) A spontaneous 7–10 Hz oscillation (Wu et al. 1999) in which LFP and VSD signals are well correlated. (Modified from Jin et al. 2002)
Figure 7.3b compares the waveforms of LFP (top traces) and VSD (bottom traces) recordings during different types of neuronal activity in neocortex. Figure 7.3b-1 shows a short latency (“Fast”) response to an electrical stimulus to the white matter. This response has a short latency and the amplitude of VSD signal is proportional to the stimulus intensity. Presumably the response is mainly based on depolarization of neurons stimulated either directly or via a few synapses. The LFP response had a short duration (<30 ms) but the VSD signal from the tissue surrounding the electrode had a much longer duration. This long-lasting optical signal did not appear at 520 nm, indicating that it was a wavelength dependent VSD signal, and not a wavelength-independent light-scattering (“intrinsic”) signal. Dye molecules bound to the glial cells may also contribute to this long response due to glial membrane potential change caused by glutamate transporters (Kojima et al. 1999; Momose-Sato et al. 1999).
Figure 7.3b-2 shows the signals from an interictal-like spike (slice bathed in 10 μM bicuculline) evoked by weak electrical shock to the white matter, measured in cortical layers II–III. Interictal-like spikes are all-or-none population events; the amplitude of the dye signal is relatively large and independent of the stimulus intensity. Again, VSD signals had a long duration with a smooth waveform while LFP signals had a short duration and large fluctuations. The VSD signal during an interictal-like spike had an obvious undershoot (downward phase below the baseline following the positive peak). Part of this undershoot also occurred at 520 nm (Fig. 7.3b-2, trace 2), suggesting that it was caused by a light scattering signal. The sign of the light scattering signal under trans-illumination was opposite to that of the VSD signal of NK3630 at 705 nm.
Figure 7.3b-3 shows 40–80 Hz oscillations evoked by an electrical stimulus (Luhmann and Prince 1990; Metherate and Cruikshank 1999). The oscillations are only seen in LFP recordings but not in the VSD signals, suggesting that the local oscillatory populations are small and neurons with different phases are mixed (Wu et al. 2001). The VSD signal amplitude is only about 1/10–1/4 of that of the interictal-like spikes (Fig. 7.3b-2). This indicates that this type of ensemble activity involves a much smaller fraction of active neurons than do interictal-like spikes.
In Fig. 7.3b-4, the waveforms of VSD signals during the three types of population events depicted in Fig. 7.3b-1–b-3 are superimposed, illustrating differences in amplitude and time course. If the neurons are evenly stained, the amplitude of the VSD signal and the amount of synchrony in neuronal activity should have a liner relationship. The same should hold for the relationship between the area under the waveform envelope and the overall depolarization and spikes during the event. Figure 7.3b-4 suggests that the synchrony and duration during different cortical events are two independent variables. Higher synchrony (a larger portion of neurons depolarizing in each time bin) are not always accompanied by longer duration.
Stay updated, free articles. Join our Telegram channel

Full access? Get Clinical Tree


