Fig. 27.1
Diagram depicts “target volume” that needs to be ablated for optimal treatment. This includes the tumor volume plus an added rim of “ablative margin” beyond the tumor
2.
Preventing injury to adjacent critical structures: It is important to restrict the volume of ablated surrounding parenchyma to the ablative margin required and avoid “over ablating.” Even more important is to prevent injury to critical structures that may be adjacent to or near the tumor that is being treated.
Successful monitoring of thermal ablation requires real-time or near-real-time information regarding the necrosis zone being created during the application of the ablative agent. While monitoring is a passive process, the ultimate goal of monitoring is to control the ablation. If the tumor is not being covered completely, additional ablations can be performed or additional applicators can be placed during the same procedure to ablate the tumor completely. On the other hand, if the ablation approaches critical structures, then it can be stopped, or in the case of cryoablation, individual applicators can be controlled to prevent the iceball from growing in the direction of the structure that needs to be protected.
Rationale for Cryoablation with MRI Monitoring
Direct intraprocedural monitoring of heat-based ablative methods such as RFA, MWA, and laser ablation is not possible today with CT or US. It is possible to observe effects of these ablative agents with MRI with limitations [3, 4]. Thermal imaging of heat effect is possible with MRI [5–8] (Fig. 27.2). However, this requires specific MRI sequences that are susceptible to motion and not the type of sequences that depict tumor margins or anatomy the best. During cryoablation, only parts of the iceball can be visualized with US or CT [9–11] (Fig. 27.3). Compared to all these limitations, cryoablation coupled with MRI provides the best combination. Iceball is well visualized as a near signal void structure with sharp margins on all pulse sequences and in all tissues [12–14]. Hence, any pulse sequence that shows the tumor and critical structures well can be used to visualize and monitor the iceball in multiple planes (Fig. 27.4). The iceball volume during the ablation procedure correlates well with postprocedural cryonecrosis [12].
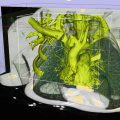
Fig. 27.2
Color-coded temperature map created using gradient echo MR thermometry during ex vivo radiofrequency ablation of bovine liver
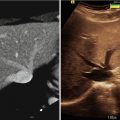
Fig. 27.3
CT-guided cryoablation of renal tumor. Axial CT image shows the iceball margin well in renal soft tissue (arrow) but not in perinephric fat
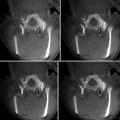
Fig. 27.4
3T MRI-guided cryoablation of renal tumor. Axial T2-weighted TSE images show part of tumor not covered by the iceball (arrow) at 9 min of freezing (a) but later covered at 15 min of freezing (b)
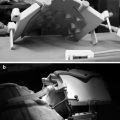
Finally, interventional MRI has evolved from low-field to high-field magnets. The former tends to have the advantage of being open configuration with easier access to patient but with low image quality and speed. High-field systems are capable of fast and high-resolution imaging with the use of advanced pulse sequences. Their use for interventional procedures was severely limited by their narrow gantry size until recently. Now that wide (70 cm) and shorter-bore high-field magnets are available, ablations are possible.
Qualitative vs. Quantitative Monitoring of Cryoablation
During cryoablation, the iceball gradually enlarges in size during a typical 10–15 min freeze cycle. MRI can be repeated every 3 min and in multiple planes. At each of these time points, the interventionalist has to review all the images by scrolling through them and has a qualitative assessment of tumor coverage and safety of critical structures before the imaging at the next time point. Although useful, this task is complex and can be difficult to achieve, while the interventionalist is also taking care of other aspects of the procedure such as patient care. Findings can be overlooked. Hence, there is a need for quantitative assessment of ablation in real time. Ablation metrics such as percent tumor coverage and Dice similarity coefficient have been proposed for assessment of ablation on follow-up imaging done after the ablation [12]. To compute these metrics during the ablation procedure, real-time automatic segmentation of the iceball and comparison by registration techniques to the segmented tumor are essential [15] (Fig. 27.5). Also the distance of the iceball margin to segmented critical structures can be computed, and all these metrics are displayed for the interventionalist in real time (Fig. 27.5). Using 3D optical flow computation, the upcoming iceball volume and margins can be estimated providing warning if this estimation is too close to critical structures (Fig. 27.5). The success of effective use of these quantitative principles during ablation depends on future work in image processing and computation techniques such as automatic segmentation, registration, and ablation prediction and validation through clinical applications.